


 text in
  English (pdf)
 Article in xml format
 Article references
 Send this article by e-mail
 Cited by SciELO
  Cited by Google
  Similars in
SciELO
Similars in
SciELO  Similars in Google
 Permalink
Introduction
Academic engagement and its measurement
The notion of engagement is related to the appearance of positive psychology that values and focuses on human strengths and optimal functioning (Maslach, Schaufeli, & Leiter, 2001) and is frequently associated with definitions of commitment, involvement, participation, passion, enthusiasm, absorption or energy. (Schaufeli & Bakker, 2010), being all of them inversely connected with emotional exhaustion (Byrne, Peters, & Weston, 2016).
Therefore, engagement is defined as a positive mental state of pleasure related to work, characterized by vigor, dedication and absorption (Schaufeli, Salanova, González-Romá, & Bakker, 2002). In that sense, vigor refers to high levels of energy, effort, and persistence at work; dedication refers to assigning great meaning, enthusiasm, and appreciation to work; and absorption refers to a state of full concentration and happiness when working (Salanova, Schaufeli, Llorens, Peiró, & Grau, 2000). Moreover, these three dimensions refer to the same emotional-affective condition of personal fulfillment (Schaufeli & De Witte, 2017).
Subsequently, the concept was applied to the academic field as academic engagement (Schaufeli, Martinez, Marques-Pinto, Salanova, & Bakker, 2002) since this activity can be seen as a way of working because the student belongs to an organization and there are requirements that must be fulfilled (Hu & Schaufeli, 2009), and if not, his/her stay at the university or his/her chances of graduating within the established deadline would be seriously affected. Similarly, the student must learn to manage the resources provided by the institution, in addition to spending time to attend classes, prepare papers and exams, as well as being immersed in socialization processes in order to meet the demands and obtain an acceptable performance. Thus, a student with high levels of engagement would be willing to invest greater efforts to have energy and sufficient mental resistance while studying (vigor), would express enthusiasm, inspiration and challenge while doing this activity (dedication), and would be focused, very concentrated, absorbed in the activity of studying (absorption) (Schaufeli, Martinez et al., 2002).
The measurement is predominantly carried out with the Utrech Work Engagement Scale - Student (UWES-S; Schaufeli, Martinez et al., 2002), given that the theoretical base model (Salanova, Bresó & Schaufeli, 2005) is the one that shows further evidence with respect to the structure of academic engagement, which is a means of knowing the student's performance problems, motivation and drop-out. There are some recent studies reporting the prevalence of a seventeen-item version's multidimensional structure (Cadime, Lima, Marques-Pinto, & Ribeiro, 2016; Çapri, Gündüz, & Akbay, 2017; Meng & Jin, 2017), and with the abbreviated nine-item version of the UWES (UWES-9S; Schaufeli, Bakker, & Salanova, 2006) with which studies have been developed that make reference to satisfactory psychometric properties, validity and reliability in the academic field (Carmona-Halty, Schaufeli , & Salanova, 2019; Loscalzo, & Giannini, 2019; Römer, 2016; Sánchez-Cardona, Rodríguez-Montalbán, Toro-Alfonso, & Moreno-Velázquez, 2016; Silva, Junior, Coelho, Picharski, & Zagonel, 2018).
However, this approach has been the subject of controversies regarding the definition and number of dimensions that make it up, due to the existence of different engagement assessment instruments that are based on an independent theoretical framework, which has led to the emergence of types of engagement (Medrano, Moretti, & Ortiz, 2015), being the third dimension of engagement (absorption) one of the main focuses of debate as some authors consider it to be an antecedent and that vigor and dedication constitute its central dimensions or the core of engagement, so there are alternative measurement models focused on these dimensions (Medrano et al., 2015; Schaufeli & Salanova, 2007, 2011). In spite of this, some aspects must be taken into account.
First, high inter- factor correlations were observed, which are usually indications of factor redundancy (Kline, 2016), but their presence was only mentioned but not addressed beyond description (e.g, Cadime et al., 2016; Loscalzo & Giannini; 2019; Meng & Jin, 2017) or no reference was made to this situation (e.g, Silva et al., 2018). However, a study conducted in Spanish adolescents (Serrano, Andreu, Murgui, & Martínez, 2019) interprets high correlations as an overlap among dimensions and views the construct as one-dimensional.
Second, and related to the foregoing, empirical independence of factors was not evaluated through the application of direct or bifactor hierarchical models (Reise, 2012; Rodriguez, Reise, & Haviland, 2016), observing only the implementation of an indirect hierarchical model (Meng & Jin, 2017), which is not usually the best option to assess the predominance of a general factor over specific factors (Canivez, 2016).This is relevant because the original proposal suggests the interpretation of three dimensions, but the apparent factor overlap is contrary to this assumption. On this point, although the authors of the UWES indicate that the specific factors cannot be reduced to a general underlying engagement factor (Schaufeli, Salanova et al., 2002), if high inter-factor correlations are observed, it should be assessed whether or not there is a general academic engagement factor.
Third, in some studies with the UWES-9S, the correlation among residuals was shaped, either to explain sources of variability outside the construct as the perception of a redundant meaning as between item three (I'm excited about my university studies) and seven (I am proud of doing this career) (Sánchez-Cardona et al., 2016), between item one (My student homework makes me feelfull of energy) and five (When I wake up in the morning I feel like going to class to study) (Loscalzo & Giannini, 2019), or between items one (My student homework makes me feel full of energy) and two (I feel strong and vigorous when I am studying or I go to classes) (Serrano et al., 2019 ); and in addition to redundancy, because of its proximity, such as items eight (I am immersed in my studies) and nine ( I "let myself go" when I do my student homework) (Carmona-Halty et al., 2019; Loscalzo & Giannini, 2019; Sánchez-Cardona et al., 2016; Serrano et al, 2019), or even said correlation was only specified to increase the adjustment without further analysis (Meng & Jin, 2017; Römer, 2016); but in none of the cases the reliability of the construct was corrected in the presence of these parameters (Raykov, 2004), with the risk that the reliability would be overestimated (Merino-Soto, 2015).
It should be noted that in addition to the UWES, there are other instruments for measuring academic engagement. For instance, one of them is the Student Engagement Instrument (SEI; Appletin, Christenson, Kim, & Reschly, 2006) that measures two subtypes of engagement: cognitive and psychological; the Student-Faculty Engagement (SFE, Carle, Jaffee, Vaughan, & Eder, 2009) was designed to measure engagement taking into account student interaction with teachers; the Student Engagement Scale (SES; Mazer, 2012), which refers to classroom behavior; the Math and Science Engagement Scale (MSES; Wang, Fredricks, Ye, Hofkens, & Linn, 2016) that measures engagement in two specific areas, math and science; and finally, the Rochester Assessment Package for Schools (RAPS; Wellborn & Connell, 1987) that evaluates academic engagement in two areas (behavioral and emotional) and has a version for students, teachers and parents.
For this reason, the UWES was preferred since its theoretical basis is articulated with a large part of the current literature and receives greater support from researchers. In turn, the nine-item version was chosen, instead of the seventeen-item version, because it is the one that has studies in the Spanish-speaking population (Carmona-Halty et al., 2019; Sánchez-Cardona et al., 2016; Serrano et al., 2019), and also shows high inter-factor correlations as the long version (Cadime et al., 2016; Meng & Jin, 2017).
Academic engagement and academic procrastination
Engagement has been associated with a successful academic career (Reschl & Christenson, 2012), both in terms of learning and academic performance (e.g., Salanova, Schaufeli, Martinez, & Bresó, 2010; Stefansson, Gestsdottir, Geldhof, Skulason, & Lerner, 2016), so it is related to behavioral and cognitive aspects of the student's academic activity, one of them being procrastination.
Academic procrastination (AP) is understood as the action to voluntarily and unnecessarily delay task performance due to different causes resulting in subjective discomfort (Dominguez-Lara, 2016a) as well as academic problems (Patrzek Sattler, van Veen, Grunschel, & Fries, 2015). AP is composed of two dimensions: postponement of activities, which reflects the actions taken to delay the performance of certain tasks, and academic self-regulation that refers to goal-oriented behaviors and action planning (Dominguez-Lara, Prada -Chapoñan, & Moreta-Herrera, 2019). The second dimension is more relevant because procrastination is predominantly seen as a product of failures in self-regulation processes (Steel, 2007; Steel & Klingsieck, 2016).
It has been established that procrastination is the product of several factors: the results expected to be obtained, the value given to the importance of the task, the time needed to obtain the reinforcing consequences and the person's impulsiveness (Steel, 2011). For this reason, people who exhibit greater procrastination behavior are those characterized by low expectations about the results, low task assessment, greater impulsivity, and greater perceived delay for rewards for completing the task (Steel, 2011). Therefore, it is foreseeable that a low level of engagement in the student would be associated with the appearance of AP given that the first is characterized by a state of pleasure and activation (Schaufeli, Shimazu, Hakanen, Salanova., & De Witte, 2017), which would be incompatible with those negative emotions that normally go with AP.
In that sense, due to the distinctive characteristics of the construct, the available evidence indicates that engagement reduces the chances of displaying procrastinating behaviors in the academic field (Çapri et al., 2017; Closson & Boutilier, 2017; González-Brignardello & Sánchez -Elvira-Paniagua, 2013; Strunk, Cho, Steele, & Bridges, 2013). Consequently, engaged and less procrastinating students tend to perceive more clearly the tasks to be performed (Hoppe, Prokop, & Rau, 2018), which would result in a successful academic performance.
However, and in line with the previous questions raised to the internal structure of the UWES (unidimensional or multidimensional?), the question arises as to whether the AP is really connected with the general engagement factor or the specific dimensions. In situations like this, the incorporation of bifactor models (Reise, 2012) can be methodologically useful.
Bifactor models in structural regression analysis: assessing the strength of the general factor
Bifactor modeling has been considered as the most appropriate to simultaneously assess the influence of the general factor and specific factors on the variability of each item, in contrast to indirect or second-order hierarchical models (Canivez, 2016). However, while this analysis provides evidence on the strength of a general factor, it is necessary to have more information regarding the predictive ability of that factor; or in other words, if its influence on a theoretically relevant construct remains significant even in the presence of specific factors in the same structural model.
For example, Stefansson et al. (2016) analyzed the influence of the general and specific dimensions (behavioral, emotional and cognitive) of engagement on academic performance, first analyzing the influence of individual factors, and then including the presence of a general engagement factor through a bifactor model. Although in the first model (influence of three oblique factors over performance) only the behavioral dimension of engagement showed high and significant influence on performance (β = .73, p <.001), after installing the bifactor model, the influence of the general factor was significant (β = .51, p <.001) drastically reducing the influence of the behavioral dimension (β = .25, p <.001).
Therefore, as previously argued, despite the widespread use of UWES-S in different contexts, no psychometric research has been found with Peruvian university students validating its application. For this reason, the objective was to provide a first approach to the UWES-S' dimensionality analysis in Peruvian university students through structural equations, both with respect to its internal structure (confirmatory factor analysis) and its association with AP (structural regression analysis) following international standards (American Educational Research Association, American Psychological Association, & National Council on Measurement in Education, 2014).
In this way, having an instrument that evaluates engagement in a valid way could help assess intervention programs (Reschly & Chistenson, 2012), considering the high risk of student dropout, by developing strategies for students to acquire skills to face the demands and expectations of the academic environment, given that engagement is a state that is highly influenced by teaching, family and classmates' context. This is relevant since figures indicate that in OECD member countries 30% of university students drop out school, exhibiting Latin American countries the highest 57% dropout rate (Garzón & Gil, 2017). There are even reports in Argentina indicating that 72% of students drop out of their university studies and only 17% of them manage to obtain a degree (Medrano, Galleano, Galera & del Valle-Fernández, 2010), and Peru is not exception to the rule since it is estimated that between 40 and 50 thousand students leave the university every year, which also represents economic losses in their respective families (Rocha, Zelaya, Sánchez & Pérez, 2017).
In view of the revised information, both theoretical and empirical, the following hypotheses were formulated: As for the structural aspect, the dimensions of engagement (vigor, dedication, and absorption) are expected to show a high inter-factor correlation and a low empirical differentiation (hypothesis 1 ); in addition, that the bifactor model has better adjustment rates and that the general factor (engagement) explains a greater proportion of the variance of the items compared to the specific factors (vigor, dedication, and absorption) (hypothesis 2). Regarding its association with AP, it is expected that the influence of the engagement dimensions on academic procrastination will not be significant in presence of the general factor (engagement) (hypothesis 3), and that the general factor (engagement) will significantly influence the dimensions of academic procrastination. In other words, that there is a positive influence on academic self-regulation and a negative influence on postponement of activities (hypothesis 4); finally, regarding reliability, the presence of correlated residuals is expected to significantly reduce the reliability of the construct and scores (hypothesis 5).
Method
Study type
This is a psychometric study (Ato, López & Benavente, 2013) focused on analyzing the psychometric properties of a psychological assessment instrument.
Participants
Using a purposive sampling, 321 psychology students at a private university located at central Cajamarca (Peru) participated in the study; 79% of them were women, and the average age was 22.5 years-old (SD = 4.24; 84% between 17 and 25 years old). Most participants indicated to be single (73.8%) and 83.6% indicated to be unemployed. Students in their 2nd year of study, or more, were included in the study, whereas those who did not completed both questionnaires were excluded.
Instruments
Utrech Work Engagement Scale - Student (UWES-9S). It was elaborated by Schaufeli et al. (2006) with nine items and a Likert seven-point scale (from Never to Always), and assesses the three dimensions of academic engagement: vigor, absorption and dedication (three items each). All nine items were used based on the full version in Spanish (Schaufeli & Bakker, 2003). Previous psychometric studies report high reliability indicators (> .90; Carmona-Halty et al., 2019; Loscalzo & Giannini, 2019; Serrano et al., 2019), although for some authors the internal structure is multidimensional in nature (e.g., Carmona-Halty et al., 2019) or unidimensional (Serrano et al., 2019).
Academic Procrastination Scale (EPA, in Spanish). This scale was built by Busko (1998), and the validated 12-item version was used in Peruvian university students using a Likert five-point scale (from Never to Always) (Dominguez-Lara, 2016a). It evaluates two AP's dimensions: postponement of activities (three items) and academic self-regulation (nine items). Acceptable adjustment indexes were found (CFI = .948; RMSEA = .095, IC90% .082 - .109) and an adequate construct reliability was evidenced both in academic self-regulation (ω = .854) and postponement of activities (ω = .854), replicating the bi-dimensional structure also found in other studies of some Latin American countries (Barraza, & Barraza, 2018; Moreta-Herrera, & Durán-Rodríguez, 2018).
Procedure
This study was developed as a project granted to the second author addressed to students in their 2nd year, or more, at the university and considering the fulfillment of ethical requirements in research. Permission to apply the questionnaires was requested to the authorities of the university institution where the study was conducted. First, a group of university students (n = 8) with similar characteristics to the study sample (50% men between 18 and 25 years old) was contacted to complete the scale in order to evaluate the clarity of the items and improve the understanding of UWES-9S in Peruvian students. No changes were needed as the students indicated that they understood all of the items. Preliminary to the administration of instruments, students were informed about the research objectives and those who accepted to participate signed an informed consent, also guaranteeing anonymity and confidentiality of the results. The research study was developed following the Declaration of Helsinki (World Medical Association, 1964), as well as the ethics code of the Peruvian Association of Psychologists (2017).
Data Analysis
To start with, data quality was verified and those participants who do not complete both scales (n = 3) were eliminated; and since the percentage of lost cases was low (< 0.3 %), missing data were completed with fashion (Shrive, Stuart, Quan, & Ghali, 2006). Then, a preliminary descriptive analysis was conducted in which descriptive statistics (average and standard deviation) as well as the asymmetry (g1 < 3; Kline, 2016) and kurtosis (g2 < 10; Kline, 2016) of each item were reported. Likewise, the univariate normality was assessed with the standardized asymmetry index (IEA; Malgady, 2007), expecting magnitudes between .25 and .50, and the multivariate normality with Mardia coefficient (1970), which is considered acceptable below 70 (Rodríguez & Ruiz, 2008).
As for the validity evidence based on internal structure, the original model (three oblique factors) and one alternative (two oblique factors: vigor and dedication) were analyzed under a confirmatory factor approach. The extraction method weighted least squares means and variance adjusted (WLSMV) estimation was implemented with polychoric correlation matrix with Mplus version 7 software (Muthén & Muthén, 1998-2015). The adjustment was analyzed considering the magnitudes of CFI (> .90; McDonald & Ho, 2002), the upper limit of the confidence interval (CI) of RMSEA (< .10; West, Taylor, & Wu, 2012), and the WRMR (< 1.00; DiStefano, Liu, Jiang, & Shi, 2018). The factor loadings were assessed expecting magnitudes higher than .60 in view of the number of items by dimensions (Dominguez-Lara, 2018), and regarding the average variance extracted by factor (AVE, or the arithmetic average of the commonalities of a factor's items) values greater than .50 were expected (Hair, Black, Babin, Anderson, & Tatham, 2010).
In a complementary way, the empirical differentiation (or discriminant validity) was analyzed among factors by comparing AVE and the shared variance among factors (or the square of the inter-factor correlation) (Fornell & Larcker, 1981), considering that inter-factor correlations greater than .80 may indicate potential factorial redundancy (Kline, 2016). Additionally, presence of unclear specifications (Saris, Satorra, & Van der Veld, 2009) associated to potential cross loadings with significant change rates (IM, in Spanish) were analyzed, i.e., those cross loadings that need to be specified to improve the model adjustment. The calculation was made with a specific module (Dominguez-Lara & Merino-Soto, 2018).
Subsequently, a bifactor model proposing the presence of a general factor (GF) was tested, in this case the academic engagement explains greater variance of the items compared to the specific factors (engagement dimensions). In this sense, in addition to the adjustment indexes, the total variance proportion attributed to the general factor was quantified by means of the general hierarchical omega coefficient (ω h), as well as the hierarchical omega by dimension (ωhs) associated to the real variance proportion that explain the specific factors controlling the presence of the general factor (Zinbarg et al., 2006), where values greater than .30 can be considered relevant (Smits, Timmerman, Barelds, & Meijer, 2015). In the same way, the proportion of the explained common variance (ECV; Sijtsma, 2009) attributed to the general factor, and the percentage ofuncontaminated correlations by multidimensionality (PUC; Reise, Scheines, Widaman, & Haviland, 2013) were calculated. Then, there is evidence on the explanatory superiority of the general factor if ECV and PUC are greater than .70 (Rodríguez et al., 2016). In addition to the aforementioned indicators, the difference was assessed by comparing χ2 of both models using the DIFFTEST option of Mplus (Asparouhov & Muthén, 2006).
As for the validity evidence based on relationships with other variables, and in view of the association of engagement with academic procrastination, a structural regression model was assessed (Kline, 2016) specifying the combined influence of the general and specific factors of engagement on the academic procrastination's dimensions (see Figure 1), in contrast to the one that only shows the influence of the dimensions of academic engagement on academic procrastination (see Figure 1 without general engagement factor). Similarly, difference among models comparing their χ2 with DIFFTEST option of Mplus was assessed. Furthermore, the proportion of explained variance (R2) attributed to specific and general factors were assessed on the academic procrastination's dimensions (academic self-regulation and postponement of activities): R2 of .02, .13 and .26 was rated as small, medium and large, respectively (Ellis, 2010).
To finish, reliability was estimated. After assessing the model adjustment with a single factor (congeneric model), the items' factor loadings' statistical equivalence (tau-equivalent model) was assessed to justify the use of the α coefficient (Dominguez-Lara, 2016b). In this way, both the congeneric and tau-equivalent models were compared, based on their adjustment indexes expecting differences of .01 as for CFI and of 015 in RMSEA (Chen, 2007). With respect to a coefficient, given the number of items (9) and the sample size (> 300), it is expected a .75 minimum magnitude (Ponterotto & Charter, 2009). Subsequently, the construct reliability was assessed with ω coefficient (> .70). Both coefficients, ω y α, were corrected in presence of correlated residuals (Dominguez-Lara, 2016c; Dominguez-Lara & Merino-Soto, 2017).
Results
This information corresponds to the descriptive results associated with the items such as the structural and relationship analysis with other variables under structural equation modeling.
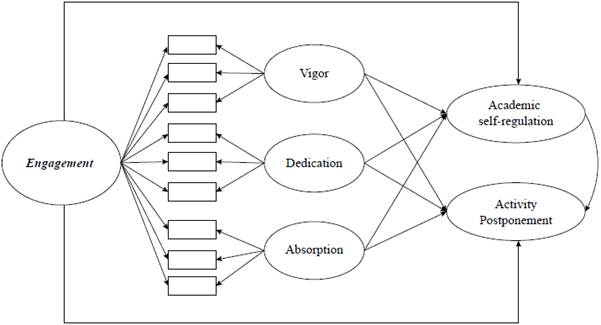
Figure 1 Measurement model of the influence of engagement on academic procrastination. Note. For the sake of simplicity, items of the procrastination scale were not included.
Descriptive analysis
The magnitude of asymmetry, kurtosis and IEA coefficients is acceptable, but the items reflect that the more frequent answers are the highest options, especially item 7 (I am proud of doing this career) although some of them (e.g. item 2: I feel strong and vigorous when I am studying or I go to classes) show a more uniform distribution (see Table 1). Additionally, multivariate normality of data could be confirmed (G2 = 56.74).
Validity evidence based on internal structure
The three-factor oblique model exhibited adequate adjustment indexes (CFI = .981; RMSEA = .112, IC90% .093 - .133; WRMR = .800) as well as high factor loadings (> .70) in all dimensions, what results in AVE by important magnitude factor (> .50).
However, high inter-factor correlations are displayed. (> .80; see Table 2), and AVE of vigor and absorption is greater than the shared variance (inter-factor correlation square), but in the other correlations (vigor and dedication; dedication and absorption) the shared variance is greater than AVE by factor (Table 2). Similarly, regarding the two-factor model (vigor and dedication), although CFI and WRMR were adequate (.983 y .737, respectively), RMSEA reached unacceptable magnitudes (.148; IC90% .115 - .182), even for the models with few degrees of freedom, and the differentiation among factors was not clear considering the AVE and inter-factor correlation (Table 2). Therefore, these findings provide favorable evidence for hypothesis 1.
Lastly, in the three-factor model four possible unclear specifications associated with cross loadings were detected: item 1 (original vigor) in dedication (IM = 24.444; estimated parameter change [EPC] = -.475), item 5 (original vigor) in dedication (IM = 42.798; EPC = .635), item 1 (original vigor) in absorption (IM = 22.267; EPC = -.625); and item 5 (original vigor) in absorption (IM = 51.307; EPC = .975); and in the two-factor model potential cross loadings were found: items 1 and 5 (original vigor) in dedication.
On the other hand, the bifactor model with three specific factors showed adjustment indexes with acceptable magnitudes (CFI = .992; RMSEA = .085, IC90% .062 - .109; WRMR = .531), but those of AVE and of ωh (> .80) y ωhs (< .30) (see Table 3) indicate that the GF explains greater variance amount of the items than the specific factors, besides that the DIFFTEST results indicate statistically significant differences between two models
(Δχ2 [6] = 69.185, p < .001), which provides favorable evidence for hypothesis 2.
Table 1 Item descriptive analysis of the UWES-S

Note. M = Mean; SD = Standard deviation; g1 = Skewness; SSI = Skewness standardized index; g2 = Kurtosis Distribution
Table 2 Confirmatory factor analysis of the UWES-S in college students: original and alternative models

Note. F1 = Vigor; F2 = Dedication; F3 = Absorption; AVE = Average Variance Extracted. Below the diagonal: inter- factor correlations; over the diagonal: Shared variance between factors
Table 3 Confirmatory factor analysis of the UWES-S in college students: bifactor model

Note. FG = General Factor; F1 = Vigor; F2 = Dedication; F3 = Absorption; AVE= Average Variance Extracted; ωh = hierarchical omega; ωhs = hierarchical omega for each dimension; ECV = Explained common variance; PUC = Percentage of uncontaminated correlations by multidimensionality
Validity evidence based on relationships with other variables
Acceptable adjustment indexes were found in the model that considers the influence of the engagement's three dimensions over AP (see Figure 2; CFI = .971; RMSEA = .063, IC90% .055 - .072; WRMR = .962) as well as in the bifactor that includes the general factor (see Figure 3; CFI = .976; RMSEA = .059, IC90% .050 - .068; WRMR = .887). Nevertheless, DIFFTEST shows that both models have statistically significant differences (Δχ2 [7] = 50.325, p < .001).
It is worth mentioning that in this analysis stage, item 9 was removed due to convergence failures in the bifactor model, so in the structural analysis that includes the oblique factors model ofthe UWES-9S, that reagent was also removed.
Regarding the explanatory capacity of the model, the explained variance proportion was significant both in academic self-regulation (> .40) and postponement of activities (≈ .20), although in the oblique model only vigor statistically significant influence stands out (see Figure 2) over academic self-regulation (β = .326; IC95% .048 - .604) and postponement of activities (β = -.564; IC95% -.221 - .907) in contrast to β was not significant in dedication (Self-regulation: IC95% -.530 - .392;postponement: IC95% -.796 - .184) and absorption (Self-regulation: IC95% -.118 - 1.042; postponement: IC95% -.206 - 1.138), despite its moderate magnitude.
On the other hand, the model that considers the presence of the general engagement factor indicates that of the total of the variance of academic self-regulation and postponement of activities explained by the general and specific factors of engagement (R2 = .564; R2 = .189, respectively), the general factor explains 73.404% (.414) and 60.318% (.114), respectively (see Figure 3), substantially reducing the proportion of variance explained by specific factors after including a general factor, so that hypothesis 3 is supported. Finally, the general factor of academic engagement directly and inversely influences academic self-regulation and postponement of activities, in that order, which supports hypothesis 4.

Figure 2 Influence of the engagement dimensions on academic procrastination. Note. ns:non-statistically significant; *p < .05; **p < .01. For the sake of simplicity, the items of the scales were not included.

Reliability
With respect to the preconditions analysis, the congeneric model did not obtain an acceptable adjustment (CFI = .957; RMSEA = .161, IC90% .143- .179; WRMR = 1,214), noting also the presence of potential unclear specifications associated with correlated residuals, being modeled only those pairs that built dimensions in the original model. In this way, the correlation between the residuals of items 3 (I am excited about my career) and 4 (My studies inspire new things), 4 and 7 (I am proud of doing this career), 3 and 7, all were original of the dedication dimension; and of items 1 (My student homework make me feel full of energy) and 2 (I feel strong and vigorous when I am studying or I go to classes), of the original vigor dimension. The adjustment markedly improved (CFI = .989; RMSEA = .087, IC90% .066 - .108; WRMR = .635), being also these correlations of mild and moderate magnitudes: ϕ3.4 = .354, ϕ4.7 = .258, ϕ3.7 = .503, and ϕ1.2 = .446.
In a complementary way, taking into account that the three dedication items have their correlated residuals, a bifactor structure was modeled taking dedication as a residual factor. The adjustment indexes are similar to those of the one-dimensional model (CFI = .971; RMSEA = .140, IC90% .121 - .160; WRMR = 1.004), but the AVE of the three items does not differ before (AVE = .733) and after (VME = .624), being also the AVE of the dedication residual factor quite low (AVE = .164) (Table 4).
Subsequently, the tau-equivalent model was assessed based on the congeneric model without the correlated residuals obtaining similar adjustment indexes (CFI = .950; RMSEA = .152, IC90% .136- .168; WRMR = 1,790), and without marked differences with respect to the congeneric model, thus, the use of α coefficient is justified.
Finally, in terms of estimates, the estimated construct reliability with the coefficient ω, remains stable and in good magnitude (> .90) even in the presence of correlated residuals (> .85); however, the a coefficient experiences a drastic decrease, which of an excellent magnitude (> .90) goes to one below expectations (<.70), and even more if we can see the lower limit of its IC (≈60; see Table 4). In this way, hypothesis 5 is partially supported since the reliability of the construct did not undergo significant changes.
Discussion
The objective of this study was to analyze the UWES-9S' internal structure, as well as its influence on the AP dimensions, because it is considered a viable alternative to measure academic engagement in university students.
With respect to the validity evidence based on internal structure, due to the degree of inter-factor overlap, the presence of unclear specifications associated with cross loadings in the oblique model, and the general factor strength in the bifactor model, the one-dimensional model is considered to be the one that best represents the construct (hypothesis 1 and 2). These results differ from most of the existing literature in this regard (Carmona-Halty et al., 2019; Loscalzo & Giannini, 2019; Römer, 2016; Sánchez-Cardona et al., 2016; Silva et al., 2018), although the introductory section refers to those methodological aspects that were not mentioned before, they can be summarized as the lack of assessment in the presence of a potential general factor.
Table 4 Confirmatory factor analysis and reliability of UWES-S in college students: unidimensional model

As for the validity evidence in relation to other variables, in the structural model (Figure 3) there was a direct influence of the academic engagement general factor on AP dimensions (hypothesis 4): academic self-regulation (positive influence) and postponement of activities (negative influence); but not of the specific dimensions of engagement (hypothesis 3). This result, in addition to supporting the construct unidimensionality (Stefansson et al., 2016), gives an account of the engagement's potential relevance to reduce AP, as reported by previous literature (Çapri et al., 2017; Closson & Boutilier, 2017; González-Brignardello & Sánchez-Elvira-Paniagua, 2013; Strunk et al., 2013). It should be noted that as for the influence of engagement's dimensions on AP (Figure 2) it is unusual that β coefficients of such magnitude (e.g., > .30) are not statistically significant. Therefore, such behavior could be attributed to unclear specifications inherent in the consideration of three independent factors with high inter-factor correlations, i.e., an over- parameterization or specification of parameters that should not be included (Saris et al., 2009) as they would configure a general dimension.
Nevertheless, even the nine-item dimensional model would present additional considerations. For instance, in several studies there are correlated residuals that although they improve the model adjustment, they can be considered as a perception product that the evaluated ones have on the redundancy in the item content (Byrne, 2009), like between the items three (I am excited about my career) and seven (I'm proud of doing this career) (Sánchez-Cardona et al., 2016), one (My student homework makes me feel full of energy) and five (When I wake up in the morning I feel like going to classes to study) (Loscalzo & Giannini, 2019), one (My student homework makes me feel full of energy) and two (I feel strong and vigorous when I am studying or I go to classes) (Serrano et al., 2019), and the most recurring pair, eight (I am immersed in my studies) and nine (I "let myself go" when I do my student homework) (Carmona-Halty et al., 2019; Loscalzo & Giannini, 2019; Sánchez- Cardona et al., 2016; Serrano et al, 2019).
The results of this study were in line with those mentioned in the previous paragraph in terms of the association between residuals of items three and seven, and one and two. However, the association between the residuals of items three (I am excited about my career) and four (My studies inspire new things), and four and seven (I am proud of doing this career) is unprecedented, although with the same explanatory basis than the previous ones. Of the four correlations between residuals, three include items of dedication (3, 4 and 7), but a residual factor could be considered since their modeling does not impact the UWES-S' unidimensional structure. Finally, the construct reliability seems solid even in the presence of correlated residuals, but the latter substantially impact on the reliability of the scores (hypothesis 5).
Regarding the methodological contributions to the study of the UWES-S' internal structure, it is worth mentioning the exploration of unclear specifications associated with cross loadings, whose exploration is necessary in complex constructs, as well as the modeling of the general and specific factors to the construct and its influence on another variable, as it is used in other contexts to assess the dimensionality of the scales (Chen, Jing, Hayes, & Lee, 2012; Lac & Donaldson, 2017; Lauriola & Iani, 2017; Luciano , Barrada, Aguado, Osma, & García-Campayo, 2014), so it could be replicated in the study of other instruments associated with constructs of similar complexity (e.g., psychological well-being). On the other hand, the detailed study of the correlations impact between residuals on reliability helped to make visible that this practice, although it brings benefits at adjustment indexes level, it affects one of the most important psychometric properties (reliability), which would give a different reading to the results already obtained by other authors.
Practical implications of the results lie in their potential use of UWES-9S in explanatory models in the academic field linked to performance (e.g., Salanova et al., 2010; Stefansson et al., 2016) given their strength at the level of latent variables, although its use in applied contexts (e.g., epidemiological studies) would not yet be recommended due to the measurement error of the scores. Additionally, the influence it has over AP could be an indication to continue studies that link both variables, but considering some important mediators, such as resilience (Fernández-Martínez et al., 2017) or self-efficacy (Zhen et al., 2017) since to engage and continue the studies, it is necessary for the person to have the ability to resist academic adversities and motivate himself/herself, but will do so to the extent that it is perceived sufficiently capable of completing these objectives (Dogan, 2015).
On the other hand, although academic engagement has an important effect on academic performance (Salanova et al., 2010), student grades are predictors of high future student academic engagement (Palos, Maricutoiu, & Coster, 2019). For this reason, teachers who pay attention to the factors that influence students' academic engagement would be able to design an optimal learning environment to support their needs.
Among the limitations there is the sample size, the majority presence of women, and the student evaluation of a professional career. Regarding the first point, the sample size can be considered adequate taking into account the number of items (3), dimensions (3) and magnitude of the expected factor loadings (.80) of the UWES-S (Wolf, Harrington, Clark, & Miller, 2013), in addition to the fact that in other studies the sample range was broad, of more than 1000 (e.g., Carmona-Halty et al., 2019) less than 250 (Cadime et al., 2016), obtaining similar results (e.g., high inter-factor correlations), which reinforces the current argument that large sample sizes seem not to be indispensable (Kyriazos, 2018) . Regarding the second point, in the psychology career it is expected that most students are women, which resembles other presented studies (Loscalzo & Giannini, 2019; Meng & Jin, 2017; Sánchez-Cardona et al., 2016) whose conclusions do not differ from others where the presence of men and women was equitable (Carmona-Halty et al., 2019) . However, the sample size of this work was not enough to perform invariance analysis according to sex like other researches. Third, on the professional career, although in some works there was variability regarding this point (Loscalzo & Giannini, 2019), others were based on homogeneous samples of students, being either nursing (Meng & Jin, 2017), education (Römer, 2016), or psychology (Cadime et al., 2016).
It is then concluded from the information found in relation to its internal structure that the UWES-9S is an essentially one-dimensional measure since a general factor explains more variance than the specific factors and, in turn, this significantly influences the AP.
As for the recommendations, it would be convenient to expand and diversify the sample and thereby, to conduct measurement invariance studies associated with sex and professional career, as well as to replicate the results found. Likewise, given that the objective is to use the UWES-9S to assess interventions, it is convenient to provide evidence of longitudinal invariance for these purposes. Finally, given the UWES-9S' unidimensionality and the perceived redundancy among some of its items, the psychometric benefits of the ultra-short measurement of three elements (UWES-3; Schaufeli et al., 2017) could be assessed in next studies at the academic context, through procedures seeking to assess the metric equivalence between both versions (UWES-3 and UWES-9) beyond a correlation coefficient.

