1. Introduction
Coffee crop agribusiness is modernizing its productivity process in order to increase, or maintain, the crop’s yield and gains. In recent years Brazilian coffee agribusiness internalized new production techniques that promoted positive impacts on productivity, competitiveness and final product quality [4].
One technique that corroborates to this modernization process is the implementation of precision agriculture in coffee plantations. The use of precision agriculture in coffee crops was defined as a set of techniques and technologies that can aid the producer in managing his/her crop, based on the spatial variability of soil and plant properties, in order to maximize profitability, increase fertilization, spraying and harvesting efficiency, which increases productivity and the quality of the final product [11]. We may also include in this definition the concern with environmental and social issues. Furthermore, the precision agriculture technique applied on the coffee crop may be economically feasible for producers [10].
The knowledge of soil and crop property variability, in space and time, is considered a basic principle for the precise management of agricultural areas, independent of their scale [6,14]. The study of soil property spatial variability is important when selecting an experimental area, in locating experimental units, in determining the sampling operation, in the interpretation of the results, soil survey and classification schemes, and in the conscious use of fertilizers [29].
Understanding the soil spatial variability for any agricultural field requires a large amount of information, which may be obtained from different soil sampling strategies [30]. Such sampling, especially those related to grid patterns, generate discussions among scientists, technicians, traders and producers, who do not have well-established standards for coffee crops. For example, [20] reported that spatial sampling should always be performed using regular grids and that the random distribution of sampling points on the field will avoid the optimum use of all the spatial information obtained by sampling.
The use of soil sampling grids of unsatisfactory size may generate maps that do not reflect what is in the field, generating erroneous technical recommendations of the sampled soil property. The soil sampling grids commonly used in several Brazilian crops, without any justification, range from 0.2 to 1 sample/ha [19]. Specifically, for coffee crops, the soil-sampling grid is 1 sample/ha [12]. Thus, information on selecting the appropriate soil sampling grid size is critical for the precise management of the spatial variability of soil and plant properties on coffee plantations, primarily for the application of variable rates and the management of the fruit’s harvest operation.
Thus, the objective of this study was to develop and propose a methodology that would enable the assessment and comparison of different sampling grid quality, and leads us into choosing a grid that better characterizes the spatial variability of soil properties.
2. Material and methods
2.1. Experimental area
The experiment was conducted at the Brejão Farm, Três Pontas, south of Minas Gerais State, Brazil, in a commercial field cultivated with 22 ha of coffee (Coffea arabica L., Topazio cultivar) (Fig. 1). The crop was planted in December 2005 with a spacing of 3.8m between rows and 0.8 m between plants, totaling 3289 plants ha-1. The geographic coordinates of the center of the area are 21°25'58" S and 45°24'51" W and the altitude is 915m above sea level (Fig. 2). The limits of the field were obtained by differential GPS FC-100 (Topcon Positioning Systems Inc. / Livermore, California, EUA).
The local climate is characterized as mild, tropical of altitude, with moderate ambient temperatures and hot and rainy summer, classified by Köppen as Cwa [23]. The soil was classified as Haplustox [8]. Fertilizers in the 2007/2008 and 2008/2009 growing seasons were applied via variable rate as described by [10] and in other seasons fertilizers were conventionally applied.
2.2. Initial sampling grid
A regular sampling grid of 57 x 57m with a total of 64 georeferenced sampling points (averaging 2.9 points per hectare) was established in the study area. We created four more regular sampling grids inside this larger grid, with points spaced at 3.8 x 3.8 m, hereafter this pattern is referred to as a nested grid. These grids were placed in four points of the main grid, each nested grid corresponding to 10 georeferenced sampling points, with one point of the main grid and nine points of the new grid. Thus, the initial sampling grid, called grid one, had 100 georeferenced sampling points (Fig. 3) and other grids were developed from grid one.
Each sampling point corresponded to 4 coffee plants, in which 2 plants were in a row with 2 others in each lateral row (Fig. 3). The GPS receiver recorded the positions of each sampling point.
The use of nested grid in the sampling scheme is to detect variations over short distances, reducing the nugget effect, and thus, contributing to improve the results of the grid used. This kind of sampling, which uses nested grid into a grid with larger spacing of points, was also used by [2, 3, 13, 16, 24].
2.3. Development of a sampling grid study methodology
In order to develop a method that enables choosing the soil sampling grid, we must consider the existence of spatial dependency of the studied properties for each testing grid. If this dependency occurs, it must be modeled, evaluating whether it was well performed or not.
The spatial dependence of the studied variables and evaluated sampling grids was determined by computing and modeling the semivariogram. The classical semivariogram estimator [17] is demonstrated in the following eq. (1):
in which is the semivariance, N(h) is the number of experimental pairs of observations z(s
i
) and z(s
i
+h), at locations s
i
and s
i
+h, separated by the lag distance h [7]. The semivariogram is represented by graphic
  versus h. From the mathematical model fitted to the calculated values of
  we estimated the coefficients of the theoretical model for the semivariogram called nugget effect (C0), sill (C0 + C1) and range (a), as described by [7]. The mathematical model adjustment method used was the ordinary least squares (OLS).
The spherical model was chosen for all attributes studied. This model is widely used in spatial variability studies of coffee plantations such as: soil properties, coffee yield, plant defoliation due to manual harvest, fruit detachment force and pest infestation [1,9,18,25-28]. Furthermore, the spherical model adjusted to most of the studied soil properties and coffee yield [11].
In order to distinguish the adjustment quality, we used the spatial dependence index (SDI) [5]. This index indicates strong spatial dependence when the nugget effect is (25% of the sill, moderate when it is between 25 and 75% of the sill, and weak when the nugget effect is (75% of the sill.
Validation is one of the ways to evaluate the quality of the estimation and adjustment of a semivariagram and other studied features, such as sampling grid. The validation evaluates estimation errors in order to compare the predicted values with the sampled one [15]. The sample value at z(si), is discarded temporarily from the data, being predicted by ordinary kriging along with the remaining sample values in its proximity. Thus, it is possible to obtain values which may be useful in observing the errors presented by each grid, such as Absolute Error (AE) eq. (2), which values should be closest to zero, and the Standard Deviation of Absolute Error (SDAE) eq. (3), which must be as little as possible.
were N is the number of data points, z(si) is the measured value at point si, and  is the value calculated by ordinary kriging at s
i
when z(s
i
) removed.
Methods that quantify the comparison of different sampling grids to study their spatial dependence are not available. Thus, this work proposed, developed, and tested two indexes which represent the quality of the sampling grid. These indexes are based on values of Absolute Error (AE) and Standard Deviation of Absolute Error (SDEA). By obtaining these indexes, it was possible to develop, propose and test an indicator that points to the sampling grid that best represents the data set.
The geostatistical analyses were done with the [21] statistical software and the geoR [22] library.
2.4. Test of the developed methodology
The data source used to test the proposed indexes and indicator were the soil properties. The soil was sampled on June 2011, obtaining subsamples under the coffee canopy in 0-20 cm of depth, using a soil sampler (Fig. 4a) in each plant inside the sample point. These subsamples were mixed in order to form a composite sample that represented the studied sample point (Fig. 4b and 4c). These samples were sent to the Soil Analysis laboratory of the Soil Science Department of the Universidade Federal de Lavras. The soil chemical properties measured were Phosphorus (P), remaining phosphorus (Prem), Potassium (K) and Cationic Exchange Capacity at pH 7.0 (T).
3. Results and discussion
3.1. Quality indexes and grid indicator
In order to evaluate the quality of the sampling grids, we proposed and developed two indexes: the accuracy index (AI) and the precision index (PI).
The Absolute Error (AE) value obtained by validation reflects the accuracy presented by the sampling grid. Conceptually, accuracy gives an idea of the conformity degree of a measured or calculated value in relation to a reference standard. The result of AE compares the values obtained for validation to the real values obtained by field sampling. To determine a component of accuracy which allows a comparison between the studied grids, we proposed and developed an Accuracy Index (AI) eq. (4)
in which AE is the Absolute Error (Eq. 2) value, in module, of the grid that will be compared. mAE is the largest value of Absolute Error, in module, among all of the analyzed grids. Values of the index AI range from 0 to 1 and the closer to 1, the more exact the sampling grid will be, and vice-versa.
The standard deviation value of the absolute error (SDAE), as defined in Eq. 3, reflects in the precision of the grid. By definition, precision is used to express the dispersion results. To compare the precision component of the grid among the different sampled grids, we propose and developed a precision index (PI) eq. (5).
in which SDAE is the standard deviation’s absolute error value of the grid that will be compared. mSDAE is the largest value of Absolute Error Standard Deviation presented by the group of analyzed grid. The value of PI ranges from 0 to 1 and the closer to 1, the more precise the sample grid will be, and vise-versa.
To choose the best sampling grid, i.e., optimum, among the studied grid patterns, we proposed and developed the Optimum Grid Indicator (OGI), which takes into account the balance between the rate of accuracy and precision eq. (6).
The Optimum Grid Indicator (OGI) ranges from zero to one and the closer to one (or 100%) the better the grid will be, that is, more exact and more precise.
3.2. Sampling grids
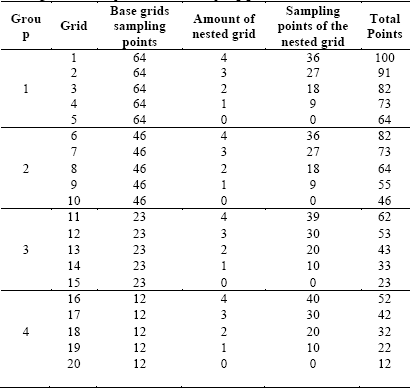
Twenty soil sampling grids of the four soil properties were used to test the application of AI, PI and OGI. From grid one (Fig.3 and Fig. 5(1)), we developed the other 19 grids (Table 1 and Fig. 5). The grids were divided into four groups which were based on the base grid.
In Group 1, the base grid presented 64 georeferenced sampling points, an average of 2.9 points/ha (Grid5) (Fig. 5(5)). In Group 2, the base grid presented 46 points, an average of 2.09 points/ha (Grid 10) (Fig. 5(10)). The base grid of Group 3 presented 23 points, an average 1.04 points/ha (Grid 15) (Fig. 5(15)). The base grid of Group 4 presented 12 georeferenced sampling points, an average 0.54 points/ha (Grid 20) (Fig. 5(20)).
The initial grid of each group consisted of the base grid and four nested grids. The second grid of each group consisted of the initial grid of each group minus the nested grid located in the southeastern portion of the area. The third grid is characterized by the second grid of the group minus the nested grid located on the northwest portion of the area. In order to form the fourth grid of each group, we used the third grid minus the nested grid located at the northeast portion of the area. The fifth grid of each group is characterized only by the base grid (Fig. 5 (5, 10, 15 and 20)). The nestled grid was completed removed from grids 12, 13, 14, 15, 17, 18 and 19 (Fig. 5 and Table 1), which means that we removed all of the sampling points, including the main grid point. For the other grids that presented nested grid, we have kept the main grid sampling point and removed the other 9 sampling points of the nested grid.
3.3. Test of the indexes and indicator to soil properties
The measured soil properties at each soil-sampling grid were evaluated for spatial dependence and these results are shown for P in Table 2, for Prem in Table 3, for K in Table 4 and for T in Table 5.
The semivariogram parameters correspond to a spherical model and all yielded results except for grid 20 for the T (Table 5).The nugget ( C0 ) is an important parameter of the semivariogram and indicates unexplained variability, considering the sampling distance. For P, C0 ranged from 0, in grids 4, 9, 10, 12, 13, 14, 15, 17, 18 and 19, to 224.51, in grid 20 (Table 2). For Prem, the nugget effect varied from 0, in grid 4, 9, 10, 17, 19 and 20, to 2.45, in grid 5 (Table 3). The K had C0 ranging from 134.65 (grid 5) to 891.21 (grid 20) (Table 4). For the T, C0 ranged from 0 (grid 5, 10, 14, 18, 19) to 0.56 (grid 16) (Table 5).
Table 1 Tested sampling grids divided into groups in which are presented the base sampling grid points, the amount of nested grid, the sampling points of the nested grid and total points of each sampling grid.
Source: The authors
Table 2 Estimated semivariogram parameters adjusted by Ordinary Least Squares and by the spherical model for Phosphorus (P)
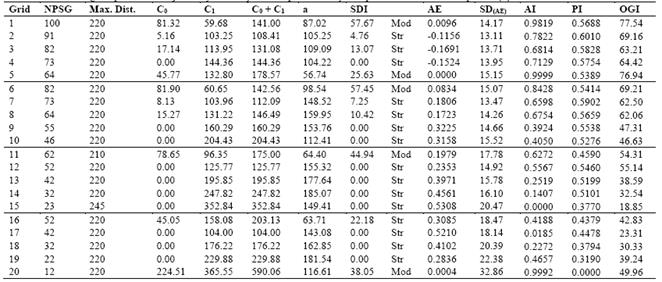
NPSG - Number of points of sampling grid; Max. Dist. - Maximum Distance used to the semivariogram adjustment; C0 - Nugget Effect; C1 - Spatially dependent component; C0+C1 - Sill; a -range or distance parameter; SDI - Spatial Dependence Index; AE - Absolute Error; SDAE- Standard Deviation of the absolute error; AI - Accuracy Index; PI - Precision Index; OGI - Optimum Grid Indicator; Str - Strong; Mod - Moderate.
Source: The authors
It is not possible to quantify the individual contribution of these errors, so that the C0 may be expressed as a percentage of the sill ( C0 + C1 ), allowing the comparison of the spatial dependence index (SDI) of the properties under study [31].
Table 3 Estimated semivariogram parameters adjusted by Ordinary Least Squares and by the spherical model for Remaining Phosphorus (Prem)
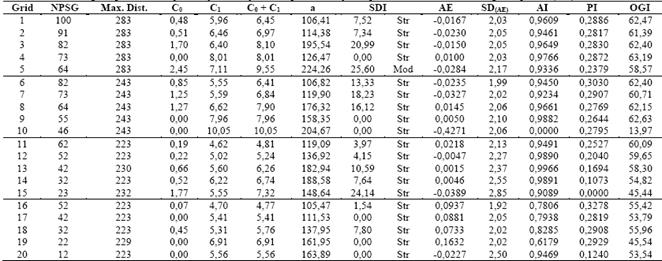
NPSG - Number of points of sampling grid; Max. Dist. - Maximum Distance used to the semivariogram adjustment; C0 - Nugget Effect; C1 - Spatially dependent component; C0+C1 - Sill; a - range or distance parameter; SDI - Spatial Dependence Index; AE - Absolute Error; SDAE - Standard Deviation of the absolute error; AI - Accuracy Index; PI - Precision Index; OGI - Optimum Grid Indicator; Str - Strong; Mod - Moderate
Source: The authors
Table 4 Estimated semivariogram parameters adjusted by Ordinary Least Squares and by the spherical model for Potassium (K)
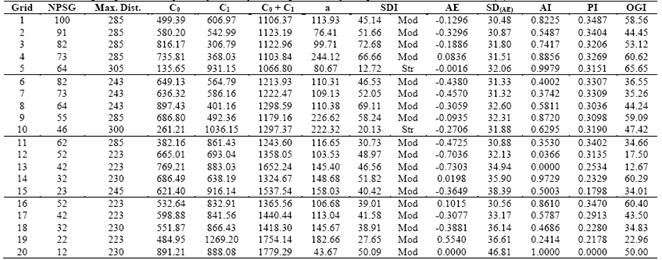
NPSG - Number of points of sampling grid; Max. Dist. - Maximum Distance used to the semivariogram adjustment; C0 - Nugget Effect; C1 - Spatially dependent component; C0+C1 - Sill; a -range or distance parameter; SDI - Spatial Dependence Index; AE - Absolute Error; SDAE- Standard Deviation of the absolute error; AI - Accuracy Index; PI - Precision Index; OGI - Optimum Grid Indicator; Str - Strong; Mod - Moderate.
Source: The authors
Using the SDI classification presented by [5], P may be classified as having a strong degree of spatial dependence to grid 15 and moderate degree for other five grids. The SDI was strong in Premfor19 grids and only one presented moderate SDI. For K, only two grids presented strong SDI, while 18 grids presented moderate SDI. The attribute T presented strong SDI in 17 grids, one grid presenting moderate SDI, and one grid, presenting weak SDI.
The range (a) of a semivariogram is important in determining the spatial dependency, which can also be indicative of the interval between soil mapping units [31]. Using the SDI classification presented by [5], P may be classified as having a strong degree of spatial dependence to grid 15 and moderate degree for other five grids. The SDI was strong in Premfor19 grids and only one presented moderate SDI. For K, only two grids presented strong SDI, while 18 grids presented moderate SDI. The attribute T presented strong SDI in 17 grids, one grid presenting moderate SDI, and one grid, presenting weak SDI.
Table 5 Estimated semivariogram parameters adjusted by Ordinary Least Squares and by the spherical model for CEC at pH 7.0 (T)
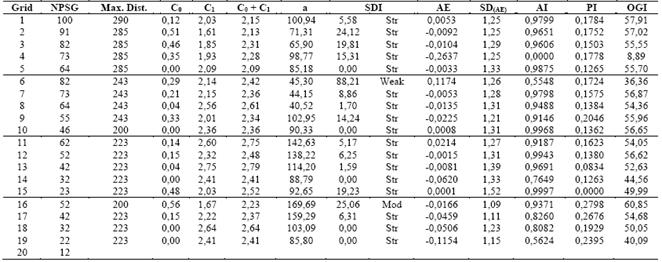
NPSG - Number of points of sampling grid; Max. Dist. - Maximum Distance used to the semivariogram adjustment; C0 - Nugget Effect; C1 - Spatially dependent component; C0+C1 - Sill; a - range or distance parameter; SDI - Spatial Dependence Index; AE - Absolute Error; SDAE - Standard Deviation of the absolute error; AI - Accuracy Index; PI - Precision Index; OGI - Optimum Grid Indicator; Str - Strong; Mod - Moderate.
Source: The authors
The range (a) of a semivariogram is important in determining the spatial dependency, which can also be indicative of the interval between soil mapping units [31]. The studied soil properties presented different ranges of spatial dependence. For example, the a for P varied from 56.74 m in grid 5 to 185.07 m in grid 14. For the Prem a ranged from 105.47 m (grid 16) to 224.26 m (grid 5), for K, from 43.67 m (grid 20) to 244.12m (grid 4) and for T, from 40.52 m (grid 6) to 169.69 m (grid 16).
According to [28] the 2002/2003 and 2003/2004 harvesting seasons of a coffee plantation was studied in a 6.7 ha field with a sampling grid of 68 points. Their semivariogram analysis indicated C0 = 0.09 m and a = 86 m for P in the first season, and C0 =0.52 and a = 210 m, in the second season. The values for K for the first harvest were C0 = 579 m and a =142 m, and for the second harvest, C0 = 973 m and a =188 m. According to [11], during a three year (2007, 2008 and 2009) study on a coffee plantation and a soil sampling rate of 1 point/ha, a C0 = 0 m for P was found in all three years with a = 133 m in 2007, 90 m in 2008 and 157 m in 2009. The C0 and a values for K were C0 = 0 m in 2007 and 2008, and C0 = 0.0018 m in 2009. The values for a were 165 m in 2007, 438 m (2008), and 84 m (2009).
In this work we may observe that the nugget effect and the range, as well as the chosen grid, depended on the studied soil properties. Thus, in order to evaluate the 20 studied grids, we used the validation criteria: absolute error (AE) and Standard Deviation of Absolute Error (SDAE). For comparative purposes, we developed and proposed the Accuracy Index (AI), Precision Index (PI) and, finally, an index which correlates both: the Optimum Grid Indicator (OGI), thus leading us to choose the best grid.
We used the AI and PI and the indicator OGI by adjusting the semivariogram for each of the sampling grids for P, and by using the validation values. Therefore, we found that the most accurate grid (largest value of AI) was grid 5, followed by grids 20, 1 and 6, with the most inaccurate being grids 15, 17, 14 and 18. The most precise grid (largest value of PI) was grid 2 followed by grids 7, 3 and 12, with the most imprecise being grid 20 followed by grids 19, 15 and 18. However, we desired to find a sampling grid that was both accurate and precise, which would be best suited to evaluate the spatial dependence of P. Therefore, we used the Optimum Grid Indicator (OGI), which pointed us to grid 1, with 100 sampling points, as the most accurate and precise (OGI equal to 0.7754). This was followed by grid 5, with 64 sampling points, which OGI value was 0.7694, very close to the OGI value of grid 1. Other grids with higher OGI value were grids 6, 2 and 4.
For Prem, the most accurate sampling grid was grid 13, followed by grids 12, 14 and 9, while the more inaccurate grids (low value of AI) were respectively 19, 16, 17 and 18. The most precise sampling grid (larger value of PI) was grid 16, with grids 6, 19 and 8 also presenting high PI values. Grids 15, 14, 20 and 13 were highlighted as imprecise. Given the OGI values in Table 3, we note that grid 4 (with 64 base grid points and 9 nested grid points) presented the largest value, which means that this grid was more accurate and more precise, ensuring a good mapping operation. This grid was followed by grids 9, 1, 6 and 3.
Studying the soil property K, we observed that the most accurate sampling grid (larger AI value) was grid 20, followed by grids 5, 14 and 4. The most inaccurate grids were 13, 19, 15 and 2. The most precise sampling grid (highest PI) was grid 1, followed by grids 16, 2 and 11, while the most imprecise grids were 20, 15, 19 and 18. The OGI (Table 4) pointed to grid 5 as the best to represent the K content in the soil (larger OGI value). This grid was followed by grids 4, 16, 14 and 9. We also observed that grid 20 showed the best AI value, but at the same time, it showed the smallest PI value, which reflected directly in OGI performance, making it so that this grid did not figure among the good grids. Similar behavior may be observed for the P.
Testing the 20 grids for CEC at pH 7.0 (T) the sampling grid with the most accuracy (higher AI value) was grid 15, followed by grids 10, 12 and 5. The grid that presented the highest PI value was grid 16, highlighted as the most precise grid. This grid was followed by grids 17, 19 and 9. The grids that presented the lowest AI values were grids 4, 6 and 18, and the most imprecise were grids15, 13, 10 and 12. The OGI pointed to grid 16, with 52 sampling points (12 points of base grid and 40 points of nested grid), as the most accurate and precise. So it was chosen as the best grid to represent the T. This sampling grid was followed by grids 1, 2, 7 and 10.
As stated, the indexes allowed the observation of the accuracy and precision of the sampling grids, and OGI identified the grid that best represents the spatial variability of the soil properties. We observed that each soil property presented a sampling grid that better represented its spatial dependence. However, when performing soil sampling, we expect to analyze not a chemical attribute of the soil separately, but a set of these, optimizing and reducing the cost of the sampling operation and of the laboratory analyses. Thus, in order to choose the best sampling grid it is necessary to look for that which best represented the four soil properties studied. We calculated the average OGI, which is nothing more than the average OGI presented by the four soil properties for each grid (Table 6). Allowing the ranking of the grids by its average OGI.
Grids 1, 2, 3, 5, 8, 9 and 16 presented the highest values of OGI. Grid 5 may be highlighted as the best sampling grid. In practice, this grid becomes interesting because it presents 64 points (an average of 2.9 points/ha) and also for containing no nested grid, which facilitates the sampling process and reduces operational costs. Thus, for the grid with many points in the base grid, the nested grid may not have made a difference. However, the nested grid affected the grids that had few points in the base grid. This may be observed by grid 8 (2 nested grid), grid 9 (one nested grid) and grid 16 (4 nested grid), which were higher than their group base grid (grid 10 and grid 20, respectively). It is important to note that these grids were among the top sampling grids. Although grid 1 (4 nested grid), grid 2 (3 nested grid) and grid 3 (2 nested grids) were not superior to its base grid, they were superior when compared to the other grids.
As stated, grid 5, with approximately 3 sampling points/ha, were pointed to as most indicated to be used for sampling the soil of the studied field. The grid with 2 points/ha, 1 point/ha or 0.5 point/ha were ranked as 16th, 18th e 20th, respectively, and were not recommended for use. It is noteworthy that grid 20, which has 12 sampling points (0.5 points/ha), did not adjust to the CEC at pH 7.0, thus we avoided its use. We recommend the use of nested grids to improve sampling results when it is necessary to use sampling grids with as few sampling points as possible. If there is a need to use base grid with a few sampling points, it is recommended to use nested grids to improve sampling results.
Thus, we conclude that errors will occur when using a 0.5, 1 and 2 points/ha sampling grid. If we were to choose a 0.5 pt/ha sampling grid, mistakes would be even greater.
Studies performed by [19] emphasize the need to use a larger number of sampling points per hectare. They tested different sampling grids for a corn crop and their results showed the importance of carefully choosing sampling grid.
5. Conclusions
We characterized the magnitude of the spatial variability of the four soil chemical properties in all soil sampling grids except for CEC at pH 7 in grid 20. We also observed that the soil variables had spatial dependence structure, allowing us to obtain the validation parameters.
We proposed, developed and tested the Accuracy Index (AI) and Precision Index (PI) allowing us to rank the quality of the sampling grids and we used the Optimum Grid Indicator (OGI) to select the best sampling grid for each of the four soil properties.
The methodology proposed by this work allowed us to find a sampling grid that best represented the studied soil variables (grid 5, which presented approximately 3 points per hectare in a square grid). Also, we verified the difference between sampling grids, and soil variables.
The results showed that the choice of a sampling grid is critical to good performance in the application of precision agriculture techniques to the coffee crop.


