1. Introduction
Decrease of light crude oil around the world has posed a great challenge for the petroleum industry; one of the alternatives to extract a greater amount of remnant oil in this type of mature reservoirs is the implementation of an Enhanced Oil Recovery method like polymer injection. This technique represents an improvement when compared to conventional water injection because the viscosity of the displacing fluid is increased in order to decrease the oil mobility ratio in the reservoir [1,3,6,7,12,16,33-35].
However, during the passage through the porous media, the polymeric molecules are attracted by the rock surface as a result of physical and chemical interactions between the components [2,4,6-9,12,16,20,22,28,34]. This phenomenon, known as adsorption, decreases polymer concentration in the injected solution and, therefore, the efficiency of the process is seriously affected.
Adsorption effects can be studied in the laboratory by the conduction of both static and dynamic testing. Static testing determines adsorption for a given substrate and it is sometimes overestimated when compared to what occurs at reservoir level as a result of the analysis of a greater surface area than the real one. However, this technique is an economic option to determine adsorption behavior based on the variation of a specific parameter: salinity.
In this research paper, an isotherm series were built from 144 static tests on kaolinite substrate, changing the polymer concentration (one commercial HPAM) and brine salinity in order to determine the effect of Sodium Chloride (NaCl) and Calcium Chloride (CaCl 2 ) on adsorption. Then, the experimental data produced were adjusted to the Henry, Langmuir and Freundlich adsorption isotherm; the corresponding variation is determined considering the various scenarios. Finally, the reasons for an unusual decrease of adsorption when NaCl concentration increases are discussed as a result of a marked flocculation of the kaolinite substrate.
2. Methodology
Polymer adsorption in petroleum reservoirs depends on various parameters such as the type of polymer, molecular weight, concentration, degree of hydrolysis, brine salinity, and reservoir temperature [1,2,4,6-10,12,13,16,17,20,23,30,31,34,35].
Adsorption increment was first explained by Martin [1]: an increment in the Total Dissolved Solids (TDS) results in a decrease of the hydrodynamic size of polymer molecule, thus decreasing electrostatic repulsion between the substrate and the polymer. As a result, adsorption increases.
NaCl and CaCl 2 concentration varied in prepared brines in order to determine the effect of salinity on adsorption; an isotherm series were build based on these data in order to observe this phenomenon. Kaolinite, a commercial polymer (HPAM) and the salts mentioned above were used for the conduction of electrostatic testing.
Experimental testing was conducted at NaCl concentrations of 0,5; 1 and 2 wt%, in absence of any other salt, as it has been reported by Martin [1]; then, concentrations of CaCl 2 of 2, 5 and 10 wt%, also in absence of other salts, were used as reported by Chiappa [2]. For each salinity values, solutions of 100, 200, 300, 400, 500, 600, 700, 800, 900 and 1.000 ppm of polymer were prepared, as reported by Green & Willhite [3] and Zheng [4], for the construction of the isotherms.
In order to ensure data reliability, a duplicate of each polymer concentration was prepared in order to guarantee a reliable tendency for experimental purposes. Triplicates were prepared for those cases where a clear tendency was not observed, given the stochastic nature of this type of testing.
3. Experimental section
Screens of 50 and 200 mesh, a simple divider, a glass funnel, and a scale were used for the conduction of the testing procedure.
3.1. Procedure
Disintegration of substrate, drying of material in an oven, and straining of the mixture through 50 and 200 mesh screens in order to ensure a range of particle size.
The simple is separated and a representative simple is taken; 5 g of sample and 15 g of polymeric solution of NaCl and CaCl 2 . at the corresponding concentration values are taken.
The samples are placed in a container and this recipient is closed. Then, the samples are taken to an oven at reservoir temperature for two days. In this case, the value taken was the characteristic temperature of an oil field located in the Middle Magdalena Valley basin (VMM) in Colombia, that is, 60°C.
Finally, the liquid is separated from the kaolinite aggregate by using a centrifuge or a qualitative paper filter in order to measure the concentration of polymer in the supernatant liquid.
Measurements of the polymeric solution equivalent concentration was conducted with a spectrophotometer; the absorbance data are associated to the concentration data previously calibrated for each solution.
In order to control and validate this experimental testing stage, repeatability and reproducibility (r&R) of data were ensured. Repeatability is defined as the concordance of proximity between successive measurements of the same test under the same conditions. Reproducibility is the proximity among the results of successive experiments of the same set of tests when the measurement conditions change [5].
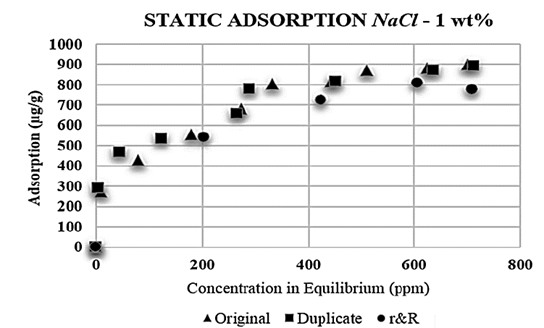
The whole set of tests was duplicated (repeatability) and finally, two more polymeric solutions were prepared: one with NaCl 1 wt% and the other with CaCl 2 5 wt%. These solutions were diluted at the polymer concentration previously defined (from 100 to 1.000 ppm); the results for the NaCl and CaCl 2 solutions are shown in the Figs. 1 and 2, respectively.
Source: The Authors.
Figure 1. Repeatability and reproducibility (r&R) - polymer adsorption with NaCl 1 wt %.
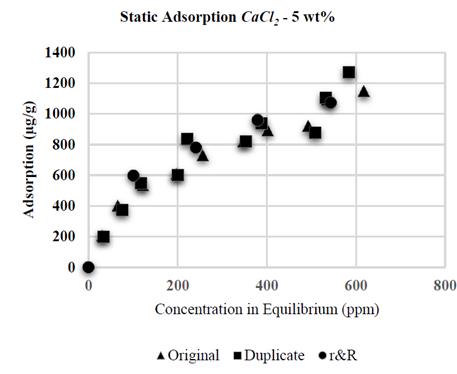
Source: The Authors.
Figure 2. Repeatability and reproducibility (r&R) - polymer adsorption with CaCl 2 5 wt%.
Each mother solution was diluted at concentrations of 300, 500, 700 and 900 ppm, and new adsorption tests were conducted with these solutions in order to ensure their reproducibility.
The results of the adsorption tests with CaCl 2 brines are shown in Fig. 3. A fast increment of the adsorption values is observed at low polymer concentration and stabilization is observed at the end of the curve; conversely, at low concentration of polymer, adsorption is practically independent from salinity and contrary to what has been reported for NaCl brines, the experiments based on CaCl 2 show a direct adsorption relation with regard to the concentration of polymer and salinity [8, 9, 23, 30, 31]. It is worth highlighting that no flocculation occurred in the experiments based on CaCl 2 .
Contrary to the reports of Sheng [7], the adsorption tests with NaCl showed an inverse tendency: the higher salinity, the lower adsorption; this can be explained by the flocculation of kaolinite substrate; in the presence of NaCl, clays like kaolinite tend to flocculate thus decreasing the available area for adsorption. Meister [8] developed experiments with brines containing 5.600 ppm of sodium (Na), the adsorption value in this case was 417,5 µg/g on kaolinite substrates while brines containing 1.900 ppm of sodium (Na) the result is 1.217 µg/g due to substrate flocculation. This work presents NaCl concentrations in the brine of 0,5; 1 and 2 wt%, corresponding to 5.000, 10.000 and 20.000 ppm, respectively. Some authors suggest that flocculated kaolinite shows about 80% less than superficial area [9].
The Fig. 4 corresponds to the photographic record of this phenomenon and show the filters of flocculated samples and non-flocculated samples. In flocculated samples, the polymeric solution contained dispersed particles of kaolinite, while non-flocculated samples all kaolinite are decanted at the bottom of the container, and regardless the stirring conducted, the kaolinite remained agglomerate.
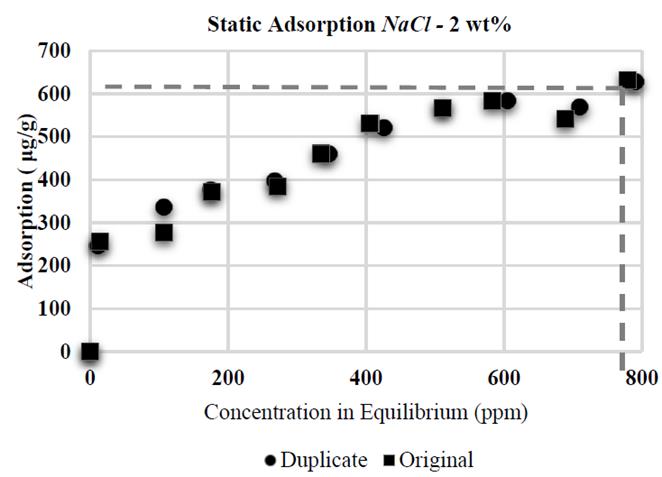
It was proven that CaCl 2 causes higher adsorption than NaCl: when conducting tests with same wt % of NaCl and CaCl 2 (2 wt% each, Fig. 6 and 7, respectively), the higher adsorption value with CaCl 2 was 822 μg/g, compared to the value with NaCl (631 μg/g). Divalent ions increase adsorption in HPAM in greater proportion than monovalent ions as a result of an increased reduction of electrostatic repulsion between the substrate superficial charges and polymer molecules; this results in an increased affinity of the polymer for the brine [10], thus allowing increased polymer adsorption in the solid surface.
4. Analytical models
The topic of adsorption has been extensively studied in the field of surface chemistry. Many analytical models have contributed to the quantification and prediction of this phenomenon being most of them based on experimental results. In this work, the models of Langmuir, Freundlich, and Henry were selected based on their satisfactory results for the determination of polymer adsorption.
Depending on each model, adsorption behavior varies depending on the adsorbent + adsorbate system so the experimental data were adjusted to the analytical model based on the minimum square regression operation and the MATLAB® tool.
4.1. The Henry adsorption model
The Henry Model assumes that adsorption is directly proportional to solute concentration in a solution. However, one of the most limiting factors of this model is its strict application to low solute concentrations [19].
Batches ranging between 200 and 1.000 ppm [3] are applied during the polymer injection phase, and this range falls into the efficient values for the development of this work (maximum 400 ppm). Other factors assumed by this model, besides its application at low solute concentration are:
Energy levels on the Surface are equivalent so there is not any preference of the adsorbate to occupy a specific place on the adsorbent.
The surface is infinite. The reason for this assumption is based on the fact that the solute concentration is so low that if we compare it to the available adsorbent surface, the adsorbate can be retained with no restriction.
There is no interaction between molecules once they are adsorbed.
The type of adsorption occurring is a monolayer adsorption due to the low concentration of solute utilized.
The eq. (1) corresponds to the mathematical expression proposed by Henry to quantify adsorption based on solute concentration:
Where
 adsorption, K
H
Henry’s constant that depends on the adsorbate + adsorbent system, and Ci= solute concentration.
4.2. The Langmuir adsorption model
Irving Langmuir [14] contributed largely to the field of Surface Chemistry in his work about adsorption on solid surfaces where he proposes a model to predict gas adsorption according to the pressure system and under the following assumptions:
The adsorbing gas molecules adsorb into an immobile state.
The adsorbate organizes in the form of a monolayer on the surface of the adsorbent.
There are no interactions between adsorbate molecules on adjacent sites
The solid surface has a certain amount of positions for adsorption and each position is equivalent in terms of energy levels. Therefore, there is not any preference to occupy a specific place.
When the adsorbate is a solute, an expression involving solute concentration is required. The eq. (2) shows the mathematical expression proposed by Langmuir.
Where
 = adsorption of solute on the surface; Ci=concentration in equilibrium of solute; α= maximum adsorption capacity of the system; and K
L
= Langmuir affinity constant, equivalent to the ratio between the adsorption constant K
A
and desorption K
D
.
4.3. The Freundlich adsorption model
The Langmuir isotherm represented a great advance in the field of Surface Chemistry. However, this model works with many assumptions that, most of the time, do not correspond to the real conditions. As a result, many works attempting to improve the representation of this phenomenon were presented after its publication.
Erwin Finlay-Freundlich [11] developed in 1918 an empirical equation to determine adsorption based on a series of a gas-solid experiments. The Freundlich adsorption model has the following assumptions.
The adsorbent surface is heterogeneous from the thermodynamic standpoint. As a result, the adsorbate molecules will allocate according to their energy level.
Adsorbed molecules can overlap one on top of the other, producing a multilayer adsorption type, depending on the energy levels available on the surface.
There is not any interaction between adsorbed molecules.
The expression for the gas - solid system can be adapted for those cases where the adsorbate is a solute and the adsorbent is a solid, as it is shown in the eq. (3):
Where
 = solute adsorption on the surface Ci=solute concentration in equilibrium; and the constants K
F
and 1/n are determined by experimental testing.
The number of absorbed molecules is not stabilized as a result of the multilayer adsorption; the various energy levels on the surface shall produce an increasing amount of overlapping adsorbed molecules. Therefore, Freundlich isotherm does not show the characteristic plateau of Langmuir although it does show an increasing tendency. The Fig. 8 shows a comparison among the tendencies for each model described.
5. Results and discussion
The experimental data collected were entered in a MATLAB® program using minimum square regression and the second derivation criterion to find discrepancies between experimental data and the data obtained from each analytical model. Finally, the model that best adjusted to the experimental data was selected.
The graphs corresponding to the MATLAB® data are shown below. The number shown beside the legend of each model corresponds to the sum of quadratic errors. The eq. (4) indicates the error between the analytical model (𝑥𝑖) and the experimental data 𝑦𝑖.
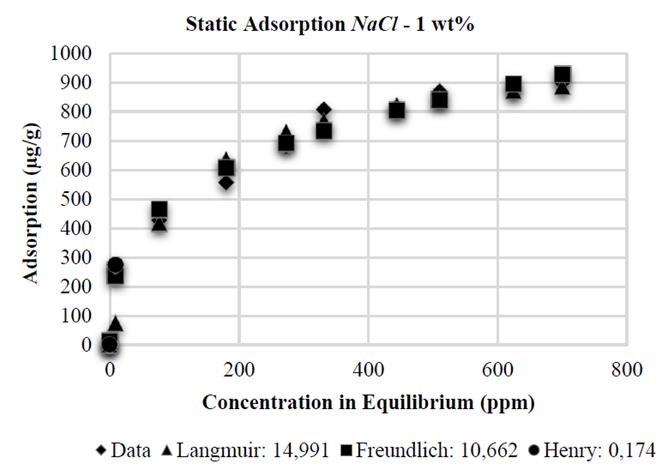
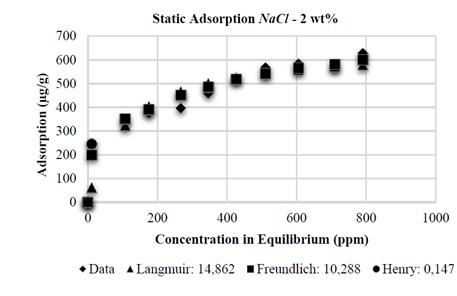
The Henry adsorption model, due to its low-concentration restriction, shows the best adjustment when compared to the models analyzed. However, this model does not include all the domain evaluated at experimental level. This is the reason why the Freundlich model is the model that best adjusts to the adsorption data on kaolinite substrates with NaCl at 0,5; 1 and 2 wt%, with an error of 20,619 - 10,662 and 10,288%, respectively, as it is shown in the Figs. 9, 10 and 11.
The bibliography confirms this tendency [12], that is, high concentration values generate high adsorption rates. The adsorbent surface is not homogeneous in this model and, therefore, adsorbate molecules shall allocate in the places where adsorption is allowed by the surface free energy. In other words, the polymer is adsorbed on preferential areas over the kaolinite and, as a result, the solid substrate will not saturate completely. Therefore, the adsorption curve will not stabilize and shall maintain an increasing tendency.
Similar to the experiments with NaCl, the Henry adsorption model adjusts correctly, at low polymer concentration, in the tests with CaCl 2 . However, the adjustment of polymer adsorption on kaolinite with CaCl 2 at 2 and 10 wt% is better when applying the Langmuir adsorption model, showing errors of 9,248 and 16,176 respectively, as its shown in the Figs. 12 and 14. Adsorption stabilization is obtained despite the increasing equilibrium concentration. However, adsorption in the presence of CaCl 2 at 5 wt% shows a similar tendency as reported by Freundlich, with an error of 12,112% (Fig. 13).
Finally, the Table 1 shows the values of the constants obtained by MATLAB® for each analytical model. It is observed that in the presence of NaCl, the Langmuir affinity constant, K L , tends to decrease. This tendency is also observed in the maximum adsorption capacity, 𝑎; this is consistent with the experimental data and confirms that the system has less adsorption capacity; by contrast, NaCl concentration increases kaolinite flocculation. The constants K F and 1/n of the Freundlich model also show this tendency: the greater salinity, the lower the values of these constants. Regarding CaCl 2 , the behavior observed is different.
When the salt concentration increases, the Langmuir affinity constant tends to decrease while its maximum adsorption capacity increases. As it has been experimentally demonstrated, high CaCl 2 concentrations represent high adsorption values and, therefore, a higher maximum adsorption capacity. The Freundlich constant 1/n increases as CaCl 2 concentration increases; the K F constant shows an abnormal behavior because it initially decreases and then increases.
Since the Henry adsorption model shows domain restriction at low concentration (up to 400 ppm), adsorption increases in a ratio 2:1 in all cases with regard to the concentration values, except when the polymer was in the presence of NaCl at 0.5 wt% where this ratio was 5:1. The assumptions of the Langmuir model are: the monolayer adsorption type occurring, lack of interaction between molecules, and lack of preference for a specific place on the substrate. This results in the occupation of the whole surface in theory as the polymer increases its concentration. This is demonstrated by the curve stabilization at the highest values of adsorbate concentration.
6. Conclusions
An abnormal tendency was observed in the kaolinite substrates and NaCl polymeric solutions: high salinity values result in lower adsorption values due to flocculation of the kaolinite substrate. This process is inherent to the clay behavior.
The Langmuir adsorption model was the best adjusted to the experiments with CaCl 2 due to its tendency to final stabilization. This can be attributed to the monolayer-type adsorption and the lack of interaction between adsorbed molecules. These two assumptions were considered by this model.
Regarding the data obtained with NaCl, it was observed that the Freundlich model shows greater affinity to the experimental tendency. This model establishes that the adsorbate will be allocated on preferential zones of the adsorbent and, therefore, the solid substrate will not be saturated resulting in the lack of stabilization in this curve.
The Freundlich adsorption model has some assumptions that could be more precise regarding the heterogeneity of rock properties in a reservoir. However, the experiments with CaCl 2 reveal that the Langmuir model was the best adjusted with NaCl.


