1. Introduction
The limestone sand also known as carbonate sand, is formed from skeletal remains of marine organisms and/or not skeletal oolites of calcareous material. Its structure is characterized by gaps between particles that intensifies the tendency of breaking of this material but presents high friction angle due to the interlocking of its grains [1]. These features have a huge outcome on the foundation behavior of offshore structures, as in the case of monopiles, where lateral friction obtained is lower than the quartzite sands, what is credited, primarily, to the high compressibility of its soil. Therefore, the calcareous sands are fragile and presents a substantial volume reduction, when submitted to compressive stress [2-4].
Carbonate sands are found around the world along continental platforms and slopes extending to the abyssal plains of the seabed [5]. Particularly in Brazil, it is present in Northeast offshore region, local with the highest potential of wind power generation of the country (around 700 GW) [6].
The increasing interest in the knowledge of the carbonate sand behavior is related to the difficulties in the performance of offshore foundations concerning its resistance and deformability. [7] highlights that monopiles on carbonate sands have around 1/3 of load capacity than monopiles on silica sand. There is a history of problems occurred in foundations of platforms that happen due to the difficulty in recognizing that the behavior of limestone soil is not necessarily the same as that of non-limestone soil with similar classification [8].
Although carbonate sands of several locations have common characteristics (angular and fragile grains and high compressibility due to its porosity and irregularity), shear resistance, compressibility and permeability might vary with each region. Therefore, care is needed when evaluating engineering parameters, collecting existing data from previous projects whenever possible. This database increases confidence in the tests performed to characterize specific locations and allows the development of trends in the results [9].
An offshore turbine installation requires a foundation that receives loads resulting from turbine mass and rigidity variation along its geometry, as well as loads imposed by the work setting, allowing deformations that do not exceed the surrounding soil strength [10].
For foundation projects of monopiles on calcareous sand, the laboratory and field static tests may provide important strength parameters in lateral friction evaluation. In the case of dynamic tests, they allow acquisition of monopiles degradation under cyclic loading. The higher the volume reduction (and, consequently, the shear deformations), the higher the degradation of the soil’s stiffness modulus, (or G shearing modulus), that can lead to the reduction of capacity of loading for extreme loads; in addition it can approximate the natural structure frequency to the load’s frequency band, what might be critical. That is why, the service life of offshore structure strongly depends on soil’s rigidity and its knowledge is essential for the study of the structure response [4,11].
The shear modulus is a parameter that associates a deformation to a specific shearing soil solicitation. This parameter varies according to the increase of deformation range and, for very low strains (10-4%), the corresponding modulus stiffness (GMAX or G0) may be considered maximum and constant. GMAX represents the rigidity in the context of reversible deformations, and it is controlled by particles contact in the soil’s structure [12,13].
Mair [14] presents the variation of G with increasing strain ranges and the appropriate methodology for obtaining shear modulus for each range. The use of bender elements (BE) corresponds to the adequate technique to obtain GMAX at exceptionally low strains. Although these transducers do not directly provide the shearing modulus, they apply methodologies based on shear waves propagation for acquisition of S-wave velocity (VS) in triaxial and oedometer tests, that consist of non-destructive techniques [15].
Obtaining GMAX as a function of the shear wave velocity is given by eq. (1), where ρ is the specific weight of the soil.
The calculation of the VS through the bender elements (BE) is given by the relation of the distance (L) between transmitter and receiver elements and the travel time (t) in which the wave travels that distance (eq. (2)).
The travel time between the input and output signals can be subjective and several approaches have been developed based on different interpretations for the measurement of this parameter. This includes methodologies in time domain (TD) or in frequency domain (FD) [16-18]. The first one is of interest in the present study, being the most common and widely used because it is a simpler procedure, with reasonable results and which does not require the use of frequency analyzes software [16,19]. Although the analyzes in the FD presents advantages, the results generated by the transfer function may be affected by higher frequencies applied under higher confining stresses [20].
In this work, time domain analyzes are presented to establish the VS obtained by BE in samples of carbonate sands and, through this parameter, it is possible to characterize their behavior under shear deformations.
2. Materials and methods
2.1 Materials
The material used corresponds to a sand with a content of calcium carbonate (CaCO3) of about 50% (CA50). Due to the difficulty in obtaining naturally carbonated sands, CA50 was produced by combining a quartz sand (QZ) and a commercially acquired carbonate sand, whose calcium carbonate content is about 80% (CA80). Carbonate sands produced artificially are representative since data from naturally cemented carbonate sediments are often highly dispersed [21]. The particle size curve for this material is shown in Fig. 1.
It is observed that the granulometry of the sand did not interfere in the CA50 curve by the incorporation of CA80 to QZ. The CaCO3 content, maximum and minimum voids, curvature coefficient (CC), non-uniformity coefficient (CNU), relative density of the grains (GS) and strength parameters of the CA50 are shown in Table 1.
Regarding the bender elements used in this work, they were manufactured by GDS and they present dimensions in mm of 1,5 x 3 x 11 with speed data acquisition of 2 Mega samples/second.
2.2 Sample preparation
The analyzes performed consisted of consolidated drained triaxial tests (CD) with bender elements. Two samples - 01CA50 and 02CA50 - were made with dry soil by the air pluviation method until reaching a relative density (DR) around 80% (83.2% and 87.2%, respectively).
The air pluviation method is based on the study by [22] and the apparatus used is shown in Fig. 2. During calibration procedure, the funnels openings, the height of the sand fall and the sieves opening were altered to achieve the desired DR. The calibration resulted in funnels with a final diameter bore of 12 mm and a set of seven #4 sieves (with an opening equal to 4.76 mm) according to [23] that were selected for a fall height of 31.5 cm and 86.5 cm as shown in Fig. 2.
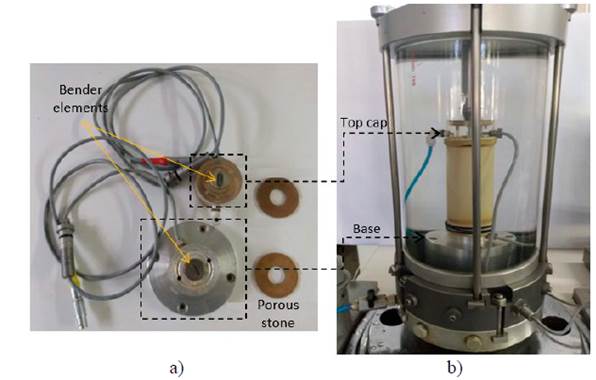
The mold with the internal membrane installed was positioned under the sieves, the vacuum pump was turned on and the sand mass required for a sample was placed inside the funnel with the opening initially closed. After sand pluviation and sample levelling, the top cap of the triaxial chamber was placed. One of the bender elements was placed against the base and the other one under the top cap, and care was taken to ensure that they were perfectly aligned.
Calibration is carried out considering the delay effect of the equipment, which cannot be eliminated, but incorporated into the subsequent analyzes to rectify the results. The calibration was performed at different frequencies, with the vertical alignment of the BE's. The measured delay was 11 μs.
2.3 Test procedure
The specimen of 5 cm in diameter and 11.1 cm in height, with base and top cap, was placed and fixed in the triaxial chamber. After applying the vacuum and removing the mold, the desired confining tension was applied by filling the triaxial cell with water and the sample was left to consolidate for 60 minutes. Fig. 3 shows the experimental apparatus of the procedure.

Source: The authors.
Figure 3 Experimental apparatus - a) BE at top cap and base; b) Triaxial chamber.
Electric excitation was applied to the emitting BE through a wave generator at the desired frequency. The generated data is checked simultaneously and, if satisfactory, is recorded. For each confining stress, this process is repeated at each input frequency.
Loading and unloading tests were carried out at the effective confining stress of 50 kPa, 100 kPa, 300 kPa, 600 kPa and 800 kPa; cycling stress of 50 kPa and 800 kPa. Sine (SIN) and square (SQR) signals were performed at frequencies of 6 kHz, 8 kHz, 10 kHz, 12 kHz and 15 kHz in both samples, to ensure repeatability of the tests.
3. Data analyzes and interpretation
3.1 Correction of distance and time
Although the determination of the travel time of the shear wave imposes subjectivity when calculating the wave velocity, the distance covered by the waves also requires some care. Some authors [12,24] consider the BE's tip-to-tip distance to provide the best accuracy, but in the case of triaxial samples, this distance changes as the sample deforms. Therefore, the heights were corrected for each tension tested by measuring the volume change.
Regarding the measurement of the travel time of the shear wave, near-field effects are of special relevance for time domain analyzes [25-27]. These are interferences in the output signal, which can mainly mask the identification of the shear wave point of arrival [16]. To mitigate this effect, readings that did not meet the L/λ> 2 ratio were excluded, as suggested by [28]; where λ is the wavelength.
The delay (Δ𝑡𝑑) equal to 11 μs was considered in travel times measured for the three methods during this work.
3.2 Determination of TD times
3.2.1 First arrival method (FA)
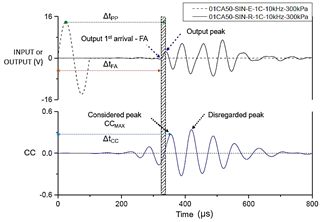
It consists in directly measuring the time elapsed between the wave emitted and the one received by the initial points of both (Fig. 4). Despite being the most intuitive and immediate interpretation technique, obtaining the first inflection of the output wave can be subjective [15] and, in addition, the near-field effects can influence the point to be considered in the received wave [29].

Source: The authors.
Figure 4 Time intervals considered for the FA, PP and CC methods for the frequency of 10 kHz and σc = 300 kPa in sample 01CA50. SIN is the sine input, with (E) emitter, (R) receiver and 1C equivalent to a loading cycle.
The determination of the travel time (ΔtFA) of the shear wave was made considering the zero-crossing point of the output wave with the x-axis (time) after the first upward trend of the signal for the tests performed by this method.
3.2.2 Characteristic points method (PP)
Characteristic points of the emitted signal and the received signal are identified and the difference between them is assumed as the wave travel time. These points are such as peaks, valleys or crossing at zero. It is noteworthy that the intervals between the successive characteristic points are not identical due to the signal attenuation and the frequency difference between the emitted and received signals [15,16].
The analyzes by the characteristic points method in the present work used the peak-to-peak time interval (ΔtPP) between input and output, as shown in Fig. 4.
3.2.3 Average method
To obtain greater reliability in the travel time determination process (Δ𝑡), the average of the times obtained from the two previous methods (Δ𝑡FA and Δ𝑡PP) was considered, discounting the delay (Δ𝑡𝑑) according to eq. (3). This procedure was recommended by the Japanese Geotechnical Society in 2011 [30].
The main reason for applying this procedure is to obtain a more reliable travel time than the singular consideration of the times obtained by each methodology. After establishing the wave travel time using the FA and PP methods, the time adopted in the comparative analyzes was calculated using eq. 3.
3.2.4 Cross-correlation method (CC)
This method makes use of a cross-correlation (CC) function that measures the degree of correlation between two signals using the CCxy(τ) coefficient, according to eq. (4). X (t) and Y (t) are the input and output time histories, respectively; τ is the delay between the signals and T is the computed time.
This method is based on the consideration that the travel time (t) of the wave corresponds to that in which the CCxy(τ) coefficient assumes its maximum value [12,31].
For the correlation function between the input and output signals in samples 01CA50 and 02CA50, the results showed oscillations in the wave shape and it was found, in most of the results, that the first peak of the output wave did not correspond to the largest peak generated by correlation between signals. Similar results obtained by [32] also showed that for sandy soils the first and the maximum peak did not coincide. [31] suggested that, in these situations, it should not be considered the greatest peak for establishing the ΔtCC time, but that one of the first occurrence. For this reason, Fig. 4 gathers the three methodologies and points out the first peak that was considered and the peak with the greatest amplitude that was disregarded in the CC analyzes.
3.2.5 Unloading and cycling
Upon reaching the 800 kPa confining stress during the loading phase, the samples were discharged to the same loading stresses (600kPa, 300kPa, 100kPa and 50kPa) completing a load cycle to verify the pre-loading effect of the tested sand. The wave travel times obtained are according to the methods already presented.
The cycling procedure involves six cycles that were performed with readings at the 50kPa and 800kPa stresses levels to assess the influence of cyclical loading on the shear stiffness.
4. Results
4.1 First arrival method (FA)
For this method, despite the subjectivity of the choice of the considered point, the determination by the crossing point on the x-axis resulted in a small dispersion of the values obtained, as observed in the graph (Fig. 5), which contains the standard deviation value for the means of VS presented along the graph.
It is important to highlight the good agreement observed when comparing the time values (ΔtFA) obtained for the two samples (01CA50 and 02CA50). The results showed that the procedure and the interpretation considered are adequate considering the low standard deviations obtained for both samples tested. Although the presence of the near-field effect can make it difficult to identify the travel time, the zero crossing of the waves for the various frequencies tested occurred almost simultaneously regardless the input frequency for all the tests performed.
4.2 Peak to peak method (PP)
The time intervals determined by the peak-to-peak method indicated an increase in dispersion with an increase in the confining tension. However, even so, the samples showed good agreement (Fig. 6).
Fig. 5-6 also allow us to observe the similar trend of the shear wave velocity as the confining tension increases.
4.3 Average method between FA and PP
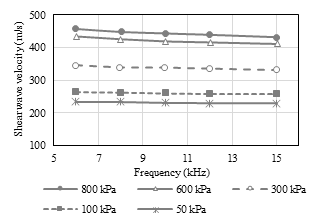
For the Japanese method using average between methods, the velocities obtained were evaluated based on the input frequency for the loading tests and the results are shown in Fig. 7.

Source: The authors.
Figure 7 Relation of VS and f for the method of average at different confining stresses.
It is observed for the same frequency, the increase in the confining tension implied an increase in the VS. In addition, it is noted that the variation in the values of VS over the range of frequencies studied seems to be more susceptible to higher confining stresses (above 300 kPa). This is probably related to the near-field effects that are most effective in higher confining tensions. As already mentioned, in these conditions there was an increase in VS and, consequently, an increase in wavelength (especially for lower frequencies).
This may indicate that, at these stress levels, to keep the L/λ ratio as far away from 2 as possible, it should be considered increasing the distance between BE’s or the excitation frequency of the signal.
4.4 Cross-correlation method (CC)
The graph of VS versus σc allows the visualization of the behavior found with the plotted standard deviation values shown in Fig. 8. The results obtained showed good agreement of the Vs values for both samples, and the behavior was similar when compared with the previous methods, showing an increase in VS with an increase in σc. The deviations shown in Fig. 8 have intermediate values between the FA and PP methods.
An evaluation of the velocities obtained was also performed based on the input frequency (f) for this method. Fig. 9 shows the graphs of VS versus f for each tested confining stresses. Distinctly the evaluation allowed by Fig. 7, there is a better convergence of the velocity values for the different frequencies, which was already expected considering that the CC method is less susceptible to variation in this parameter.
4.5 Summary analyzes for loading conditions
Given the presented, the following points can be highlighted: i) the increasing trend of VS with increasing σc can be perceived in the three methods used for the tested samples; ii) the results presented over the previous items allow to validate the experimental procedure carried out given the good agreement of the values obtained for both samples; iii) the evaluation by the CC method resulted in VS values from 13% to 16% lower than the average adopted according to the Japanese proposal for the average of the methods.
Vs results for carbonate sand were accessed in the literature for comparison with results obtained by the present study. [33] obtained for an average confining stress of 50 kPa and 100 kPa in Quiou sand (about 75% of CaCO3 content), a range of velocities varying from 200 m/s to 270 m/s (with a relative density from 18% to 85%). For higher values of confining stresses (700 kPa), [34] found for Kenia sand (DR = 96% and CaCO3 content = 97%) a velocity of 445 m/s. Despite the difference between the calcium carbonate content and the relative density of the samples, the velocity values are in accordance with the findings in the present work, except for the VS for CC method (Fig. 8) at higher levels of stress.
Fig. 10 shows the results obtained for sample 01CA50 for lower, intermediate, and higher confining stresses (50, 300 and 800 kPa, respectively) in the three methods for the different frequencies.
4.6 Influence of unloading and cycling conditions
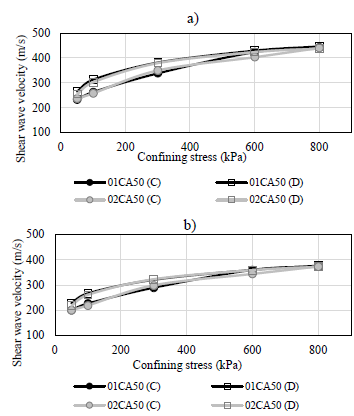
Fig. 11 shows a comparison of VS versus σc obtained for loading (C) and unloading (D). It is noticed that the unloading velocity form an envelope of points with higher values at the same confining stress; a behavior that was verified in both samples.

Source: The authors
Figure 11 VS e σc loading (C) and unloading (D) paths for a) Average method and b) CC method.
In addition, a visual inspection shows that there was no significant difference between the values found for the stress of 600kPa and 800kPa, however, for the lower stresses, this difference reached 18% in the confining stress of 100kPa. Thus, for carbonated sand CA50 it is notable that the discharge influences the wave velocity and, consequently, the shear stiffness.
This difference may be related to the high relative density of sample preparation (80% reference DR). In addition, the increasing of these parameters is probably due to change on soil’s density during the loading and unloading process. In the case of carbonate materials this influence may be related to the nature of the grains and their break during the increasing load.
Fig. 12 shows the VS results for the carbonated sand submitted to the six loading and unloading cycles. Note that the cycles generated did not significantly influence the parameters for the 800kPa stress. For the 50kPa, an increase in dynamic parameters is noted, however, this increase coincides with that generated during the first discharge (Figs. 11-12).
5. Conclusions
The present study aimed to determine the shear wave velocity VS of a carbonated sand with 50% CaCO3 from the data generated in triaxial tests using bender elements. The analyzes were performed using time domain methodologies to interpret the wave travel time. The use of a range of excitation frequencies (input) was also evaluated to complement the methods for determining the time of arrival of the shear wave in the TD.
The results showed that the confining stress influences the dynamic parameters (VS and, consequently, GMAX). Based on the tests performed, an increase in the confining stress led to a non-linear increase in VS for all the time evaluation methods used.
The determination of travel time by the first wave arrival method showed results with low discrepancy. The results obtained for the FA method are in accordance with the literature that identifies this method as the most common used for the interpretation of laboratory tests, due to the lower variation in time values when compared with other methods. The peak-to-peak method showed the same increasing trend of VS with increasing σc but with greater deviation for results.
By analyzing the VS in the considered frequency range, the average method (between FA and PP methods) showed a greater variation in velocity for higher confining. This is probably because, at these stress levels, the L/λ ratio approaches 2, making the signals more susceptible to the near field effects.
Finally, the unloading analyzes showed that the VS values increased during the process. There was an increase in relative density during unloading, indicating a reduction in the void index during the swelling process. This behavior may be associated with the presence of carbonates, due to their fragile nature. However, a grain break study was not performed to confirm this hypothesis. For cycle analyzes, at the 800 kPa confining stress level, the dynamic parameters were less influenced by cycling, while a more notable increase in VS was observed for the 50 kPa stress. However, results for the completed cycling process coincides with that one obtained from only one cycle.


