Depression is one of the most prevalent diseases in the world (World Health Organisation, 2021). In the Americas, this disorder represents 15% of the global disease burden (World Health Organisation, 2017), having become one of the leading causes of non-fatal health loss (James et al., 2018). Specifically, South America is one of the regions with the highest number of cases of depression (Pan American Health Organisation, 2018). In countries such as Ecuador, the prevalence is 4.6% and it represents 9.2% of the disability adjusted life total (Kohn et al., 2018). Furthermore, it is estimated that only 4.7% of the population in low-and middle-income countries receives adequate treatment (Pan American Health Organisation, 2018).
Depressive disorders are commonly under-recognised in Primary Care (PC) settings (Akincigil & Matthews, 2017), remaining undetected about half the time they are present (Craven & Bland, 2013). There are several barriers to their identification, such as the insufficient training of health professionals, limited time for clinical care (Kroenke & Unützer, 2017), and the fact that many patients more often report somatic or physical complaints without directly referring to their emotional problems related to depression (Haftgoli et al., 2010). The lack of adequate treatment leads to the worsening of symptoms (James et al., 2018), and decreased quality of life for patients (Unützer & Park, 2012).
Reliable, brief, and easy-to-administer depression screening tools are important to help PC professionals identify at risk patients (Nabbe et al., 2017). Specifically, the Patient Health Questionnaire-9 (PHQ-9, Kroenke et al., 2001) is one of the most widely used instruments for screening depression in PC settings (El-Den et al., 2018; Manea et al., 2015) due to its brevity and excellent psychometric properties (Kroenke et al., 2010; Kroenke & Spitzer, 2002). The PHQ-9 is an adjectival type scale derived from the Primary Care Evaluation of Mental Disorders (PRIME-MD) for evaluating depressive symptoms with the criteria of the DSM-IV (Kocalevent et al., 2013).
Subsequent studies in different languages and contexts have also shown that the PHQ-9 is an acceptable standard of measurement with good psychometric properties (Manea et al., 2015). Regarding the PHQ-9 factorial structure, the literature shows mixed results that support both the single-factor (depression) and the two-factor (somatic and cognitive-affective) structure, both in community and clinical settings, as well as for both sexes, multiple age groups and different countries (Lamela et al., 2020).
In the Latin American context, Spanish versions of the PHQ-9 have been reported to be reliable and valid measures in PC from Honduras (Wulsin et al., 2002), Chile, (Baader et al., 2012; Saldivia et al., 2019), Argentina (Urtasun et al., 2019), Colombia (Cassiani-Miranda et al., 2021), and Spanish-speaking populations residing in the United States (Huang et al., 2006). In Ecuador, there is only one study that has analysed the tablet-based PHQ-9 as a screening for depression in terms of correlation and feasibility (Grunauer et al., 2014). However, its psychometric properties have not been rigorously validated specifically in Ecuador.
The present study aims to examine the psychometric properties (specifically, the unidimensional and two-dimensional factor models, sex invariance, internal consistency, and convergent and divergent validity) of the Spanish version of the PHQ-9 (Diez-Quevedo et al., 2001) in the Public Health Care setting in Ecuador.
Method
Participants
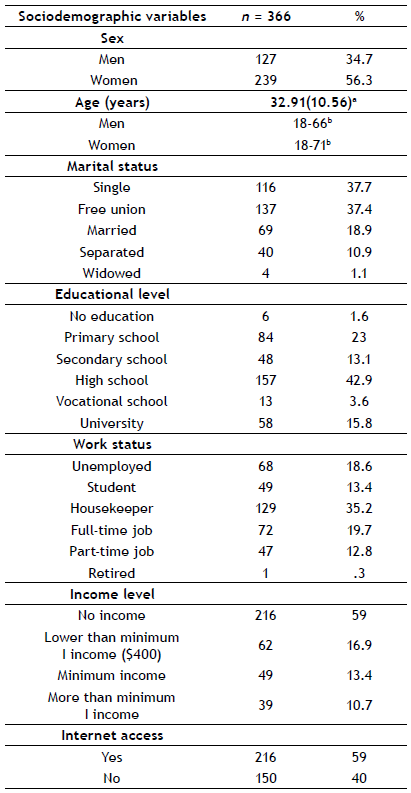
The sample consisted of 366 patients (127 men and 239 women) of the Dr. Gustavo Domínguez Zambrano Hospital (HGDZ) related to the Public Health Ministry of Santo Domingo (Ecuador). All the participants were between 18 and 71 years of age (M = 32.91, SD = 10.56). The inclusion criteria were: (a) age of 18 years or more; (b) subject to no cognitive impairment (e.g., memory loss, confusion, or problems in understanding the content of the survey); and (c) the granting of voluntary consent for participation in the study. Sociodemographic data appears on Table 1.
Procedure
The study was approved by the Teaching Department and the Ethics Committee of the Hospital Gustavo Domínguez Zambrano (MSP-CZ4-HGDGDZ-DI-2019-0022-M). Participants were recruited from the waiting rooms by an expert psychologist from the Hospital's Mental Health Unit, between August 2019 and January 2020. The psychologist encouraged the patients to participate in the study on the psychometric validation of the PHQ-9, and was present at each application to provide instructions. The survey was administered in paper-and-pencil format. Written informed consent was requested from all participants after explaining the objectives of the study. Participants were informed of the content of the questionnaires and that participation was completely voluntary. They were also guaranteed anonymity and the confidentiality of their data. On average, it took between 20 and 30 minutes to complete the survey.
Measures
The Patient Health Questionnaire-9 (PHQ-9; Kroenke et al., 2001) is a 9-item self-administered test for screening, diagnosing, monitoring, and measuring depression severity. Participants describe their case, taking into account thetwo weeks prior to the evaluation. Items are rated from 0 to 3, denoting “not at all”, “several days”, “more than half the days”, and “nearly every day”, respectively. Total scores range from 0-27. Cut-off points of 5, 10, 15, and 20 represent mild, moderate, moderately severe, and severe depression (DSM-IV-TR; American Psychiatric Association (APA), 2002). This study used the Spanish version by Diez-Quevedo et al. (2001), which has been shown to have good psychometric properties (k = .62; overall accuracy, 91%; sensitivity, 84%; specificity, 92%) in the detection of depression in medical and surgical inpatients in the Spanish hospital setting.
The Beck Depression Inventory-II (BDI-II; Beck et al., 1996) is a self-report consisting of 21 items that measure the presence of depressive symptoms. Participants choose the statement that best describes their case in the two weeks leading up to and, including the day of application. Items are rated from 0 (“not at all”) to 3 (“extreme form”), depending on the chosen statement, and the total score ranges from 0 to 63. Standardised score ranges for categorical levels of depressive symptoms are as follows: 0-13 (minimal depression), 14-19 (mild depression), 20-28 (moderate depression), and 29-63 (severe depression). This study employed the Spanish version by Sanz et al. (2003), which has been demonstrated to exhibit good psychometric properties. In the current study the alpha coefficient was excellent (α = 0.90).
The Generalised Anxiety Disorder Scale (GAD-7; Spitzer et al., 2006) is a 7-item self-reported measure that assesses the symptoms and severity of anxiety based on the DSM-IV diagnostic criteria. Items are rated from 0 (“not at all”) to 3 (“nearly every day”), and the total score ranges from 0 to 21. The Spanish version by García-Campayo et al. (2010), which was used in the present study, has evidenced good internal consistency. In this study the Cronbach’s alpha was very satisfactory (α = 0.88).
The Positive and Negative Affect Scale (PANAS; Watson et al., 1988) is a 20-item scale that evaluates two independent dimensions: positive affect (10 items) and negative affect (10 items). Items are rated from 1 (“very slightly or not at all”) to 5 (“very much”), and the total score for each subscale ranges from 5 to 50. This study used the Spanish version by Sandín et al. (1999), which has shown adequate internal consistency. In the current study, the alpha coefficients were quite satisfactory for both subscales (α = 0.90 for positive; α = 0.88 for negative).
The Quality-of-Life Index (QLI, Spanish version, Mezzich et al., 2000) is a 10-item self-reported questionnaire that measures 10 dimensions related to the construct of “quality-of-life” (ranging from physical well-being to spiritual fulfilment, including a global perception of quality-of-life). Items are rated from 0 (“not at all”) to 10 (“completely”). The index presents good psychometric properties. Cronbach’s alpha in the present study was excellent (α = 0.90).
Data analysis
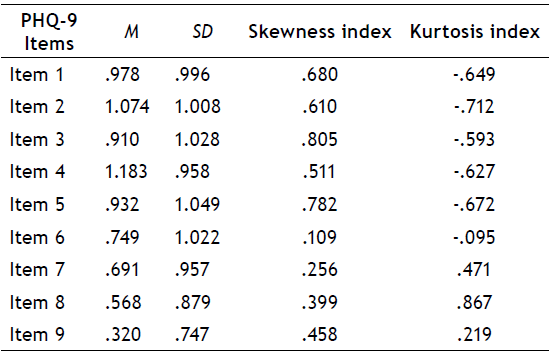
First, we performed a confirmatory factor analysis (CFA) to test the factor structure of the PHQ-9. Once the skewness and kurtosis values (see Table 2) in our data were analysed, the unidimensional factor model and a two-dimensional factor model with two latent variables (somatic and cognitive/affective) were estimated by Weighted Least Squares Mean and Variance Adjusted (WLSMV), a procedure recommended for non-normal ordinal data (Finney & DiStefano, 2006). Moreover, model fit was assessed using the Chi-Square (χ2) goodness-of-fit test (p ≥ .05), the Comparative Fit Index (CFI), the Root Mean Square Error of Approximation (RMSEA), and the Standardised Root Mean Square Residual SRMR. Values of at least .90 (excellent over .95) in the CFI, less than .06 in the RMSEA and less than .08 for the SRMR represent a good fit (Hu & Bentler, 1999).
Secondly, in order to examine the measurement invariance with regard to sex, we conducted a multi-group CFA (Gregorich, 2006), also estimated with WLSMV given the ordinal nature of the items. We constructed the following three increasingly restrictive models: where all the parameters were free (model 1: configural invariance, that is, when the same factor structure is freely estimated in both groups); where the loadings were invariant (model 2: metric invariance, that is, when there is equivalence in the meaning of the latent factors studied among groups); and where the loadings and intercepts were invariant (model 3: scalar invariance, that is, when there is equivalence in the factor loadings and the thresholds of the items across sex). The following fit indices were used to evaluate the relative fit of the models: differences in the Chi-Square (Δχ2) and the CFI (ΔCFI). A non-significant Δχ2 and a value of less than .01 in the ΔCFI are indicators of invariance between the groups (Cheung & Rensvold, 2002). Chi-square differences were calculated with DIFFTEST, the procedure for categorical (ordinal) data.
Thirdly, the internal consistency of the PHQ-9 was evaluated using Cronbach's alpha and McDonald's omega coefficients. Finally, to assess the PHQ-9 convergent and divergent validity, bivariate correlations with Pearson’s r were performed to test the relationship of the PHQ-9 with the BDI-II, the GAD-7, the PANAS, and the QLI. CFA and invariance analyses were performed with Mplus v. 8.5, and descriptive data, reliability, and correlation analyses with SPSS v. 26.
Results
Descriptive statistics
Table 2 shows the mean, standard deviations, and distribution of the PHQ-9 items in our sample.
Confirmatory factor analysis
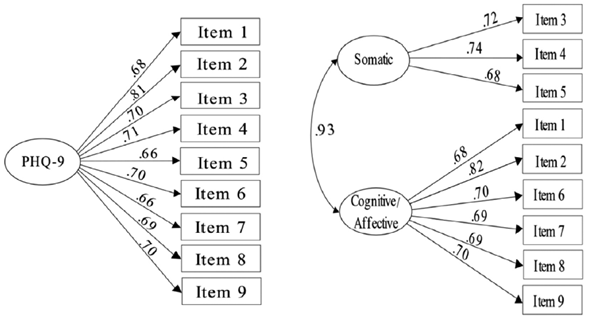
The model fit statistics of the unidimensional factor model (χ2(27) = 66.716, p < .001; CFI = .981; RMSEA = .063; SRMR = .039) and the two-dimensional factor model (χ2(26) = 62.186, p <. 001; CFI = .983; RMSEA = .062; SRMR = .037) were adequate. However, in the case of the two-dimensional factor model, the correlation between the somatic and cognitive/affective latent factors was very high (r = .933), demonstrating non-discrimination between the latent factors. A correlation of .933 per se is not sufficient proof of non-discrimination. However, we also have the relative fit of both models. Following Cheung and Resvold (2002) differences of less than .001 in the CFI (a logic that may be extended to the RMSEA and the SRMR) are meaningless and therefore the more parsimonious model should be retained. These differences in our case are: DCFI = .002; DRMSEA = .001; DSRMR = .001. Additionally, we have calculated a chi-square difference with DIFFTEST, the procedure to compare chi-squares in WLSMV estimation. This difference was not statistically significant Dc2 = 3.85, p > .05, thus supporting the one-factor model over the two-factor model. Finally, a 95% confidence interval with regards to the correlation between the two factors included 1 (no discrimination) 95% CI (.859-1.007). For these reasons, the unidimensional factor model, the most parsimonious, was retained as a better fitting model. Table 3 shows the fit indices of the unidimensional and two-dimensional factor models.
Table 3 The fit indices of the unidimensional and two-dimensional factor models
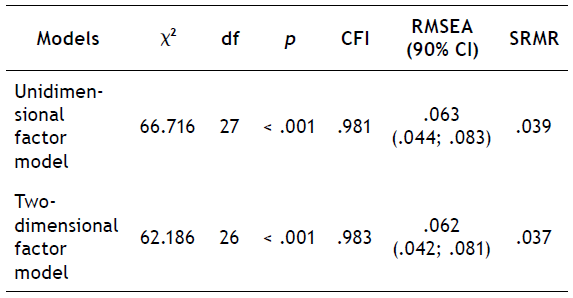
Note: CI, Confidence Interval; CFI, Comparative Fit Index; df, degree of freedom; RMSEA, Root Mean Squared Error of Approximation; SRMR, Standardised Root Mean Square Residual; χ2, Chi- Square Value.
Figure 1 shows the standardised factor loadings for the unidimensional and two-dimensional factor models using the entire sample. In both models, all factor loadings were significant (p < .05), ranging from .664 to .815 for the unidimensional factor model, and from .669 to .822 for the two-dimensional factor model.
Multi-group confirmatory factor analysis (CFA)
Prior to testing for sex measurement invariance, the one-factor model was estimated separately for men and women. Fit for men was adequate: χ2(27) = 38.75, p < .001; RMSEA = .059, 90% CI (.000-.097); CFI = .981; SRMR = .058.
Model fit in the case of women was also adequate: χ2(27) = 60.82, p < .001; RMSEA = .072, 90% CI (.048-.097); CFI = .977; SRMR = .044. Table 4 shows the summary of goodness of fit indices for the tested models in multi-group CFA. Model 1, where all parameters were free showed adequate fit indices (CFI = .980; RMSEA = .065; SRMR = .049), determining configural variance. There were no significant differences between this unconstrained model and the more restrictive models according to the significance of the Chi-Square indices (p > .05) and the differences found for the CFIs (i.e., they were less than the .01 cut-off point). Hence, metric (p = .324; Δ CFI = .001) a nd s calar ( p = .262; ΔCFI = .002) invariance was established for women and men.
Internal consistency
Overall scale reliability was good (α = .852; ω = .855), in both women (α =.862; ω = .864) and men (α = .824; ω = .828) too. The reliability indices for the other scales were also adequate: BDI-II (α = .904; ω = .905); GAD-7 (α = .883; ω = .884); QLI (α = .902; ω = .903), and positive and negative affect dimensions of the PANAS respectively (α = .896; ω = .897, α = .881; ω = .886).
Convergent and divergent validity
The correlations between the PHQ-9 total score and the measuring scales of depression (BDI-II), anxiety (GAD-7), positive and negative affect (PANAS), and quality-of-life (QLI) are shown on Table 5. A strong correlation was found between the PHQ-9 total score and the BDI-II (r = .758), as well as a moderate correlation with the GAD-7 (r = .631) and the negative dimension of the PANAS (r = .631). In addition, a less strong correlation was found with the positive dimension of the PANAS (r = - .399) and the QLI (r = - .570).
Table 5 Correlations between the PHQ-9 and BDI-II, GAD-7, PANAS, and QLI scales
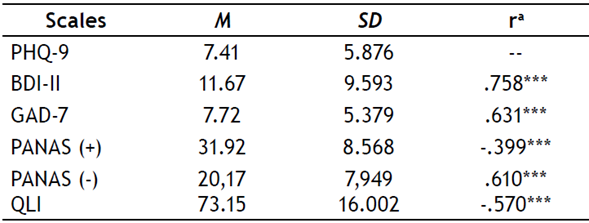
Note: BDI-II, Beck Depression Inventory-II; GAD-7, General Anxiety Disorder-7; M, Mean; PANAS; Positive and Negative Affect Schedule; (-), negative; (+), positive; PHQ-9, Patient Health Questionnaire- 9; QLI, Quality-of-Life Index; SD, Standard Deviation.
Discussion
The main goal of our study was to provide evidence regarding the psychometric properties of the Spanish version of the PHQ-9 (Diez-Quevedo et al., 2001) in the public health context of the Ecuadorian population. The factor structure (unidimensional and two-dimensional factor model), sex invariance, reliability, and convergent and divergent validity were tested.
The results of our CFA support the unidimensional factor model with excellent fit and adequate factor loadings for the all PHQ-9 items as conceived in the original design (Kroenke et al., 2001) and replicated in a series of subsequent studies (e.g., Aslan et al., 2020; González-Blanch et al., 2018). In contrast to other studies (Granillo, 2012; Krause et al., 2010), the high correlation between somatic and cognitive/affective factors in the two-dimensional factor model suggests that these factors are not well differentiated, thus providing additional support for a single-factor solution.
According to the measurement invariance results, our data demonstrate satisfactory fit on the configural, metric and scalar invariance models with regards to sex, showing an equivalence in the PHQ-9 structure for men and women. This finding is consistent with other studies carried out with a sample of primary care patients in Spain (González-Blanch et al., 2018), American university students (Keum et al., 2018), and Peruvian citizens (Villarreal-Zegarra et al., 2019). In addition, a large section of the literature supports using the unidimensional model in the general population in the comparison between men and women (Doi et al., 2018).
The internal consistency coefficient reported in this study was good for the whole sample (α = 0.852; ω = .855) and for both groups (α = 0.862; ω = .864, women; α = 0.824; ω = .828, men), being only slightly lower than that obtained with the samples of the primary care and gynecology patients in the original study by Kroenke et al. (2001), but higher than in other studies with similar health settings (Baader et al., 2012; Hanlon et al., 2015), showing adequate reliability for our sample.
The results regarding the correlation of the PHQ-9 with measures of depression, anxiety, positive and negative affect, and quality of life reinforce the evidence of its construct validity. As in previous studies, the PHQ-9 global score showed a strong positive correlation with the BDI-II (Diez-Quevedo et al., 2001; Lamela et al., 2020), demonstrating good convergent validity. Moreover, moderate correlations between the PHQ-9 with the GAD-7 and the affect dimension of the PANAS, as well as weaker correlations with the positive affect dimension of the PANAS and the QLI were interpreted as evidence of discriminant validity as in previous studies (Díaz-García et al., 2020; Lee & Kim, 2019; Mira et al., 2019).
A strong point of this work is related to the characteristics of our sample, and also the context in which it has been carried out. So far, only one study exists in the Ecuadorian population that analyses various psychometric properties of the PHQ-9 (Grunauer et al., 2014). However, that study took place in the private health sector, which hinders transferring results to other contexts, such as the public health setting. Therefore, the present study is spearheading in that it provides evidence regarding the application of the Spanish version of the PHQ-9 in the Ecuadorian population, and in the public sector.
One limitation of this study is that a gold standard criterion for diagnosing depression was not included, and therefore, we cannot determine the sensitivity and specificity or the cut-off points for the diagnosis nor the severity of depression by means of the PHQ-9 in our sample. Another important limitation of our study is that non-probability sampling was used, in consequence the results cannot be generalised to the total population and should be interpreted with caution. Future studies should examine the potential of the PHQ-9 in terms of its diagnostic efficacy in the Ecuadorian population, including a larger and more representative sample (e.g., by sex, gender, educational level, work status) and considering other regions of the country. In addition, another aspect that needs to be taken into account in future studies is the use of cross-cultural adaptations of existing instruments so that they can be used effectively in a wide range of cultural settings and languages.
In conclusion, the results of this study support the unidimensional factor model and the sex invariance of the PHQ-9 scale. Moreover, this instrument is reliable and presents good convergent and divergent validity with other related constructs. The quick and easy application of the PHQ-9 would allow correct identification of depressive symptoms in the population attending public health services in Ecuador.


