Introduction
The Tietê River has high social and economic significance for the state of São Paulo, Brazil, because it is an important source of water, food, and labor for river communities (Oliveira, 2014). The river is known for environmental problems, mainly caused by the chaotic growth of its bordering cities, and its fish biodiversity has been significantly affected by the construction of hydroelectric plants (Pereira, 2014).
One of the fish species in the Tietê River is Piracanjuba (Brycon orbignyanus), a rheophilic species native to the Plata river basin, with great economic importance (Antunes et al., 2010). This species undertakes trophic and long reproductive migrations, and prefers habitats with continuous water flow (Lima et al., 2003). Since Piracanjuba are omnivorous and highly sensitive to environmental changes, especially anthropogenic activities (e.g., destruction of riverside habitats, overfishing, and damming), natural populations of this species have decreased during recent decades (Agostinho et al., 2008).
Damming is the construction of a physical barrier that isolates populations and impairs the upstream migration of most fish species, including Piracanjuba, with marked consequences for intrapopulation genetic variability (Lopera-Barrero et al., 2010). Although stocking programs have been developed to mitigate these effects, research on their efficiency and genetic and environmental impacts is urgently required (Povh et al., 2010).
Inadequate management of broodstocks and lack of monitoring of both natural populations and specimens released in the rivers through stocking programs may trigger future loss of genetic diversity, generating homogenization (Satake and Araki, 2012). Consequently, correct stocking management -considering the biological characteristics of each species- is crucial for the production of quality fingerlings (Reynalte-Tataje et al., 2013) and this, naturally, includes the maintenance of genetic variability (Lopera-Barrero et al., 2014).
The use of molecular markers to assess the genetic composition of fish populations is an important strategy for measuring the genetic variability among specimens. Recent studies have shown that the use of RAPD (Random Amplified Polymorphic DNA) and microsatellites may provide important information on population genetics in fish culture stations and in natural environments, and these markers are widely used for analysis of genetic variability in several species (Ashikaga et al., 2015; Lopera-Barrero et al., 2016; Ribeiro et al., 2016; Coimbra et al., 2017; Souza et al., 2018).
Therefore, the present study aimed to analyze, for the first time, the genetic diversity of a natural population and two broodstocks of B. orbignyanus used in the stocking program of the Tietê River, Sao Paulo, Brazil, using RAPD and microsatellite markers.
Materials and methods
Samples of caudal fins were retrieved from a natural population (NP, 24 samples) of B. orbignyanus in the Nova Avanhandava reservoir of Rio Tietê (21º07’05’’S, 50º12’02’’W) and from two broodstocks in fish culture stations (Stock A = SA and Stock B = SB, 30 samples each) used in the stocking program by the energy company AES Brasil (21º17’52’’S, 49º47’20’’W). Stocks from fish culture stations were established using fish from the Paraná River captured in 2000, with the addition of new specimens from the Tietê River (one of the main tributaries of the Paraná River), state of São Paulo, Brazil. Methodologies employed were approved by the Committee for Ethics in the Use of Animals of Universidade Estadual de Londrina (CEUA UEL nº17156.2012.50).
DNA was extracted according to the NaCl extraction protocol of Lopera-Barrero et al. (2008) and quantified in a spectrophotometer (UV 1601; Shimadzu, Columbia, MD, USA) with 260 nm absorbance. For RAPD markers, genomic DNA was amplified in a 15 µL reaction volume containing 1× Tris-KCl, 2.5 mM of MgCl2, 0.46 µM of primer, 0.2 mM of each dNTP, 1 unit of Platinum Taq DNA Polymerase (Invitrogen, USA) and 10 ng of target DNA. DNA was denatured at 94 °C for 4 min, followed by 40 cycles, each comprising 1 min denaturation at 94 °C, 90 s annealing at 40 °C, and 2 min extension at 72 °C, with a final extension at 72 °C for 5 min. RAPD reactions were performed in a thermocycler (Eppendorf Mastercycler Gradient). The amplification of 60 decamer primers from kits OPA, OPX and OPW (Operon Technologies Ltd) was assessed and those primers with the best definition and reproducibility were used for further analyses (Table 1).
For microsatellite markers, DNA was amplified in a 20 µL reaction volume containing 1× Tris-KCl, 2.0 mM of MgCl2, 0.8 µM of each primer (Forward and Reverse), 0.4 mM of each dNTP, 1 unit of Platinum Taq DNA Polymerase and 20 ng of target DNA. DNA was initially denatured at 94 °C for 4 min, followed by 30 cycles, each comprising 30 s denaturation at 94 °C, 30 s annealing with variable temperature for each primer, 1 min extension at 72 °C, and a final extension at 72 °C for 10 min. Four loci, described by Barroso et al. (2003) for Brycon opalinus, were amplified (Table 1).
Table 1 Characterization of RAPD (Random Amplified Polymorphic DNA) primers and microsatellite loci. 
%GC: percentage of guanine and cytosine; NF: number of fragments; SR: repetition sequence; TA: annealing temperature; NA: number of alleles; T: size of alleles and fragments
Electrophoresis of RAPD fragments was performed in 1.5% agarose gels in 0.5 × TBE buffer (45 mM Tris-Borate and 1 mM EDTA) for 4 h at 70 V. Microsatellite marker amplification products were electrophoresed in denaturing 10% polyacrylamide gels (29:1 acrylamide: bis-acrylamide; 6 M urea), in 1 × TBE buffer (90 mM Tris-Borate and 2 mM EDTA) for 7 h at 320 V and 250 mA. Silver nitrate staining was used to visualize microsatellite alleles, following a modification of the method described by Bassam et al. (1991).
The size of RAPD fragments was estimated by comparison with a 100 bp ladder standard (Invitrogen, Carlsbad, USA). The percentage of polymorphic fragments was calculated with PopGene 1.31 (Yeh et al., 1999), and the program TFPGA 1.3 (Miller, 1997) was used to determine Nei’s genetic distance and identity measures. Arlequin 3.0 (Excoffier et al., 2005) was used to determine genetic differentiation by F ST estimates, analysis of molecular variance, and the number of migrants per generation (Nm). The genetic differentiation among groups was categorized as low (F ST = 0-0.05), moderate (F ST = 0.051-0.15), high (F ST = 0.151-0.25), or very high (F ST >0.25), following Wright (1978).
Microsatellite allele sizes were estimated by comparison with a DNA ladder (Invitrogen) of 10, 50, and 100 bp. The number of alleles, observed and expected heterozygosity, Hardy-Weinberg Equilibrium (HWE) test, number of migrants, and fixation index (F IS) were calculated for each locus using GENEPOP 4.0.6 (Rousset, 2008). Deficiency or excess of heterozygotes for loci in the HWE test was based on Fisher’s exact test and calculated by the Markov chain method (Markov chain length: 100,000; dememorizations: 10,000). Shannon’s genetic diversity index, allele frequency, and genetic distance and identity were calculated with PopGene 1.31 (Yeh et al., 1999). Allele richness was calculated with FSTAT 2.9.3.2 (Goudet, 2002). Analysis of genetic differentiation (F ST) and analysis of molecular variance (AMOVA) were performed using Arlequin 3.0. A dendrogram based on Nei’s genetic distance was constructed with MEGA 5.0 (Tamura et al., 2011).
Results
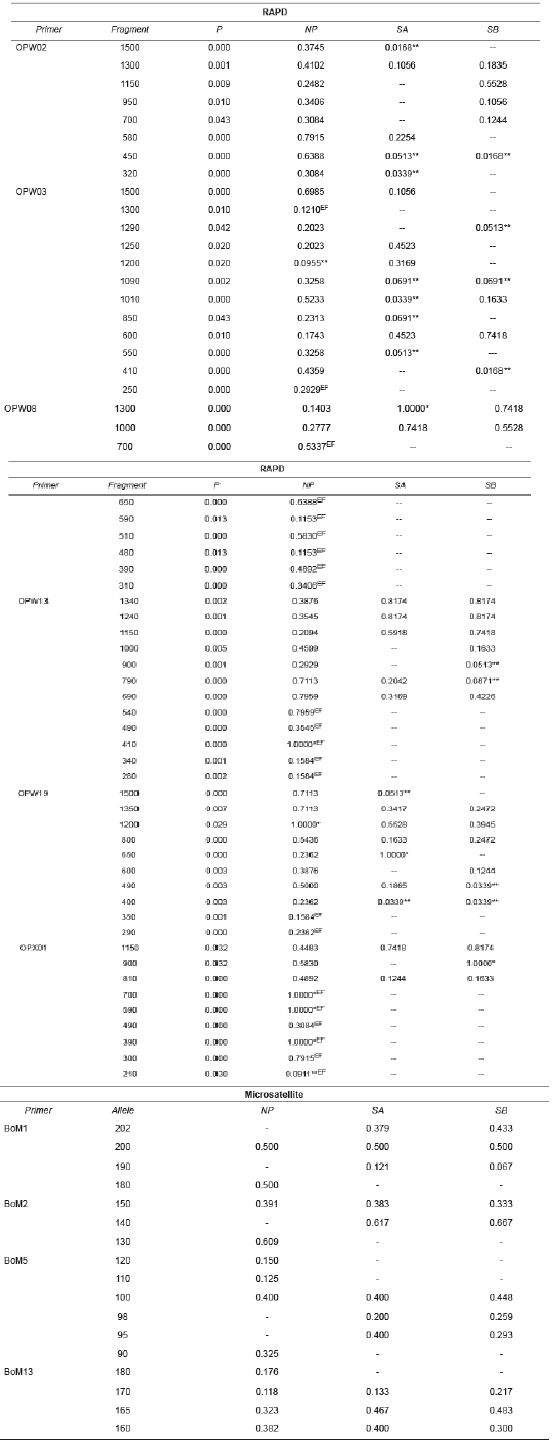
Sixty polymorphic RAPD fragments were retrieved, with variations between 15 (OPW03) and 5 (OPW08) fragments per primer. The largest fragments (approx. 1500 bp) were observed with primers OPW02, OPW03, OPW13, and OPW019, whereas the smallest fragment (210 bp) was observed with primer OPX01. All microsatellite loci used were polymorphic and amplified consistent and reproducible alleles. Seventeen alleles were observed, varying between six (BoM5) and three (BoM2) alleles per locus, with sizes between 90 bp (BoM5) and 202 bp (BoM1) (Table 2).
Table 2 Frequency of RAPD (Random Amplified Polymorphic DNA) fragments and microsatellite alleles in B. orbignyanus populations.

NP: natural population; SA: Stock A; SB: Stock B; *limiting fragments; **low frequency fragments; EF: exclusive fragment.
There were significant differences (p<0.05) in the number of RAPD fragments observed in NP (60 fragments), SA (29), and SB (28). Five limiting fragments (with frequency 1.000) and only two fragments at low frequency (less than 0.100) were observed in NP, revealing high genetic variability. Compared to NP, the stock populations showed fewer limiting fragments (SA: 2 and SB: 1), and more low- frequency fragments (SA: 9 and SB: 8), suggesting genetic similarity between SA and SB. Only NP showed exclusive fragments (22), indicating genetic differentiation between natural and stock populations.
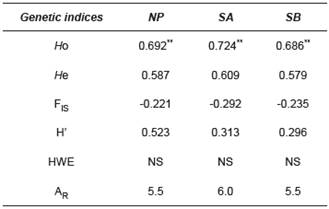
For microsatellite markers, there was no difference (p<0.01) between (Ho) and expected (He) heterozygosity among the populations. High heterozygosity rates in the three populations (SA: average 0.724; SB: 0.686; NP: 0.692) and nonsignificant HWE revealed an adequate intrapopulation genetic variability. The Shannon Index showed a similar trend of high genetic diversity within populations, with the highest diversity observed in NP (0.523). After Bonferroni correction, allele richness (AR) was similar among the groups: 5.5 for NP and SB, and 6 for SA. Negative rates of the inbreeding coefficient (F IS) were found in the three populations (Table 3).
Table 3 Statistics of four microsatellite loci used for B. orbignyanus populations.

NP: natural population; SA: Stock A; SB: Stock B; HO: observed heterozygosity; HE: expected heterozygosity; FIS: Fixation Index; H’: Shannon Index; HWE: Hardy-Weinberg Equilibrium test; NA: number of alleles per locus; AR: allele richness; NS: not significant; ** p<0.01 after Bonferroni correction (nominal α=0.05).
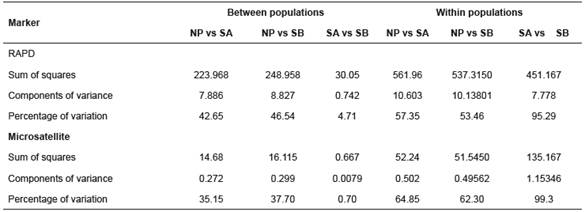
Table 4 Analysis of molecular variance (AMOVA) for three B. orbignyanus populations.

NP: natural population; SA: Stock A; SB: Stock B
AMOVA revealed the greatest proportion of genetic variation in the populations (average 68.7% for RAPD and 75.48% for microsatellites). For Stocks A and B, intrapopulation variation accounted for 95.29 and 99.3% of the total genetic variation for RAPD and microsatellites, respectively (Table 4).
The UPGMA dendrogram was constructed using Nei’s distance (Figure 1) based on the frequency and distribution of fragments and alleles. The distance and genetic identity, AMOVA, and FST and Nm values among the populations are given in Table 5.

Figure 1 Dendrogram of three B. orbignyanus populations: Natural population (NP); Stock A (SA); Stock B (SB).
Table 5 Summary of the statistics used for RAPD (Random Amplified Polymorphic DNA) and microsatellite data from three B. orbignyanus populations. 
FST: Fixation Index; Wright: Wright’s genetic differentiation (1978); GI: genetic identity; GD: genetic distance; Nm: number of migrants, NP: natural population; SA: Stock A; SB: Stock B.
Discussion
Thirty-eight out of 60 polymorphic fragments (RAPD) and 6 out of 17 alleles (microsatellites) were shared by the three populations. According to Caballero et al. (2010), allele richness characterizes the number of segregated alleles in a specific population. The present study revealed a homogeneous distribution of alleles among populations and confirmed allele sharing between stocks and natural populations. Further, the high observed and expected heterozygosity among populations is similar to those found by Lopera-Barrero et al. (2014) who detected high Ho rates, varying between 0.823 and 0.900, in B. orbignyanus. The number of alleles found in the present study is also similar to that reported by Lopera-Barrero et al. (2014). Our results suggest that the broodstocks that supply fish for the stocking program are managed appropriately, enhancing the maintenance of the number of specimens in natural populations and avoiding bottleneck effects that would cause allele loss, increase in genetic drift, and decrease in genetic variability.
Mean negative rates of the inbreeding coefficient (F IS) in the three populations demonstrated lack of inbreeding and confirmed the hypothesis that populations were not affected by a bottleneck effect. The high and homogeneous heterozygosity, coupled with the negative F IS values, indicate correct reproductive management that has reduced the occurrence of inbreeding and maintained high genetic variability in the stocks from fish culture stations.
The two molecular marker types showed similar genetic identity and genetic distance results. Although genetic identity values in broodstocks from fish culture stations were high, they were lower than the values for NP. Similarly, genetic distance was low between stocks A and B, but high between NP and stocks A and B, indicating low genetic similarity between NP and stocks A and B. The FST values also showed low genetic differentiation (0.047 and 0.007 for RAPD and microsatellites, respectively) between stocks from fish culture stations, and high differentiation between NP and stocks A and B. Estimations of the number of migrants (Nm) revealed low genic flow between the natural population and stocks A and B, and high genic flow between stocks from fish culture stations, for both marker types.
The dendrogram confirmed the formation of two genetic groups, one comprising the natural population and the other formed by the two stocks from the fish culture stations. In addition to describing the genetic composition and variability among populations, we have demonstrated that the two marker types showed similar results with regard to the genic structure of the groups, especially for genetic differentiation and similarity.
Utilizing microsatellite markers, Ashikaga et al. (2015) reported different levels of genetic variability in eight populations of B. orbignyanus from the Plata River basin (heterozygosity between 0.198 and 0.498). The authors reported that the analysis of molecular variance (AMOVA) and F ST (mean 0.258) revealed structuring in different subgroups: the subgroups from the best environmental conditions had the highest rates of genetic variability.
Employing RAPD markers, Panarari-Antunes et al. (2011) analyzed B. orbignyanus from natural populations and from fish culture stations of the Paraná River and discovered high genetic distance between groups. The authors emphasize that the difference may be due to the reproductive management in fish culture stations, which makes genetic difference even more evident. This also applies to the present analysis since the observed high genetic differentiation between fish station stocks and the natural population is mainly due to the common origin of broodstocks in fish stations and the mating succession enhanced by the stocking program. In view of this, the fish culture station stocks should not be used to repopulate the natural population, since the high genetic differentiation between them may negatively affect the local genetic diversity, decrease adaptive fitness, and increase competition with native fish. In a study developed by Coimbra et al. (2017) with natural populations of Prochilodus argenteus and a stock from the restocking program in the São Francisco River, Brazil, a moderate genetic differentiation (FST) was observed between the natural populations and the restocking stock. Coimbra et al. (2017) also stressed the genetic risk of fingerling inclusion in any of the natural populations and they recommend a more frequent participation of fish from natural populations for broodstock supply (always based on genetic analysis), thus adding new genetic variation.
The molecular markers employed in the present study have provided efficient and satisfactory results. As RAPD markers are dominant, they do not identify heterozygotes, and highly dependent on PCR conditions (concentration of reagents and cycling times), which may limit its use. However, when RAPD markers are properly used they can provide excellent results for studying genetic variability in fish (Panarari-Antunes et al., 2011; Lopera-Barrero et al., 2016; Ribeiro et al., 2016). In contrast, microsatellites are co-dominant (they allow to identify heterozygotes) and have a high degree of polymorphism, allowing a more detailed analysis of the variation among populations. Our results demonstrate the importance of using both marker types together, since, even with different molecular features, the two markers gave very similar results.
Adequate genetic variability has been observed in the three populations, with genetic differentiation between the natural population and stocks from fish culture stations. Shared fragments among populations may suggest the presence of specimens derived from stocking programs in the natural environment. The two different molecular techniques gave similar results with regard to the genetic variability between groups.


