Introduction
Sugarcane cultivation has played an important role in the Brazilian economy and is expanding mainly in ethanol production. Due to this and the great concern about the impacts of cultivation and soil management practices for agricultural use, different studies are being carried out in relation to the sugarcane production systems, standing out among other sustainable alternatives, the use of mulch as ground cover (Silva-Olaya et al., 2013; Moitinho et al., 2013).
In planting systems where crop residues are deposited in the soil there is a significant increase in nitrogen (N) and carbon (C) levels in the surface layers, where carbon can accumulate in the soil up to five times more on average. When compared to conventional systems (Dendooven et al., 2012).
In addition, many reports prove the positive effects of no burning on straw, especially those related to fertility, aggregation, structure, biological activity, soil microbial diversity and reduction in greenhouse gas emissions (GHGs) (Carvalho et al., 2010; Rachid et al., 2012; Portela et al., 2018). In this context, the management system of raw sugar cane, with the maintenance of vegetable residue (straw) on the soil, has been pointed out as a mitigating measure of the greenhouse effect, contributing to the improvement of soil quality and consequently increasing the productive potential of culture. (Tavares et al., 2010; Portela et al., 2018).
Several attributes have been used in the qualification of management systems. For monitoring soil quality, there are indicators more sensitive to its use and management, such as carbon content and microbial activity that provide information on changes due to agricultural exploitation, being use as ecological indicators capable of presenting activity levels of microbial populations, estimate the decomposition potential of plant residues and evaluate the environmental and anthropogenic effects on soil microbiological communities (Alves et al., 2011; Evangelista et al., 2013).
According to Vasconcelos et al. (2010) and Barros et al. (2013), total organic carbon content improves soil aggregation and continuous deposition of organic waste becomes extremely important for soil structure. Although there are numerous researches on soil microbiological attributes (Alves et al., 2011; Capuani et al., 2012; Thorburn et al., 2012; Mazurana et al., 2013; Rossi et al., 2013) those focused on the use of sugarcane straw in the improvement of soil conditions in the Northeast and especially in Piauí are still scarce. In addition, there is a need for studies in the region related to the amount of waste that must be left in the soil to impact soil quality. Therefore, the present study aims to evaluate the microbiological attributes of a Plintossol cultivated with sugarcane on straw.
Material and methods
The experiment was carried out at Vale do Parnaíba Company Alcohol and Sugar Plant (COMVAP), located in União - PI (04 ° 51’09”S and 42 ° 53’10’’ W, altitude 52 m.a.s.l), in the northern region of the state of Piauí (Brazil).
The climate of the region corresponds to the Aw (rain tropical) type, according to the Koppen classification, with dry winters and rainy summers. Precipitation is concentrated between December and June (Figure 1).
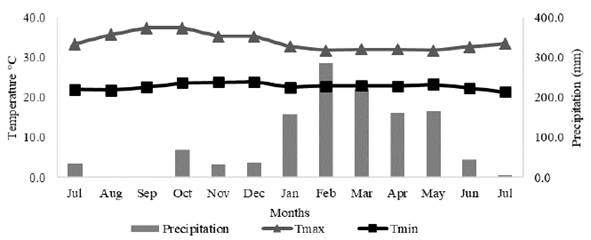
Figure 1 Rainfall and maximum and minimum temperature from July 2013 to July 2014. Data obtained from EMBRAPA Mid-North Meteorological Station, installed at Comvap Factory.
The average annual temperature is 28.4 ° C, however, during the year, there is a warmer period (September to December), with temperatures between 29 and 31 °C.
The soil of the study area was classified as a sandy texture clay loam soil (EMBRAPA, 2006). Soil particle size and chemical characteristics of the experimental area in the 0-40 cm layer are shown in Table 1.
Table 1 Granulometric and chemical characteristics of soil in the experimental area. Municipality of União-PI., Brazil.

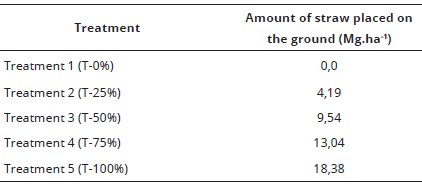
The experiment was installed in September 2009, repeated in 2010, 2011 and 2012. For this report the experiment was installed in July 2013, with a four years crop and third punch area, harvested without burning of sugarcane variety SP 81-3250. Plants were distributed 1.4 m between rows, where each experimental plot had dimensions of10 m wide and 15 m long, for a total of 150 m2, composed by 10 planting lines, with the floor area formed by the five central lines of each plot. For soil correction, 500 kg ha-1 of dolomitic limestone was applied. The fertilization used was 25, 150 and 75 kg ha-1 of N, P2O5 and K2O, respectively. After harvesting, 40 kg.ha-1 of N (urea) was applied. The trial was developed in a randomized block design with five treatments and four replications. Evaluated treatments consisted of five levels of straw. After harvesting all remaining straw within the experimental plots was weighed and placed in each plot according to the amounts determined for each treatment (Table 2).
Table 2 Amount of sugarcane straw deposited in the soil, according to the proportions of the test.
Soil samples were collected in the 0 to 10 cm layer per experimental plot and then placed in sterile bags and stored under refrigeration for further analysis.
Total organic carbon (TOC) was quantified by wet oxidation of organic matter using potassium dichromate solution (Yeomans and Bremner, 1988). Total nitrogen was quantified in soil samples submitted to sulfuric digestion and dosed by Kjedhal distillation (Bremner, 1996).
To determine soil density (Ds), undisturbed samples were collected following the volumetric ring method. The TOC stocks in depth were calculated from the expression: ESTC = (x TOC x and Ds), wherein the TOC is total organic carbon; Ds is the soil density at each depth and 10 cm layer. NT stocks in depth were calculated from the expression: EstNT = (Ds x and x NT), where NT is the total nitrogen content and Ds is soil density.
Soil microbial carbon (Cmic) was determined by the irradiation-extraction method (Islam and Weil, 1998). Respiratory activity of microbial biomass, or ground basal respiration, was determined by quantifying C-CO2 produced from 75 g of soil, incubated for seven days in a closed system (Alef and Nannipieri, 1995).
Microbial quotient (microbial biomass C/ organic C) (CBM C) (Sparling, 1992) and metabolic ratio (qCO2) was calculated as the relationship between the cumulative breath and microbial biomass C (Anderson and Domsch, 1989) and expressed as mg CO2 g-1 day-1 of Cmic.
The evaluations of the variables related to the attributes and considering the 0-10 cm layer, resulted in a data set that was submitted to the analysis of variance. Means were compared by the Tukey test using the SAS 9.0 statistical program. Soil microbiological variables, treatments and productivity data were submitted to multivariate analysis by cluster analysis using the mean distance between groups (Euclidean distance) method and principal component analysis (PCA) using the SAS 9.0 statistical program.
Results and discussion
Straw content in the soil provided a significant effect on TOC contents and C:N ratio (P < 0.01) (Figure 2). Highest TOC contents occurred with 13.04 Mg.ha-1 and 18.38 Mg.ha-1 of straw (Figure 2-A). These results corroborate with those observed by Leite et al. (2018) where an increase in organic carbon was related to the higher amounts of straw in the soil. Straw content also affected C:N ratio. Highest C:N ratio was attributed to 18.38 Mg.ha-1 of straw (Figure 2-B). Values obtained indicate that the mulch is not completely decomposed, since a decrease in C:N ratio is related to the consumption of mulch by soil microorganisms, releasing CO2. As sugarcane straw presents, on average, a C:N ratio of approximately 100, large immobilization of soil N is expected.
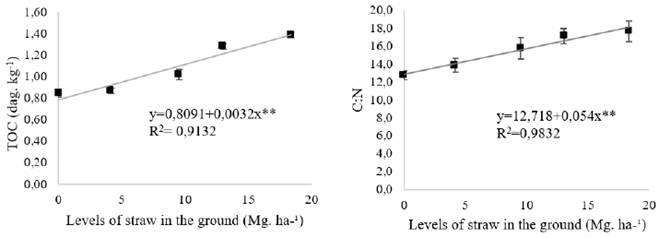
Figure 2 Total Organic Carbon (TOC) (Left) and C:N (Right) ratio of a Plintossol under sugarcane cultivation, after harvest without burning and different straw content in soil. Vertical bars indicate the standard error of the mean (n = 4). ** Significant at 1% probability.
Wendling et al. (2011) observed in areas of the Cerrado of Minas Gerais, Brazil, values for C:N ratio that ranged from 13.2 to 15.4 at 0-10 cm depth. According to the same authors, these values are considered low and may contribute to soil microbial activity and accelerated decomposition of material and incorporation to soil. Deposition of straw in soil promoted the increase of carbon stocks that presented higher values (P < 0.01) in the treatments with 13, 04 and 18.38 Mg. ha-1 of straw (Figure 3-A).
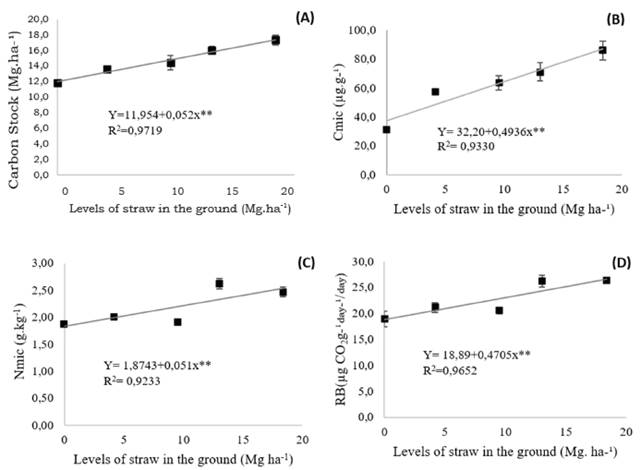
Figure 3 Carbon stocks (A), Carbon contents of microbial biomass (B), microbial biomass nitrogen (C) and respiration (D) of a Plintossol under sugarcane cultivation after harvest without burning and different straw content in soil. Vertical bars indicate the standard error of the mean (n = 4). ** significant at 1% probability.
Segnini et al. (2013) observed in the superficial layer of soil with deposition of 12 to 15 Mg.ha-1 of straw, values for C stocks that ranged between 13.3 and 13.9 Mg.ha-1 due to the higher input of plant residues and higher concentration of crop roots. Other authors report that the deposition of sugarcane straw on the soil surface gradually increases carbon stocks over time (Thorburn et al., 2012; Rossi et al., 2013).
Microbial biomass carbon with 18.38 Mg. ha-1 of straw outperformed treatments with 0, 4.19 and 9.54 Mg.ha-1 of straw (P < 0.01), and matched with 13.04 Mg.ha-1 of straw (Figure 3-B). The highest Cmic values in this proportion indicate a favourable condition for microorganisms activity in soil, attributed to a higher deposition of mulch in soil. Considering that mulching provides greater soil coverage, favouring fewer variations in temperature and humidity ranges, as well as províding greater amount of organic substrate for decomposition and mineralization, which may influence the activity and microbial biomass. Morais et al. (2019) observed similar results and reinforced the idea that the total removal of straw from the soil reduces microbial activity.
There was a greater amount of N immobilized in microbial biomass 13.04 and 18.38 Mg.ha-1 of straw (P < 0.01) (Figure 3-C). These results contradict those reported by Meier et al. (2006), who did not observe differences between the microbial biomass nitrogen of sugarcane straw and non-straw in soil.
A research by Santos et al. (2004) found that lower soil mobilization and adoption of a conservation management system provides similar microbial biomass to natural soils in the form of microbial nitrogen.
For microbial respiration, it was observed that treatments with 13.04 Mg.ha-1 and 18.38 Mg.ha-1 of straw had higher values in relation to other treatments (P <0.01) (Figure 3-D). This indicator of a greater soil microbiological activity responds to a higher amount of straw deposited. Cmic/ TOC ratio values in all treatments and depths were low and presented significant differences among them (P < 0.01), showing an increasing trend (Figure 4-A). For the metabolic quotient, there was an effect of soil straw levels, showing a decreasing trend (Figure 4-B).
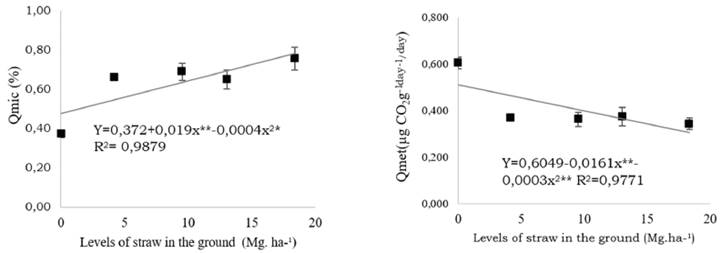
Figure 4 Microbial quotient (Qmic) (Left) and metabolic quotient (Qmet) (Right) of a Plintossol under sugarcane cultivation after harvest without burning and different straw content in soil. Vertical bars indicate the standard error of the mean (n = 4). ** significant at 1% probability. * significant at 5% probability.
Treatment with 0 Mg.ha-1 of straw resulted in the lowest microbial quotient compared to other treatments that did not present differences. Observed ratios of microbial quotients were below those obtained by Jenkinson and Ladd (1981) at a range between 1% and 4%. The low values found in this test indicate that even after 4 years covered with sugarcane straw, this condition was probably not sufficient to alleviate the stress situation of soil microbiota, which causes lower population efficiency in immobilizing carbon.
It may also indicate poor nutritional quality of organic matter, disabling microbial biomass from utilizing organic carbon.
When the respiration per unit of microbial carbon is considered, the greatest activity occurs in the treatment without straw in soil. Increasing straw content in the soil decreases CO2 production per unit of carbon of microbial biomass. This higher value of metabolic quotient without straw in soil indicates that the condition of food stress causes organisms to consume more substrates, expending more energy to maintain the microbial community (Carneiro et al., 2008; Mazurana et al., 2013). Given the selected variables to distinguish treatments, a cluster analysis was performed to assess variation of Euclidean distance values between treatments (Figure 5).
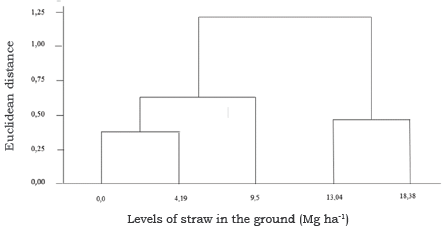
Figure 5 Dendrogram resulting from cluster analysis by average Euclidean distance, showing group formation according to soil variables at 0-10 cm depth and yield.
An Euclidean distance of 0.5 favoured the division into groups, indicating that using the variables mentioned above it is possible to sort the data into three distinct groups: the group formed by treatment 0 and 4.19 Mg.ha-1 of straw in the soil, the group formed by treatment 9.54 Mg.ha-1 of straw in the soil and the group formed by the treatments 13.04 and 18.38 Mg.ha-1 of straw in the soil.
Differentiation shows similar soil characteristics of the treatments belonging to the same group and differ from the behaviour of the variables of other groups, that is, treatments with soil under different straw content form distinct groups with changes in soil characteristics from group to group. Freitas et al. (2014b) evaluating soil attributes, with different textures, in sugarcane planting areas, with filter cake incorporated into the soil, submitted data to cluster analysis and found the division into three distinct groups, indicating the similarity of soil characteristics independent of soil texture.
The difference among groups results in differences observed in the attributes evaluated in this experiment. Thus, the close proximity among the groups can be evidence in the principal component analysis, which confirms the cluster analysis for the studied treatments.
Variables correlation (Table 3) allowed a characterization to discrimínate the effect of straw content in soil. The eigenvalues obtained from the covariance matrix, with values greater than one, confirm the cluster analysis for the studied treatments. Thus, the first and second principal components can be used to explain at least 70% of the total variance, considering that only these presented values greater than one (8.90 for PC1 and 1.21 for PC2).
Table 3 Correlation between each main component and the soil attributes analysed in the 0-10 cm layer.
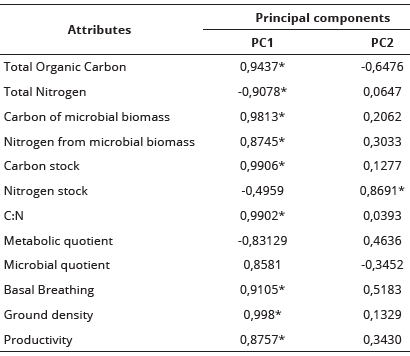
* Discriminatory values.
The first two principal components account for 92.01% of the total variance, being 80.94% in the PC1 and 11.07% in the PC2, with reduced dimensionality of original variables and loss of explanation less than 10%. Oliveira et al. (2015) evaluating soils of sugarcane, cassava, pasture, forest and archaeological black earth found 73.51% of data variability explained by three main components.
The first principal component was represented by positive eigenvectors. Influence of most variables on the axis of PC1 was observed. The influence of nitrogen levels and metabolic quotients on the PC1 axis was found to be negative.
In the second main component, most of the positive eigenvectors were observed, highlighting the influence of the total nitrogen stock on the PC2 axis and the negative eigenvectors highlight the total organic carbon content.
It was observed that the treatment 0 Mg.ha-1 of straw formed a group with the treatment 4.14 Mg.ha-1 of straw and was positioned in the upper left quadrant, that is, opposite to the arrangement of the variables assessed (Figure 6). The variables that most correlates with this group were metabolic quotient, total nitrogen content and nitrogen stock.
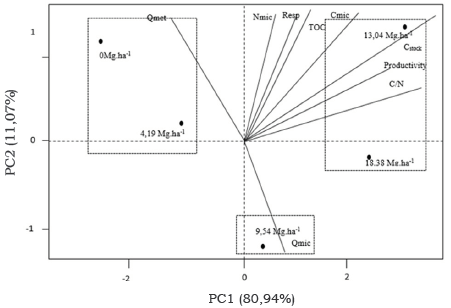
Figure 6 Principal component analysis (PCA) based on soil variables at different treatments: 0, 4.19, 9.54, 13.04 E 18.38 Mg. ha-1 of remaining mulch in the 0-10cm layer.
The second isolated group is related to 9.54 Mg.ha-1 of straw, located at the lower left quadrant and shows the best correlation with the microbial quotient ratio variables. Third group, consisting of 13.04 Mg.ha-1 and 18.38 Mg.ha-1 of straw was positioned in the upper and lower right quadrants and associated with most soil attributes and stalk yield in Mg.ha-1. This group was more correlated to most of the studied variables due to the higher contribution of vegetal residue deposited in the treatments. Freitas et al. (2014a), evaluating managed areas, one of them with sugarcane and comparing with native forest areas, observed a greater relationship of biological variables with areas where there was no anthropic interference and action of agricultural machinery, associated with the input of waste vegetables.
Multivariate analysis allows us to identify the variables that most correlated with each type of treatment and the effects on the change in soil characteristics, indicating the amount of mulch that remains in soil that promotes soil quality.
Paredes Jr., Portilho and Mercante (2015) observed similar results and linked the increase in carbon from microbial biomass in systems where there is no intervention in the soil, that is, the soil is protected, improving microbial development conditions. For Morais et al. (2019) soil microorganisms are sensitive indicators for assessing soil changes induced by the management of cultural residues and must be taken into account when defining the proper management of sugarcane straw for sustainable production.
Conclusions
At a depth of 0-10 cm, increase of straw in the soil influences soil microbiological attributes: using 9.54 Mg.ha-1 of straw in the soil, only the microbial quotient is beneficially influence; the presence of 13.04 and 18.38 t.ha-1 of straw in the soil has a better correlation with most of the evaluated attributes, attributing the improvement of the quality of the soil covered with these levels of sugarcane straw, and the recommended use these levels of straw in the soil; the presence of 13.04 Mg.ha-1 provides the best productivity of sugarcane on straw, and this ratio is recommend.


