1. Introduction
Wastewater generated in tannery industry is one of the most polluting effluents due to the presence of large amounts of heavy metals (chromium), chloride, ammonia, and organic substances 1)(2. Conventional wastewater treatments have been used to treat tannery effluents, based on physical-chemical treatments; however, these strategies cause an important increase in the cost of the treatment 3.
In recent years, sequencing batch reactors (SBR) have shown good removal efficiencies for nitrogen and organic carbon contained in industrial wastewater with inhibiting substances 4. SBR also provides the advantage that nitrogen removal can be carried out in a single reactor by maintaining anoxic and aerobic stages sequentially 5)(6. Furthermore, it is considered that biomass is better selected and enriched in the SBR than in a continuous reactor, due to the cyclic concentration gradients to which biomass is exposed 3.
Monitoring the biological nutrient removal from wastewaters has been considered difficult due to the lack of available control parameters. Analytical determinations of BOD, COD, total nitrogen, phosphorus are time-consuming and costly 7. However, these nutrient concentrations are related to pH, dissolved oxygen (DO) and Redox potential (ORP) profiles. These can be used to identify specific control points during the SBR cycle. Therefore, the inflexion in pH, DO and ORP - profiles can be used as on-line monitoring and control parameters for biological nutrient removal processes 8)(10.
Tannery wastewater contains an important amount of colloidal and/or biorefractory organic matter and nitrogen 11)(14. Many of these compounds are resistant to biological degradation and/or can inhibit the activity of the biomass in treatment plants. To remove these pollutants, it is necessary to apply at least a physical-chemical treatment as a polishing step after a biological treatment 1)(15)(16. The coagulation-flocculation process is one of the most frequently used treatments for tannery wastewater, but it is usually applied as pretreatment 14)(17)(18. However, Dosta et al. 19 recommended the use of physicochemical processes following the biological treatment to optimize the amount of coagulant required.
The most widely used coagulant agents for tannery wastewaters are aluminum and iron salts. Song et al. 17 demonstrated that ferric chloride removed more COD, SS and color than aluminum sulfate. Furthermore, some researchers aimed to evaluate the effects of coagulants obtained from natural sources and agro-industrial byproducts such as Ryu et al. 14 who demonstrated that seawater, used as a coagulant in the pretreatment of tannery wastewater, could remove 75% of COD. Likewise, Román 20 successfully used brine as a coagulant for domestic wastewater treatment. The brine is an agro-industrial waste generated in obtaining salt by solar evaporation. It is characterized by being rich in magnesium sulfate and potassium chloride, which are important agents during coagulation-flocculation process.
Based on these concepts, the aim of this investigation was to evaluate the biological treatment of tannery wastewater in a SBR to remove organic matter and nitrogen by pre-denitrification. Since an important fraction of the COD coming from the SBR is non-biodegradable, a coagulation-flocculation process was implemented to remove colloidal and/or refractory COD present in tannery wastewater. Finally, the effectiveness of ORP, pH and DO profiles as control parameters for monitoring the evolution of biological nutrient removal during the SBR cycle was investigated.
2. Experimental study
2.1. Raw wastewater
The industrial influent was collected from a tannery located in the city of Barquisimeto, Venezuela. Wastewaters from the different processing phases of leather production (liming, tanning with chromium and dyeing - degreasing) were mixed, settled and stored in balancing ponds, located in the same industry. The pond acted as a pre-treatment of the wastewater for the amendment of total solids and precipitation of chromium (due low solubility of the metal at pH of the effluent). The pre-treated wastewater was used as feed to the SBR. The average physicochemical composition of tannery wastewater is shown in Table 1.
2.2. Integrated wastewater treatment system
The tannery wastewater experimental system was integrated by the combination of two processes (biological and physicochemical treatments) and the system was operated during 90 days to remove the organic matter and nitrogen from the wastewater. The purpose of this combination was to generate an effluent which meets the discharge limits established in the Venezuelan environmental regulations.
Sequencing Batch Reactor (SBR)
The SBR reactor was a glass-made cylinder (26 cm height and 14.5 cm diameter), with 2 L effective volume. The reactor had three openings: one for feeding raw wastewater, another for emptying the reactor, and the last one for sludge withdrawal. Peristaltic pumps were used for the processes of filling and withdrawal (Easy Load II, Masterflex L/S, Cole Parmer, USA). Aeration was supplied through an air compressor (Elite 801, Hagen inc, China). It provided airflow of 2,500 cm3·min-1 through a fine bubble diffuser located at the base of the reactor. The reactor contents were mixed by means of a stirrer whose speed was maintained between 100 to 150 rpm using an inverter (Powerstat 3PN116C, The Superior Electric CO, USA). The temperature of the wastewater in the reactor was the same as laboratory temperature, it was ranged between 25.1 and 25.6 ºC in the range of 25.1 to 25.6 ºC. The system was automated by digital timers (Thomas Scientific, USA). The principle diagram of the biological system with all major components is shown in Figure 1.
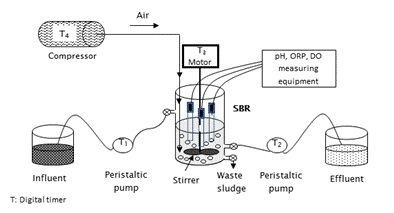
Figure 1 Schematic diagram of the biological system (SBR) with on-line measurement of pH, ORP and DO
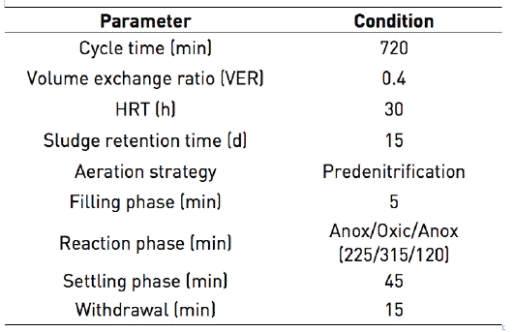
SBR worked by predenitrification strategy since many researchers have shown its effectiveness to remove nitrogen from tannery and slaughterhouse wastewaters 3)(4)(21)(22. The main phases in the SBR were anoxic filling, reaction phase (anoxic - oxic - anoxic), settling and decanting, no external carbon source was added. The duration of the different phases were controlled by time switches (Table 2). In each cycle, 800 mL of wastewater was fed to the reactor so that the volumetric exchange ratio in the reactor was 40%.
To begin the biological process, the SBR was seeded with biomass from the aeration tank of a tannery treatment plant (located in the city of Yaritagua, Venezuela), which employed a continuous flow suspended growth configuration. The biomass was acclimated to the wastewater characteristic and SBR conditions for a period of 40 days. After the acclimation period, the biomass exhibited stable nitrification (>70%) and good settling characteristics (<30 min), which is an important requirement for SBR process 23.
Physicochemical post-treatment
Post-treatment consisted of coagulation/flocculation tests performed in a Jar-Test device. During the investigation, a mix of reagents was used: Ferric chloride hexahydrate (FeCl3·6H20), as a coagulant (Fluka Chemicals, UK) and an agro-industrial waste (sour brine), as adjuvant (Table 3). Adjuvant was obtained from a company dedicated to produce salt by sun evaporation (Maracaibo, Venezuela). Characteristics of coagulant and adjuvant as color (2120-C), turbidity (2130 B), calcium (3500-Ca-B), magnesium (2340-C and 3500-Mg-B) and chloride (4500-Cl--D) were measured following the procedures of Standard Methods 24.
Concentration and doses of ferric chloride and sour brine were: 2.7 g·L-1 (60 mL·L-1) and 100 g·L-1 (5 mL·L-1), respectively 25)(26. The pH of the wastewater treated biologically was adjusted to 11.5 using NaOH 6N 26. The Jar-Test proceeded with the following steps and temporization: vigorous mixing (100 rpm, 5 min), low mixing (30 rpm, 60 min) and settle (30 min). Both coagulant and adjuvant agents were added at the beginning of the vigorous mixing.
Evaluation of the integrated wastewater treatment
The effectiveness of the biological and physic-chemical treatments was evaluated by the efficiency of removal of chemical oxygen demand (COD), total Kjeldahl nitrogen (TKN), ammonia (N-NH4 +), nitrites (N-NO2 -), nitrates (N-NO3 -) and total chromium in accordance with Standards Methods 24.
Over the entire working period of the reactor, the pH (Orion 3 Star Series), ORP (Sper Scientific 850088) and DO (Thermo Orion 862A) were continuously monitored by electrodes submerged in the mix liquor (Figure 1). Nutrient concentration (N-NH4 +, N-NO2 -, N-NO3 -) and alkalinity were measured every hour during the SBR cycle 24, while online data were taken each 5 min. ORP, DO and pH were measured during SBR evaluation to determine a correlation between them and the nitrification/denitrification processes.
Twelve samples were taken during the evaluation of integrated system (SBR + Coagulation-flocculation). The sampling frequency was established in a weekly basis for SBR, on-line measurements and post-treatment. The efficiency of removal of COD, total nitrogen and chromium in the integrated system was reported by means of central tendency and dispersion. The final contaminant concentrations were compared with Venezuelan environmental regulations to determine whether they reached the limits for discharge into water bodies 27.
2.3. Microbiological analysis
Determination of nitrifying and denitrifying bacteria
Samples were taken hourly during the SBR cycle to determine the population density of nitrifying and denitrifying bacteria present in the reactor. For sowing, the most probable number technique (MPN) was utilized, using a selective medium for each group of bacteria. Ammonium and nitrate broth (Fluka Analytical) were used for nitrifying and denitrifying bacteria, respectively, in accordance with Standard Methods 24. Serial dilutions were made of the sample to 10−3, where each dilution was seeded in triplicate in tubes. All inoculated tubes were incubated at 30°C for a period of 21 days. Then colorimetric assays were performed for each medium following the procedure proposed by Rodríguez et al. 28. Finally, the number of positive tubes at each dilution was counted, and then the most probable numbers of nitrifying and denitrifying bacteria in the environment were determined using the table for three tubes 29.
3. Results and discussion
The integrated system for the treatment of tannery wastewater operated continuously for 90 days. The system reached pseudo-stable condition approximately at day 20 of the beginning of the experiment. The SBR system operated according to anoxic-aerobic-anoxic principles. Predenitrification was the most efficient strategy for simultaneous removal of nitrogen and organic matter from tannery wastewater 2)(26. Additional anoxic phase was included to improve nitrogen removal; no external carbon source was needed.
3.1. Efficiency of COD removal
After acclimatation process, total COD (tCOD) of the raw wastewater showed variable behavior during the investigation (Figure 2). The variation went from 1,296 to 1,796 mg·L-1, although tCOD removal efficiencies in the SBR were relatively constant (52.8 ( 2.5 %). This efficiency was slightly lower than total biodegradable COD of the raw wastewater (57.4%); however, the performance of the biological treatment in the SBR was adequate (92.0% of biodegradable fraction). These results agree with those obtained by other researchers who reported COD removals from 80 to 95% when using a SBR to treat tannery effluents 11)(14)(30)(31.
Average COD concentration at the end of the biological treatment was 674.0 mg·L-1 ranging between 583.9 and 764.0 mg·L-1. This COD remaining was higher by approximately 50% of the discharge limit permitted in Venezuelan environmental regulations 27, and therefore, must be removed by other non-biological methods 1)(15)(19).
The final COD concentration consisted in 123.7 mg·L-1 of biodegradable COD that could not be removed by the SBR. According to the COD fractionation reported in a previous investigation 26, 29% of tCOD of the raw wastewater corresponds to soluble non-biodegradable material (448.3 mg·L-1) and 5.9% was generated as a product of cellular metabolism (91.2 mg·L-1). Then approximately 539.5 mg·L-1 of the final COD was inert and remains in the wastewater after biological treatment.
The COD mass balance showed good agreement between the estimated COD (663.2 mg·L-1) obtained from fractioning the raw wastewater (non-biodegradable COD + remaining biological COD), and the final average COD obtained experimentally (674 mg·L-1).
The highest content of COD in the effluent of the SBR corresponded to non-biodegradable material (81.3%). To remove this COD it was necessary to apply an additional treatment. Dosta et al. 19 showed that a coagulation-flocculation process, used as a post-treatment, was responsible for removing the portion of the remaining or non-biodegradable COD and nitrogen present in the supernatant of anaerobically digested piggery wastewater. Thus, the amount of chemicals required during post-treatment was reduced, since the coagulant was added based on the concentration of colloidal contaminants remaining in the biological process. Based on this experience, after the combination of biological and physicochemical treatments, it is expected that the tannery effluent meets the Venezuelan environmental laws which regulate that the discharge of COD to water bodies should not exceed 350 mg·L-127.
Results of the tertiary treatment showed the efficiency of the coagulation-flocculation process during COD removal (Figure 3). At the beginning, the average COD removal efficiency was 52.7% and the final COD concentration varied from 270.0 to 373.8 mg·L-1. After 35 days of operation of the combined treatment, the system efficiency was improved slightly to 53.6% and the final concentrations measured were between 270.0 and 336.8 mg COD·L-1, complying with the permitted limit in Venezuela for discharge in water bodies 27.
3.2. Efficiency of nitrogen removal
Nitrogen transformation by nitrification of N-NH4 + was adequate during biological treatment; however, a fraction of organic nitrogen still remained in the effluent of the SBR. The concentration of N-NH4 + at the end of SBR cycle varied from 2.8 to 5.6 mg·L-1, meanwhile TKN concentration ranged between 35.0 and 67.7 mg·L-1.This results imply that the nitrification process in the SBR was almost complete (97.4 ( 5.7 %) and TKN removal was 70.8 ( 6.8 % (Figure 4).
Cycles evaluated in the SBR showed the efficiency of the biological system for nitrification, but showed its inefficiency to perform the ammonification of the organic nitrogen present in tannery wastewater. This probably corresponds to recalcitrant or non-biodegradable nitrogen that could not be hydrolyzed 32. In this regard, Boursier et al. 33 and Insel et al. 12 reported that the organic nitrogen present in industrial effluents from slaughterhouses and tanneries was in the particulate form of organic complex polymers and are probably not nitrificable, severely limiting the process of ammonification.
The low organic nitrogen transformation is related to the results obtained by Insel et al. 12 who determined that the limiting step in the removal of nitrogen in tannery effluent is the ammonification. They reported residual organic nitrogen concentration between 12 and 25 mg·L-1, which is lower than that found in the present study (56.9 mgNorg·L-1). Ammonification is recognized as a specific feature of the tannery effluents due to the high content of organic nitrogen present in proteins 12)(18)(34. Thus, the low rate of ammonification was considered one of the main reasons that impeded a higher total nitrogen removal from the tannery effluent in the SBR.
With respect to the oxidized forms of ammonium, nitrites and nitrates (N-NOx -), a remaining concentration of 17.2 ± 6.9 mg N-NOx -·L-1 was obtained after the biological treatment. This result shows the capacity of the biological system to denitrify N-NOx -. Good correspondence between the production of N-NOx - (nitrification) and the removal of N-NOx - (denitrification) during the SBR cycle was observed. These results confirmed that the predenitrification strategy with a short filling period was a good selection for the tannery wastewater treatment due to the fact that the readily biodegradable COD present in raw wastewater was not consumed during the filling time. Instead, it was used as an organic carbon source during anoxic phases, thus improving the denitrification process 2)(21.
During the evaluation of the SBR performance, a decrease in removal efficiency of N-NH4 + and TKN was observed at day 35 of the reactor operation (Figure 4), due to the increment in nitrogen concentration in the raw tannery wastewater. Ammonia concentration increased from 93.0 to 149.3 mg·L-1 and the TKN from 185.5 to 213.5 mg·L-1, attributable to changes in operating conditions in the tannery processes. In response to these increments, the system removal efficiencies decreased suddenly (Figure 4). However, a recovery of the biological process was observed from day 41 of the treatment; although it was not until day 49 of the SBR operation when the nitrogen removal efficiencies were stable again (96.3 and 71.8% for N-NH4 + and TKN, respectively).
At the end of the biological treatment, the concentration of organic nitrogen, obtained by subtraction of NTK and N-NH4 +, showed small variation between the influent and effluent of the SBR (64.4 ( 14.6 and 56.9 ( 12.8 mg·L-1). The concentration of N-NH4 + (4.2 mg·L-1) was minimum as compared to the content of organic nitrogen. Based on that, it was necessary to apply a post-treatment in order to remove the remaining organic nitrogen and to regulate N-NOx - concentration, which was slightly higher than the limit established in Venezuelan laws for discharging in bodies of water (≤10 mg N-NOx -·L-1).
The evaluation of the tertiary treatment showed that the effluent generated from the coagulation-flocculation treatment had 23.4 mg TKN·L-1 (22.9 mg Norg·L-1 and 0.5 mg N-NH4 +·L-1), representing a removal efficiency of 62.4 ( 5.7% of TKN (Figure 5). These results demonstrated that the effluent from the SBR contained a significant fraction of refractory and/or slow biodegradable COD that just could be removed by the combination of the coagulant and adjuvant used in this investigation. Besides, N-NOx - concentration decreased slightly to 11.7 mg·L-1.
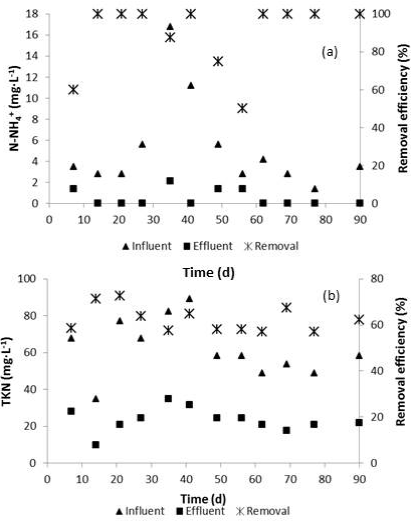
Figure 5 N-NH4 + (a) and TKN (b) behavior during the physicochemical postreatment of tannery wastewater
Finally, the effluent of the integrated system (biological + physicochemical treatments) had a final total nitrogen concentration of 35.1 mg·L-1, being less than 40 mg·L-1 which is the maximum concentration permitted by Venezuelan laws 27. It was demonstrated that the limiting step to remove nitrogen during biological treatment was ammonification, but the remained organic nitrogen was removed during the ulterior physicochemical treatment.
3.3. pH, ORP and DO profiles and their relation with biological nitrogen removal
Typical pH, DO, ORP and nitrogen profiles were analyzed using the data obtained at day 77 of the SBR operation (Figure 6). Anoxic condition was achieved during the first phase in the SBR cycle with average DO concentration of 0.15 mg·L-1 accompanied by a decrease in the N-NOx- concentration. This behavior evidenced that denitrification had occurred. Besides, Akin and Ugurlu 10 indicated that the mobility of the N-NOx - depends on the ORP during the anoxic phase, therefore, the breaking point in the ORP profile (“nitrate knee”) corresponded to the lowest concentration of N-NOx - (14.5 mg·L-1). At the same time, the end of the denitrification process was also related with an inflexion in pH profile (Figure 6(b)).
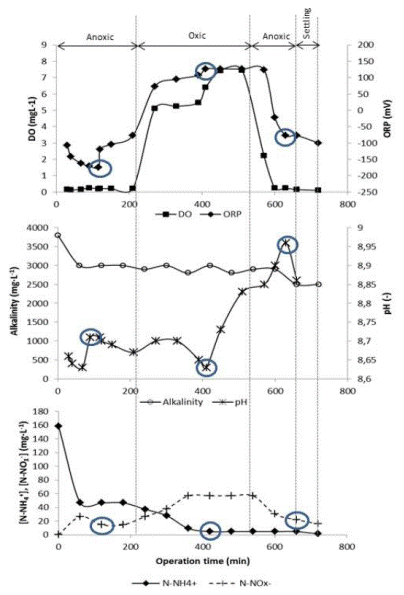
Figure 6 Typical dynamics of N-NH4 + and N-NOx - concentrations and online monitoring parameters in SBR (day 77 of SBR operation). (a) OD and ORP profiles, (b) alcalinity and pH profiles and (c) N-NH4 + and NOx - profiles. ○ Circles show profile inflexions
“Nitrate knee” was reached at minute 116 of the SBR cycle and the minimum concentration of N-NOx - was at minute 120 (Figure 6). It was considered there was a good correspondence with the minimum redox potential recorded (-174 mV), pH inflexion and the minimum concentration of N-NOx - (14.5 mg·L-1). At that time, it was considered that the denitrification process was over. During the remainder of the first anoxic phase, further decrease in the concentration of N-NOx - or any other inflexion in the DO or ORP profile was not observed. Carrasquero et al. 8, Abualhail et al. 9 and Antileo et al. 35 found a similar behavior in pH and ORP profiles while monitoring nutrient removal in different types of wastewaters and conclude that these profiles are somehow related with the dynamic of nutrient concentration in the SBR.
The differences between the times of appearance of inflexions and minimum concentration of contaminants are related to the sampling frequencies. In some cases, experimental determination could not be done at the same time when the inflexion profile was measured on-line, due to the tedious and time consuming experimental analysis 7.
After the anoxic phase, the aerobic period started at minute 226 of the SBR cycle. Dissolved oxygen concentration was gradually increased from 0.22 to 7.46 mg·L-1 at the end of this phase (Figure 6 (a)). The system was aerated in excess during the aerobic phase; however, Rodríguez et al. 28 reported highest nitrification efficiency when DO was increased in the biological system. Additionally, the small volume of the reactor and the use of a fine bubble diffuser helped to keep DO at high concentrations. In parallel, the minimum N-NH4 + was observed around minute 410 of the cycle (≈4.7 mg N-NH4 +·L-1). This concentration corresponded with three inflexions in the profiles. One of them was in the ORP profile at the maximum value of 127 mV, the second was an inflexion in pH profile (ammonium valley) at pH of 8.63 and finally it was observed that DO entered in a plateau period at 420 min indicating the rate of oxygen consumption was less than oxygen supply rate. At this point, ammonium concentration remained constant and any further inflexion was observed in the profiles for the rest of the aerobic phase, indicating that nitrification process was completed 9.
Good correspondence was found between the end of nitrification and the inflexions in the pH and ORP profiles for all the cycles evaluated during the SBR performance. Measurement of pH and ORP must be evaluated together to define the progress and the finalization of the oxidation of N-NH4 +. Tannery wastewater has some contaminants, like sulfurs, that could suffer oxidation and produce additional inflexions in the ORP profile. To guarantee the correct determination of the end of nitrification process, it is essential to verify the simultaneous occurrence of the two breaking points in both profiles.
Abualhail et al. 9 and Antileo et al. 35 found that pH and DO profiles can be used to indicate the end of nitrification. However, ORP value is mainly dependent on the DO concentration. It is reported that the ORP value is correlated with the logarithm of the DO concentration in a linear relationship 36. In this investigation, the ORP profile gave a better signal of the end of ammonia oxidation than DO, then ORP was considered an accurate indicator for nitrification progress; besides, when the maximum potential was reached in the aerobic phase no additional oxidation N-NH4 + occurred.
Therefore, ORP profile can be used as a strategy to monitor the progress of the nitrification process and even estimate the achieved percentage of ammonia removal. In the present investigation, it was observed that redox potentials above 100 mV ensured high nitrification efficiency (≥97.0%), while lower potentials represented incomplete nitrification. Similar results were reported by Akin and Ugurlu 10, who using another on-line measurement, noted that breaking point in the pH profile during the aerobic phase always represented about 80% of removal efficiencies of N-NH4 +.
During the evaluation of SBR, low redox potential (36 mV) were recorded during day 35 of the SBR operation. This was a clear indicator that there could have been a problem with the biological process or some changes could have happened in the composition of the wastewater. This alteration in ORP profile corresponded to the sudden increase in the concentration of nitrogen in the tannery wastewater (Figure 4), and it was due to changes in the production process at the industry. These results confirm that ORP is an appropriate indicator of nitrification progress in the system.
Continuing the analysis of the monitoring of SBR on day 77, it was observed an accumulation of N-NOx- (57.0 mg·L-1) as a product of nitrification process at the end of aerobic phase (Figure 6(c)). This concentration decreased during the second anoxic phase until 16.2 mg·L-1 and corresponded to an inflexion in pH profile, although a breaking point in ORP profile was not observed (Figure 6(b)). Nitrate “knee” was not well defined; for that reason, the most negative ORP (-77.3 mV) was used as a reference of the end of denitrification. Similar results were obtained by Yu et al. 37 who noted that the duration of the phases (aerobic and anoxic) were not the most appropriate. According to this behavior, it should be determined in future research if the cause of a lack of ORP breakpoint in the second anoxic phase is related to the fact that the N-NOx - was not completely consumed.
During the entire monitoring of SBR performance, the breaking point in the pH profile was observed by the pH increase due to the higher alkalinity production during denitrification process 6, but in other cases, the inflexion in the pH was obtained by the decrease in the profile due to the nitrification process, after that an increase of pH profile was observed due to the completion of nitrification 10. At the same time, dissolved oxygen profile was performed to verify aerobic or anoxic conditions during SBR cycle. This profile was a complement for ORP and pH profiles during the process control in the aerobic phase.
Finally, profiles of ORP, DO and pH were efficient ways to monitor the evolution of biological nutrient removal. They could be implemented as a real-time control for optimization of the SBR operation, because length of each phase in the reactor could be adjusted to the time when inflexions in the profiles occur. In this regard, Antileo et al. 35 found that real-time control instead of fixed-time control strategies can be used to optimize energy consumption during biological wastewater treatment.
3.4. Microbiological analysis
The results of on-line and physicochemical measurements were supplemented by basic microbiological analysis, which determined the bacterial density of nitrifying and denitrifying microorganisms present in the mixed liquor (Figure 7). It was determined that nitrifying microorganism density was larger than denitrifiying bacteria density; therefore, the efficiency of nitrification was higher than that of the denitrification process during the biological treatment of tannery wastewater. The minimum percentage of oxidation of N-NH4 + was 80% and the removal of N-NOx - by denitrification ranged between 66.7 and 70.9% during the anoxic phases (Figure 7). In this regard, Rodríguez et al. 28 noted when the biomass has higher nitrifying population, the oxidation process occurs faster, is more efficient and does not normally accumulate intermediates compounds such as nitrite.
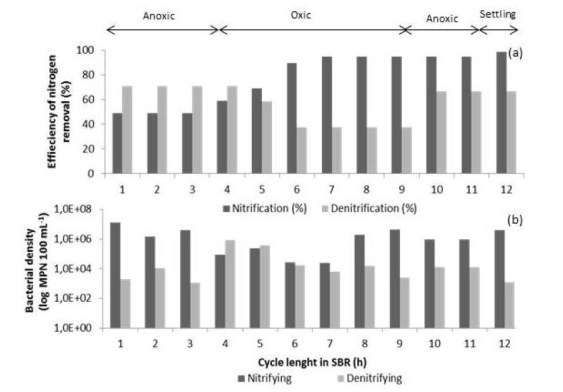
Figure 7 Nitrification and denitrification efficiencies (a) and density of nitrifying and denitrifying bacteria (b) during a typical SBR cycle (day 77)
The presence of nitrifying microorganisms tended to increase its density during the aerobic phase of the biological treatment. Eight hours after the cycle began, nitrification removal efficiencies reached the highest value (94.9%) and the maximum bacterial density was registered between hours 8 and 9 of the cycle. On the other hand, there was an increase in the population of denitrifying at the end of the first anoxic phase. This behavior was similar to that described by Rodríguez et al. 28, who concluded that the maximum density of nitrifying and denitrifying was observed at the time when ammonium and organic matter removals were the highest.
It is important to mention that the decrease in N-NH4 + concentration was observed during the aerobic and anoxic phases. This suggests the presence of heterotrophic microorganisms in the SBR biomass, which could simultaneously perform nitrification and denitrification processes 38.
4. Conclusions
The integrated treatment system which combined biological and physicochemical physicochemical processes for the treatment of tannery wastewater has been proved to be an efficient alternative to remove COD and TN.
The system was able to produce an effluent which met the COD and total nitrogen limits established in the venezuelan legal regulations for discharge into water bodies. Global COD and TN reduction was around 80 and 82%, respectively.
Finally, profiles of ORP, DO and pH could be related with nitrification and denitrification processes, then these profiles were efficient ways to monitor the evolution of biological nutrient removal, and real-time control can be implemented for optimization of the SBR operation.


