I. Introduction
The concentration of fruit juices is widely used to preserve this feedstock type, reducing transportation and storage costs. Thermal evaporation is the most applied concentration processes on an industrial scale; however, its negative effects on nutritional and sensory quality on raw materials, and the high energy demanded in its operation are still important disadvantages of this traditional preservation technique [1].
Membrane separation technologies (micro, ultra, nanofiltration, reverse osmosis, and pervaporation) are an alternative for processing fruit juices. Membrane processes have many advantages over other concentration techniques. The most important advantages are that, usually, they keep the product quality, and because they work at low temperatures, they require less energy and space, which result in an operation extensively flexible [2]. Within the range of operations with membranes, concentration by osmotic evaporation (OE) has emerged as a potential technique applicable in the food, chemical, cosmetic, and pharmaceutical industries [3,4].
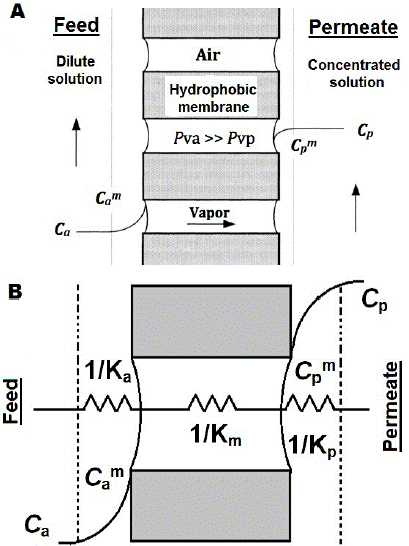
Osmotic evaporation (OE) is a variant of membrane distillation (MD), whose process uses hydrophobic membranes, wherein the pores are filled with the gas phase of the fluid to concentrate, thus preventing water penetration so that only volatile components are transported through the membrane [5]. The vapor partial pressure difference between liquids separated by the membrane is the process' driving force, and its value depends on the temperature and composition of layers adjacent to the membrane surface, whose effect may generate this partial pressure gradient [6,7]. During the OE process, mass transport can be divided into three stages (Figure 1a). The initial and final stages correspond to water transfer from the dilute solution through the evaporation interface, and vice versa from the condensing surface to the brine; and the intermediate stage corresponds to vapor movement through the porous material [8].

Fig. 1 Osmotic Evaporation Process. a) Process basis b) Resistances to the mass transfer in osmotic evaporation.
Equation (1) describes the basic model of mass transfer, relating flux (N) and driving force (A pressure) by a proportionality constant that is the membrane permeability (k) [9].
A more suitable permeability representation is given by equation (2), wherein the overall coefficient (K) integrates several resistances to mass transfer (Figure 1b). Preliminary documentation has discussed widely and in depth the mathematical models and phenomena applicable to the osmotic evaporation description [10,11].
Despite the recognized advantages of OE, low yields and long process times are its greatest weaknesses; these topics, along with the development of more efficient and specific modules, are the work front of scientific researchers around the world. The objective of this research was to apply the modeling and multiphysics computational simulation, along with an experimental validation backup, to contribute to the development of scientific and technological tools that allow a real progress of the osmotic concentration process applied to fruit juices.
II. Materials and methods
A. Computer simulation
The simulations were structured considering the following limits: a) non-steady state and isothermal conditions, b) laminar flow in both streams within the module, c) no blocking pores or reaction zones, d) the membrane is assumed to be moisturized by feeding, and the juice does not fill the membrane pores due to their hydrophobic nature, e) feed and brine flows are constant, and the tank supply is perfectly mixed, and f) no accumulation in the piping system.
The hollow fiber module (Figure 2) constitutes the central part of the system to be modeled. Each fiber is composed of a cylinder with radius (r) and length (z), surrounded by a porous membrane; the feed (juice) flow is laminar within the fiber (lumen), being introduced at z = 0, while the extraction solution (brine) is passed through the module housing, removing water vapor from the feed, and subsequently, by diffusion through the membrane it is absorbed by the brine. Table 1 summarizes the conservation equations that govern the system, where, ε, τ, and dp are tortuosity, porosity, and pore diameter in the membrane, respectively, Mw is water molar mass, R is the gas constant, T is the absolute temperature, C is concentration, r is radius, z is length, and D is the diffusion coefficient.
B. Boundary conditions
The Happel's free surface model [12] was used to estimate the radius (r3) on the brine side (Figure 3). According to this approach, each fiber in the housing space is considered to be surrounded by a fluid layer in which there is neither momentum, mass, nor heat transfer on the outer surface. Mathematically the free surface is defined as:
Where Φ is the void volume fraction and can be calculated using equation (4) with fibers number (n) and inner module radius (rim).
The simplified geometry module is shown in Figure 4. To facilitate the analysis and reduce the computation time, an axisymmetric approach with three subdomains was used: lumen (juice), membrane, and housing (brine), which are all active for mass transfer due to vapor gradient.
C. Numerical solution
At this stage, water removal by OE was simulated considering a recirculation mode. The water concentration change in the feed tank is a parameter of vital importance, and so, it is rigorously calculated. Feed tank is assumed as a perfect mixture (homogeneous), juice and brine flows are constant, and there is no accumulation in the pipes. The balance mass on the tank for t = 0 y Ctan = C0 is:
Where Q is the volumetric flow (L/min), V is the juice volume (L) in the tank, t is time (s), C is the water concentration (mol/m3), and Cz = L is the water concentration at module output, which is the input to the tank.
The model equations were numerically solved using the Comsol Multiphysics® 4.2b software, which uses the finite element method (FEM), linked to Matlab® with the Livelink® tool. Execution and resolution were carried out on a personal computer Intel i7 (4 GHz -16 GB RAM), using the Pardiso® integrated solver. The maximum number of iterations was 250, and the relative tolerance was 1E-6. Due to the difference between radius and length (z-axis), a scale factor of 50 was employed. The system was solved and simulated using the algorithm proposed in Figure 5. Passion fruit juice was assumed as a glucose, fructose, and water mixture, components that represent almost 95 % of its total composition [13]. Physical properties of fluids were calculated using the models presented in Table 3.
D. Experimental validation
Fruits of yellow passion fruit (Passiflora edulis) were harvested in commercial crops (Gigante, Huila, Colombia). Juice from a sample of 30 fruits was extracted and analyzed: soluble solids °Brix ± 0.1% - 20 ± 0.01 °C (Rx7000, Atago, Japan), pH (handylab ± 0.01 pH, Schott, Germany) previously standardized with buffer solutions pH 7 and 4 (20 ± 0.1 °C), total solids (920.151 AOAC), viscosity at 25 ± 0.5 °C (DVIII Ultra ± 0.1 cP, Brookfield, USA), and turbidity (2100N ± 0.2 NTU, Hach, USA).
As pretreatment, passion fruit juice (10 L) was clarified in a Pellicon2® unit (Millipore, USA) with 10 kDa molecular cut-off membrane, and 0.5 m2 filtration area, analyzing permeate and retentate in triplicate for the same parameters than raw juice. OE was carried out in a hollow fiber module (1.7 x 5.5 MiniModule Liquicel®), which has 7400 fibers with 0.5 urn pore diameter, 40 % porosity, and 0.58 m2 area; Figure 6 shows the osmotic concentration system.
Fluids were driven using peristaltic pumps (concurrent), brine (CaCl2) was maintained at a level of 44 % w/v (saturation point), with a 1:7 (L) feed/brine ratio. Juice temperature was controlled with a thermostatic bath (CW05G, Jeiotech, Korea) and a double jacket glass condenser, checking the temperature in real time with a thermocouple (J type, 800024, SperScientific, USA).
Passion fruit juice temperature was 31 ± 0.5 °C, brine flow was 242 mL/min, and juice flow was 146 mL/ min; these optimal conditions were established in a previous research [11]. The evaporation flux was calculated as the juice weight loss, every 15 minutes. The process was conducted three times with 3 L of juice as the experimental unit.
III. Results and discussion
A. Ultrafiltration
The analysis of the physicochemical characteristics of passion fruit juice at different processing steps shows a slightly pH decrease, and while the total solids significantly increase in the retentate, they decrease in the clarified (Table 4). In addition, the permeate viscosity is very close to that of the water, which indicates the effectiveness of ultrafiltration to remove insoluble material. Soluble solids reduction in the permeate is something undesirable and could be due to incomplete dissolution of hemicellulose components removed by the filtration. Finally, turbidity is significantly reduced, observing a yellow and translucent juice without suspended particles. This behavior is similar to that described for ultrafiltered pineapple [18] and kiwi [19] juices.
B. Osmotic evaporation
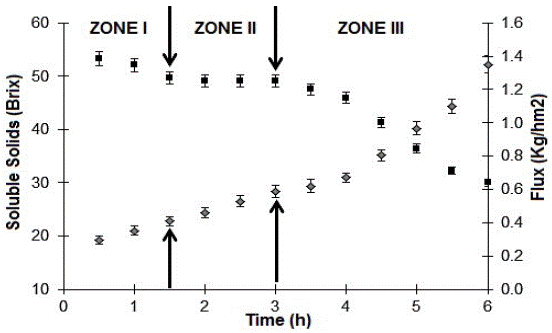
In the osmotic evaporation process (Fig. 7), we observed three zones. In zone I, evaporation flux rapidly decreased from a maximum of 1.38 kg/m2h to 1.26 kg/m2h over 1.5 hours. Two reasons can explain this result: first, low membrane clogging due to previous ultrafiltration, which involves low-insoluble particles, and second, a low initial viscosity, which enables achieve higher mass transfer coefficients. At this stage, viscous effects were negligible.

Fig. 7 Soluble solids (♦) and flux (■) evolution in the osmotic concentration of passion fruit juice.
Zone II can be considered as a transitional stage, which begins with a flux decline until 1.20 kg/m2h over 1.6 hours. In zone III, the flux falls rapidly, from 1.20 to 0.63 (kg/ m2h) at 3 hours, and the viscosity significantly increases (from 1.30 to 141.2 cP) due to soluble solids concentration, which causes a boundary layer over the hydrophobic membrane that generates a high resistance to mass transfer.
C. Simulations
Water removal increases the solute concentration, causing two concentration polarization layers (Figure 8), one at the upstream membrane surface (juice side), and another at the downstream membrane surface (brine side) by decreasing the salt concentration. The polarization layers reduce the transmembrane water flow by reducing the liquid vapor pressure, this phenomenon is less important in osmotic evaporation than in the reverse osmosis [20].
Juice velocity progressively decreases as the viscosity effect becomes more pronounced. Finally, a fluid stagnation occurs, producing a boundary layer on the membrane surface (feed side), causing the less viscous solution to move toward the fiber center, increasing its speed, and causing a residence time reduction inside the membrane module. The boundary layer prevents the access of the diluted juice to the membrane surface, causing significant decreases in water transport [21].
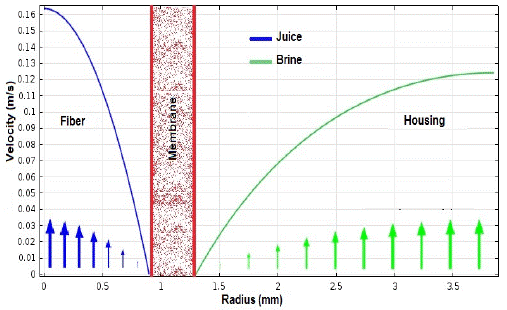
Velocity profiles calculated by Comsol® are presented in Figure 9. As fluids layers move away from the contact point, they progressively increase their velocity, which is higher on the brine side due to a lower viscosity and a larger radius. However, the maximum brine velocity is less than that of juice due to hydrodynamic reasons; while fiber interior is a typical "pipe," outside flow is more complex, and it is related to the packing density and fibers shape. In conclusion, both fluids follow the laminar flow theory [22], with Reynolds numbers in a 40-200 range (interior), and 500 to 1100 for the housing [23].

Fig. 9 Velocity profiles for fibers (juice) and housing (brine) inside the osmotic evaporation module.
Experiments and model predictions implemented in Comsol® for flux and soluble solids show strong correlations between the simulations and the real data (R2 > 95 %) (Fig. 10). In zone I, simulated flux values have slight deviations (6-8 %) that could be attributed to the fluids' hydrodynamic behavior, especially the brine, which flows through a much more intricate geometry, possibly generating a localized increase in turbulence at some parts of the module, which in turn could produce a higher mass transfer coefficient [21]. For soluble solids, the deviation occurs mainly at the beginning and could be corrected by taking short time intervals for this parameter at this stage.
Zone II remained stable and presented a permanent flux overestimation (about < 4 %). No abrupt changes characterize this period, and as other researchers have suggested, the process should always be maintained, if possible, at this stage [24]. The small gap with the experimental data could be mainly due to a progressive accumulation of infinitesimally mathematical errors; these errors are minimized using other geometric shapes or variable density meshing at different parts of the domains.
Finally, for zone III or flux decreasing stage, simulations were accurate describing the process at the beginning and the end. At zone III, the soluble solids level substantially increases, which causes the viscosity to control the mass transfer. Deviations found might be due to calculations being performed using the nominal fiber length reported by the manufacturer. Figure 11 shows the liquid water concentration (juice side) as a time process function. At the beginning of the process, the driving force is large (red areas), causing high rates of water transfer to the module housing (brine); whereas, at the end, the water concentration has dropped so much that the vapor differential has almost disappeared, making this stage very slow. Future investigations could apply techniques such as interferometry, ultrasound, or related techniques to compare the concentration distributions obtained by simulations, and further refine models [25].
Increasing juice velocity improves the osmotic evaporation performance, and a greater juice homogeneity, produced within the fiber, facilitates that less concentrated solution has more contact with the membrane. These two conditions lead to a higher differential vapor pressure on the surface, and a removal of the concentrated solution (viscous layer) that acts as a water transport resistance. However, if velocity increases too much, the residence time inside the module may be reduced [26].
IV. Conclusions
Matlab® and Comsol® simulations were phenomenologically adequate predicting the flux and soluble solids behavior in the osmotic evaporation process. Ultrafiltration and osmotic evaporation were efficient and synergistic technologies to obtain a concentrated passion fruit juice with good physicochemical quality; these two techniques are alternatives for fruit processing. For the validation stage, higher correlations were obtained between experimental data and simulations; the simultaneous use of both software facilitated the predictions for non-stationary conditions. The feasibility of using this method to simulate, and subsequently improve the osmotic evaporation process was demonstrated.


