


 Spanish (pdf)
 Article in xml format
 Article references
 Send this article by e-mail
 Cited by SciELO
  Cited by Google
  Similars in
SciELO
Similars in
SciELO  Similars in Google
 Permalink
I. INTRODUCTION
In Colombia, the municipalities have in their administration different undersecretariats or portfolios for the management and fulfillment of the objectives to be developed by their elected representative, these are executed through the development or government plan. Each portfolio must have relevant information for decision-making and generation of impact projects for the population of the municipality, being the contexts of education, health, and social programs primary sources of information to generate management indicators that define part of the situational status of a specific population or population group. These are also determining factors in the social transformation and analysis of indicators of progress in overcoming poverty, improving the conditions of the vulnerable population, schooling, improving the population's health conditions, among others.
Currently, each program handles and manages the information from different platforms, systems, and structures in its different portfolios, independently of the management processes provided by the departmental and national government. In addition, all this information has as its main core the data provided by citizens, therefore, the territorial entity does not have the possibility of unifying, relating, and permanently managing this information. The provision of public services, programs or social projects requires the management of large volumes of data and information for the benefit of the community, which leads to the need of using tools that facilitate data extraction, processing and analysis, to facilitate the decision making in government agencies; where the main axis is the information provided by the citizen, which includes personal data, location, socioeconomic characterization, provision of health services, education and benefits of government programs, showing that the information is administered inefficiently, using manual methods, office automation tools between different information systems, both internal and external, with different data structures; this is why the quality and homogeneity of the data is not a constant, which makes the query, crossing and reporting of information between the different dependencies complex. Hence, it is important that the territorial entities begin to use Business Intelligence tools, which eases the consolidation, visualization, and analysis of information by administrative personnel, generating reports in real time that facilitate the analysis of results, the identification of variations in information, facilitate decision-making and the implementation of strategies aimed at the welfare of the population.
The importance that the public sector needs to advance in preparing to exploit the data that entities constantly generate and collect and recognizing that these are a strategic asset of the nation is very clear. For this reason, a Business Intelligence solution can contribute significantly to the government's development plan.
II. METHODOLOGY
This article presents a Business Intelligence solution aligned to descriptive research under the methodology developed by Ralph Kimball. Figure 1 shows the proposed life cycle.

For the development of a Data Warehouse / Business Intelligence solution, the following tasks were performed:
Planning
Analysis of requirements
Dimensional modeling
Physical Design
ETL system design
BI application specification and development
This article presents important aspects that emerged after performing the tasks defined in the chosen methodology. Table 1 shows the matrix obtained with the facts (metrics) and the corresponding dimensions (normalization) according to the established requirements.
Table 1 Matrix of facts and dimensions.
| Name | Description | Time | Location | Educational Institution | Lifecycle | Health_Dx (Purpose) |
|---|---|---|---|---|---|---|
| PSOCIALES_EDUCACION_1 | Number of student population by location, educational institution and age range, beneficiaries of the Families in Action social program. | X | X | X | X | |
| SALUD_EDUCACION_1 | Amount of student population by educational institution and age range that received promotion and prevention activities. | X | X | X | X | |
| SALUD_EDUCACION_2 | Total number of adolescent pregnancies in the student population. | X | X | X | X | |
| PSOCIALES_SALUD_1 | Number of underage population by location, population group and age range affected by malnutrition belonging to the social program families in action. | X | X | X | X |
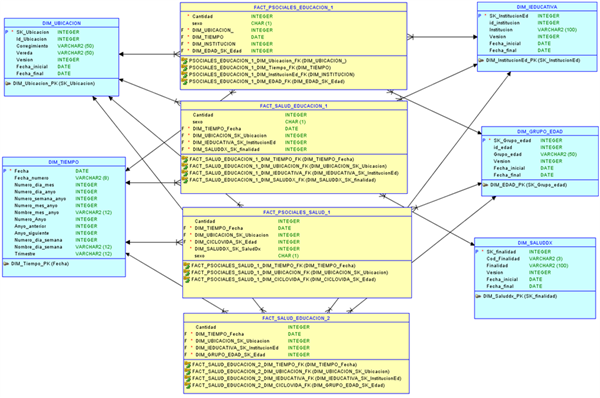
Figure 2 represents the dimensional model which describes 4 facts and 5 relevant dimensions in the study.
III. RESULTS
This chapter represents the resulting Cubes, Reports and Dashboards using the Pentaho tool .
Table 2 shows the dimensions, hierarchies, and levels of Cube 1, which allows the generation and visualization of the historical information of the beneficiaries of Families in Action enrolled in the educational institutions of the municipality under analysis.
Table 2 Dimensions, hierarchies, and levels. Cube 1.
Figure 3 shows the configuration of dimensions, hierarchies, and levels of Cube 1.

Figure 4 shows the elaboration of the Cube 1 report where the PIVOT-4J Plugin for Pentaho Server was used, which allows to elaborate different types of reports and use of the levels of the hierarchies of the built cube.

Figure 5 shows the control panel with the total population records corresponding to census lists by reservation and / or community initially uploaded and processed through the Extraction, Transformation and Loading (ETL) process , where the respective filter was applied, extracting the inconsistent records to which the respective inconsistency label was assigned through a transformation process with the Pentaho Data Integration tool. For a total of 32407 initial records, 1095 inconsistencies were obtained, out of which 768 had duplicate documents.

Figure 6 shows the Dashboard with the results related to the population of the Families in Action social program that are currently studying, determined by year, gender, age, and educational institution. A total of 8465 enrolled in Educational Institutions was determined.

Figure 7 shows the Dashboard, which combines the information on the student population with the information from the Individual Service Provision Registry -RIPS, to know the Promotion and Prevention activities carried out on this population in a territorial entity, the user can identify the activities applied or executed by life cycle, generating expectations of fulfillment and/or increase of activities not typical of the student population between the ages of 0 to 17 years in the framework of the Mandatory Health Plan - POS.

Figure 8 shows the Dashboard, which combines the information on the student population with the information from the Individual Service Provision Registry - RIPS, identifying the adolescent pregnancies presented in the student population. For this case, a total of 553 adolescent pregnancies between 2016 and 2019 can be evidenced.

Figure 9 shows the Dashboard that combines the information on the population in social programs with the information from the Individual Registry for the Provision of Services -RIPS, to know the children and adolescents who present a state of malnutrition, in this case a total of 44 minors affected by malnutrition can be seen between 2016 and 2019, and the highest percentage is determined in the early childhood stage.

IV. DISCUSSION AND CONCLUSIONS
It is evident that public institutions are rich in data and information, but currently they do not have enough tools to exploit it and perform a better analysis. Thus, it is of great importance that government entities begin to venture into the implementation of new technologies such as Business Intelligence and Data Warehouse solutions that allow easy access and analysis of information, facilitating decision-making and the application of new strategies to solve specific problems through the use of control panels, visualization of indicators, and generation of reports.
By having an information system integrated into a territorial entity, the probability of inconveniences in the standardization and quality of the data decreases, which presents an opportunity for the adoption of more specific ETL processes that allow generating quality information.
It is essential to raise awareness among territorial entities about the importance of implementing a project of this type in order to have access to more sources of data and historical information and demonstrate the usefulness and importance of this type of technology in the official sector, to scale the solution to larger territorial entities, Departments (Governments).Also explore other technologies and tools to design an ecosystem in the cloud that allows the territorial entity to improve access and consultation of data.
With this solution, the opportunity to develop an own methodology for the documentation and implementation of projects of this type, based on the adoption of good industry practices arises. In the same way enriching the current scope of Data Warehouse with data mining techniques to obtain more information for interpretation and analysis.

