INTRODUCTION
The cement industry has been making substantial efforts to reduce CO2 emissions due to the use of fossil fuels with regard to the calcination of raw materials to produce clinker. These global emissions are huge and were estimated to be 7% of the total, which corresponds to a cement production of 4,5 GTons (Telesca et al., 2017). Cement manufacturing is a very intense energy-consuming process, and each ton of produced cement implies nearly one ton of CO2 (Rehan & Nehdi, 2005). Therefore, one of the cement industry’s main goals is to reduce its CO2 footprint worldwide. This global issue is even worse in developing countries, where, in addition to poor regulation, few investments are made by both government and industry in research and technology aimed towards more eco-friendly processes. Al this, in comparison with leading economies in Europe, North America, and some Asian countries.
In order to provide a real solution to this problem, the amount of fossil fuels used must be reduced through different strategies. This includes the use of alternative or supplemental materials in cement such as fly ash, steel slag, and natural pozzolans (Colorado et al., 2016; Juenger & Siddique, 2015; Nuruddin et al., 2014; Yuan et al., 2018). Another alternative is the use of chemical admixtures and additives, which not only improves properties such as workability, pumping, durability, compressive strength, and contraction, but it also contributes significantly to reducing the amount of cement and water in the mix, thus reducing the CO2 emissions and preserving water sources (Plank et al., 2015). The additives used in this research were superplasticizers (SPs), which are classified as type F in the ASTM C494 standard (ASTM International, 1999) and known to be high-level water reducers. The concrete industry mainly uses sulphonated naphthalene formaldehyde condensate (SNF), sulphonated melamine formaldehyde condensate (SMF), modified lignosulphonates (MLS), and lignosulphonate (LS) as super-plasticizers (Ramachandran et al., 1998; Usher et al., 1980). These additives are nowadays extensively used in high-strength concrete with low water/cement ratios (W/C), despite the fact that they conserve optimal setting and compaction properties (Łaźniewska-Piekarczyk, 2013). Super-plasticizers are dispersants that work via the flocculation of cement particles, which repel each other and thus disperse (Aïtcin & Flatt, 2015; Forde, 2009; T. Zhang et al., 2001). These are complex, high-density molecular polymeric materials that are soluble in water (Liska & Hewlett, 2019).
The super-plasticizer effect in Portland cement hydration has been a matter of intense research (El-Gamal et al., 2012; Mollah et al., 2000), where dispersive action is associated with molecule adsorption by the surface of the cement particles during the initial step of hydration. Explanations (El-Gamal et al., 2012) are focused on the Ca ions interacting with the anionic parts of SPs, which promotes crosslinking and film-forming characteristics, therefore changing the process of crystallization in the setting of cement. The interaction between the ionic parts of the additives and Ca(OH) is very important during the process. These super-plasticizers can be absorbed by the cement grains in a mechanism driven by negatively-charged anionic groups, thus charging the grains negatively and causing them to repel each other. There are three main contributions of SPs to delayed hydration action in cements (El-Gamal et al., 2012; Y. Zhang & Kong, 2015):
(a) The absorbed SP molecules can obstruct the water and Ca+2 ions’ diffusion.
(b) The Ca+2 ions can produce complexes due to their interaction with SP molecules, which can block the nucleation and precipitation of Ca components.
(c) The dispersive result of SP can change the morphology and kinetics of the hydration phases.
A novel family of SPs was developed from synthetic polymers, mainly from polycarboxylates, which are typically obtained from a polymerization process associated with acrylic and methacrylic acids. These SPs also produce electrostatic repulsion among the cement particles, which has been identified due to the repulsion between long-chain molecules of ether groups (El-Gamal et al., 2012; Mollah et al., 2000; Rivva, 2002; Y. Zhang & Kong, 2015).
In the city of Medellín, Colombia, there is an increasing interest by companies and universities in reducing the pollution and moving towards a circular economy. This research is the result of a partnership in this regard, and it aims to improve the properties of cement before and after the full setting process, as well as to reduce the cement and water contents in the studied formulations using only superplasticizers. Therefore, not only material characterization but also performance tests were conducted in order to evaluate the two selected additives. The analysis, conducted by means of a statistical multilevel factorial model, is very important for involving critical variables to be later implemented in a real large-scale process. The results and methodology of this research can have an impact in the cement context of the mix, and they were implemented in the concrete design of a large-scale production process by Conasfaltos S.A., a local company.
METHODOLOGY
Materials
Ordinary Portland cement from Cementos Argos was used in this study. Its physical and chemical properties are summarized in ¡Error! No se encuentra el origen de la referencia. and Table 2 . Following the ASTM C494 standard (ASTM International, 1999), two different type F additives were used: additive 1 (A1), based on polycarboxylate; and additive 2 (A2), based on naphthalene. Both were used at 0,8 and 1,0 wt% contents with respect to the amount of cement. The contents of these additives were selected based on the recommendations given by the manufacturers. Moreover, two aggregate types supplied by Conasfaltos were used, which were obtained from a local quarry near Medellín. The characterization data provided by the company are shown in Table 3, and the gradation is shown in Figure 1.
Table 1 Chemical information for the cement used in this research
| Component | wt% | NTC 321 Type I | ASTM C1157 |
|---|---|---|---|
| MgO, max (%) | 6,00 | 7,00 | - |
| SO, max (%) | 3,50 | 3,50 | - |
Note: NTC 321 is the Colombian standard based on ASTM C150
Source: Authors
Table 2 Physical parameters of the cement used in this research
| Parameters | Argos standard | NTC 121 Type I | ASTM C1157 |
|---|---|---|---|
| Initial setting (1), lowest value (min.) | 45 | 45 | 45 |
| Final setting(1) , maximum value (min.) | 420 | 480 | 420 |
| Autoclave expansion, max. (%) | 0,8 | 0,8 | 0,8 |
| Water expansion (2), max. (%) | 0,02 | - | 0,02 |
| Strength at 28 days (3), min. (MPa) | 26,0 | 24,0 | 28,0 |
| Blaine, min. (cm2 /gr) | 2.800 | 2.800 | - |
Note: NTC 121 is the Colombian standard based on ASTM 1157
(1)Vicat needle tests following NTC 118 (ASTM C191)
(2) Tests on mortar bars after 14 days following NTC 4927 (ASTM 1038)
Source: Authors
Table 3 Characteristics of the aggregates used in this research
| Property | Fine sand | Coarse sand |
|---|---|---|
| Loose mass (kg/m3) | 1.363 | 1.630 |
| Compact mass (kg/m3) | 1.541 | 1.693 |
| Apparent specific weight | 2,81 | 2,78 |
| Fineness modulus | 3.08 | 3,62 |
| Organic matter content (NTC 174) | 1 | 1 |
| Sulfate soundness test (NTC 174) (%) | 2,8 | 1,5 |
| Clay lumps and friable particles in aggregate (%) (NTC 174) | 0,7 | 0,67 |
| Carbon and lignite (NTC 174) | 0,01 | 0 |
| Alkali-silica reactivity | Not harmful | Not harmful |
| Absorption (%) | 1,65 | 1,34 |
| Passing sieve 75 µm (%) | 2,7 | 6,1 |
Note: NTC 174 is the Colombian standard based on ASTM C33
Source: Authors
Experimental design
A multilevel factorial design (Carter Jr., 1990) was implemented in this research using the Statgraphics statistical software, with the purpose of evaluating the main effects and the interaction of each factor (additive 1, additive 2, and sand) in the response. Two factorial designs were made since additive 1 and 2 should not be mixed. For a complete graphical representation, 3D response surface plots were generated to show the relationships between the experimental variables and their responses (Solaiman et al., 2016). Tables 4, 5, 6, and 7 summarize the method and its results.
Table 5 Samples for experimental design A
| Sample | Additive 1 | Sand |
|---|---|---|
| 1 | 1 | 1 |
| 2 | -1 | 1 |
| 3 | 1 | -1 |
| 4 | -1 | -1 |
Source: Authors
Sample preparation
Cubic mortar samples of 5 x 5 x 5 cm3 were elaborated while keeping a water-to-cement ratio (W/C) of 0,485. Aggregate was used in aggregate-to-cement ratios (A/C) of 2,69/1 for fine sand aggregate and 2,73/1 for coarse sand aggregate. All materials were mechanically mixed with water, and then cement and sand were added. All components were mixed thereafter. The samples were cured at 23 °C and compression tested after 7, 14, 21, and 28 days of curing.
Compressive strength
The compressive strength was determined for samples after 7, 14, 21, and 28 days of curing. In all cases, three cubic (5 mm cube edge) specimens were tested per formulation in order to determine the mean and the standard deviation. All this, while observing standard ASTM C109 (ASTM International, 2013b).
Setting time
The setting time was estimated with a Vicat needle while following the ASTM C191 standard (ASTM International, 2013a). Tests were conducted on cement paste and cement paste with additives. The initial setting time was obtained when the needle penetration was 25 mm, and the final setting time was obtained when it was 0,0 mm. In order to reduce the external environmental effects, all samples were maintained at 20 °C in a humid room.
Fluidity and air content
Fluidity tests were performed in a flow table apparatus following the ASTM C230 standard (ASTM International, 2008). The air content in the mix in the fresh state of cements was determined with a type B tester under the ASTM C231 standard (ASTM International, 1997).
X-ray diffraction
In order to characterize the X-ray diffraction (XRD), tests were conducted at room temperature in a PANanalytical X’Pert PRO diffractometer with a Copper Kα radiation of 1,5406 Å, voltage of 45 kV, and scanning from 10° to 90°.
Scanning electron microscopy (SEM)
In order to stop the hydration reaction, samples cured for 28 days were submerged in acetone. Then, a drying process was carried out in all samples for 24 h at 55 ºC using an electric (joule) furnace. A JEOL JSM 6700R SEM was used in this research, which operated in high vacuum mode. For SEM characterization, the samples were fractured in order to expose their internal microstructure, and they were then sputtered in a Hummer 6.2 system operating at 15 mA AC for 30 s. This was done in order to make the surface conductive by the deposition of a thin film of gold. The samples were also chemically analyzed via energy-dispersed spectroscopy (EDS) adapted to the SEM.
RESULTS
The granulometry tests for the aggregates used in this research are shown in Figure 1. The results show a size distribution with soft continuous changes for both the fine and coarse sands. For sand to have a good gradation, it must have a uniformity coefficient of 6 or more and a curvature coefficient higher than 1 and lower than 3 (Juárez-Badillo & Rico-Rodríguez, 1998). The results for the uniformity coefficient for both fine and coarse sand were 5,739 and 8,798, respectively. Furthermore, the curvature coefficient for fine and coarse sand was 1,045 and 2,286, respectively. Therefore, fine sand does not have not the best gradation, as it does not fulfill the two requirements regarding uniformity and curvature coefficient, whereas coarse sand fulfills both requirements.
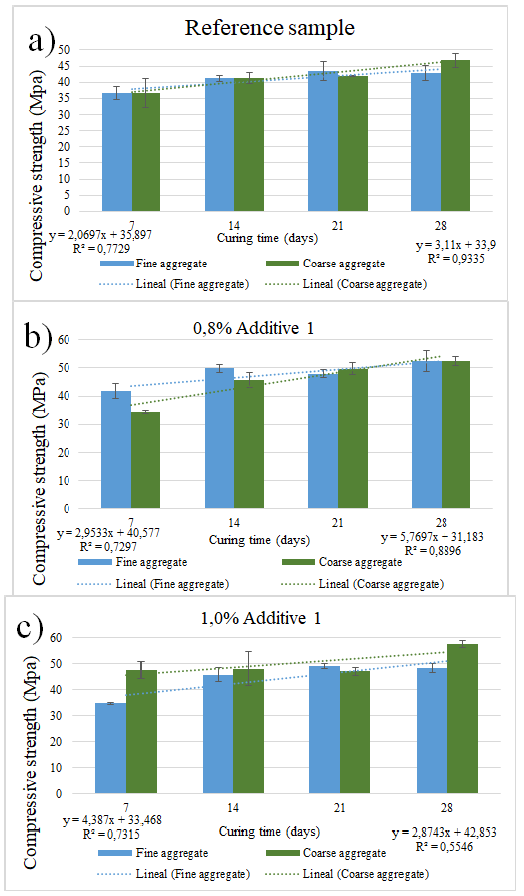
Figures 2 and 3 summarize the compressive strength measured at 7, 14, 21, and 28 days of curing. In case of the reference sample summarized in Figures 2a and 3a, which corresponds to the sample without additives, the strength of the sample with fine sand increased almost linearly by 3,62%, showing a correlation of 0,77. The strength of the sample with coarse sand also increased almost linearly by 5,43%, with a correlation of 0,93. Figure 2b shows samples with 0,8% of additive, with fine sand at 5,15% and a correlation of 0,73. Samples with coarse sand also showed a linear tendency towards increasing the strength with curing time, with a slope of 10,10% and a correlation of 0,55. Figure 2c shows the compressive strength for samples with 1 wt% of additive 1. Samples containing fine sand increased their slope by 7,67% and showed a correlation of 0,73, whereas, for coarse sand, the slope was 5,01% with a correlation of 0,89.
Source: Author
Figure 2 Compressive strength for a) reference samples without additives, b) samples with 0,8% additive 1, c) samples with 1,0% additive 1

Source: Authors
Figure 3 Compressive strength for a) reference samples without additives, b) samples with 0,8% additive 2, c) samples with 1,0% additive 2
Figure 3b shows the results for samples containing 0,8 wt% of additive 2. Samples containing fine sand exhibited a slope of 2,34% and a correlation of 0,94, and samples with coarse sand also showed a linear tendency: a slope of 6,08% and a correlation of 0,94. Finally, Figure 3c shows samples with 1 wt% of additive 2; fine and coarse sand also showed a linear tendency towards increased strength with curing time. Fine sand exhibited a linear inclination of 1,97% and a correlation of 0,29, whereas coarse sand showed a slope of 5,68% with a correlation of 0,85. In general, Figures 2 and 3 show that the compressive strength is higher for larger sand sizes. A similar conclusion can be drawn regarding the additive: the more additive content, the higher the compressive strength, although samples with additive 2 (Figure 3) did not show a significant change in compressive strength with respect to the reference sample.
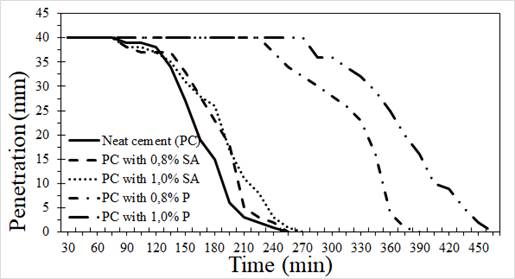
Figure 4 summarizes the initial and final setting times for the neat cement paste and the cement paste with additives. From these curves, it can be observed that samples with additives increased the initial setting time from 3 to 192 min, and there was an increase in the final setting time from 23 to 218 min with respect to the reference for the sample without additives. It is also observed that samples with additive 1 showed a higher increase in the initial setting time (between 140 and 167 min), as well as in the final setting time (between 151 and 195 min) in comparison with additive 2. In addition, it is noted that samples with a higher content of additive (superplasticizer) have longer initial and final setting times. Considering that the delayed hydration (increase in setting time) is known to be due to adsorption of additive to the cement’s particle surface (Brooks et al., 2000), it can be stated that the adsorption of additive 1 is higher than that of additive 2, which is due to their different chemical natures.
Regarding the fluidity of the mortar, Table 8 shows that fluidity is below the required percentage (120%), considering that a mix with fine sand generally has a fluidity percentage (95,68%) higher than a sample with coarse sand (74,93%). Formulations with additive exhibit an increase in fluidity with respect to samples without additive, which allows the mixes to be used as pumpable concrete. Moreover, mixes with additive 1 have a higher fluidity (156,20% more than samples with additive 2). It is also observed that, by increasing the additive content, the fluidity increases as well. Therefore, since a higher adsorption of this additive (superplasticizer) over cement grains produces a higher fluidity (Burgos-Montes et al., 2012), it is inferred that the dispersion capacity of additive 1 is higher than that of additive 2. Therefore, a larger amount of additive 2 is required (Sakai et al., 2006).
Table 8 Mortar fluidity
| Sample | Fluidity (%) | |
|---|---|---|
| 1 | Coarse sand + 1% Additive 1 | 156,2 |
| 2 | Coarse sand + 0,8% Additive 1 | 156,2 |
| 3 | Fine sand + 1% Additive 1 | 156,2 |
| 4 | Fine sand + 0,8% Additive 1 | 156,2 |
| 5 | Coarse sand + 0,8% Additive 2 | 114,36 |
| 6 | Coarse sand + 1% Additive 2 | 129,98 |
| 7 | Fine sand + 1% Additive 2 | 143,79 |
| 8 | Fine sand + 0,8% Additive 2 | 126,26 |
| 9 | Coarse sand | 74,93 |
| 10 | Fine sand | 95,68 |
Source: Authors
Table 9 summarizes the air content of the samples. Those with additive 1 and coarse sand showed the lowest air content among all samples. Moreover, all samples with additive 1 had a lower air content than those with additive 2. Air bubbles are present in powdered materials and also are produced by the mixer (Šeputytė-Jucikė & Kligys, 2016). Therefore, the rheology of the mix altered by the superplasticizer can produce significant changes in the air content. A less viscous mix can more easily release bubbles through the surface, which is certainly true for additive 1, whereas the higher viscosity of additive 2 hinders bubble mobility and causes a large number of them to remain in the mix (Aïtcin & Flatt, 2015).
Table 9 Air content
| Sample | Air content (%) | |
|---|---|---|
| 1 | Coarse sand + 1% Additive 1 | 1,55 |
| 2 | Coarse sand + 0,8% Additive 1 | 1,85 |
| 3 | Fine sand + 1% Additive 1 | 2,9 |
| 4 | Fine sand + 0,8% Additive 1 | 3,38 |
| 5 | Coarse sand + 0,8% Additive 2 | 5,75 |
| 6 | Coarse sand + 1% Additive 2 | 6,15 |
| 7 | Fine sand + 1% Additive 2 | 6,3 |
| 8 | Fine sand + 0,8% Additive 2 | 7,1 |
| 9 | Coarse sand | 3,65 |
| 10 | Fine sand | 5,25 |
Source: Authors
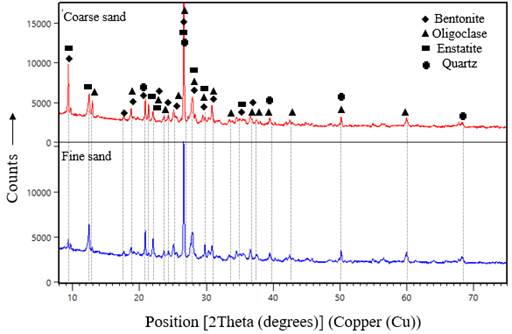
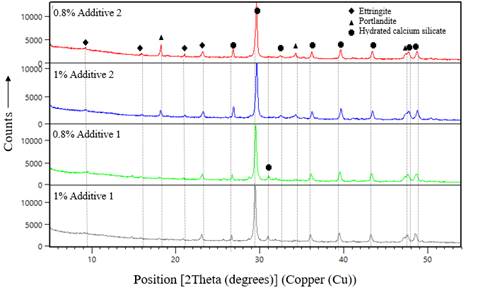
The XRD spectra for both fine and coarse sand are shown in Figure 5. The main phases found are oligoclase, bentonite, quartz, and enstatite. Figure 6 shows the case of cement paste with 0,8 wt% of additives 1 and 2. Calcium silicate hydrate (CSH), ettringite, and portlandite (Ca(OH)2) were identified in this test. From these results, it is clear that the type of additive does not affect the composition of cement-hydrated phases. A close comparison of the XRD spectra of the samples containing additives 1 and 2 reveals that the intensity of the peaks is lower for samples with additive 1, which is associated with a lower growth rate of ettringite (Aïtcin & Flatt, 2015). This intensity decrease was also obtained in the case of portlandite. A peak at 31,13 has been associated with the CSH affected by the adsorption of polycarboxylate in Ca(OH)2 nucleation (Diamond & Bonen, 1993).
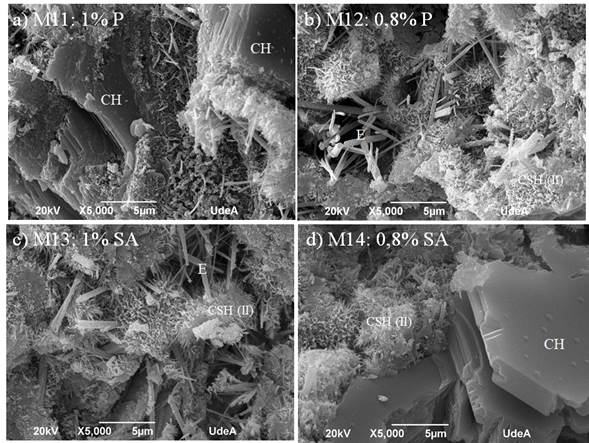
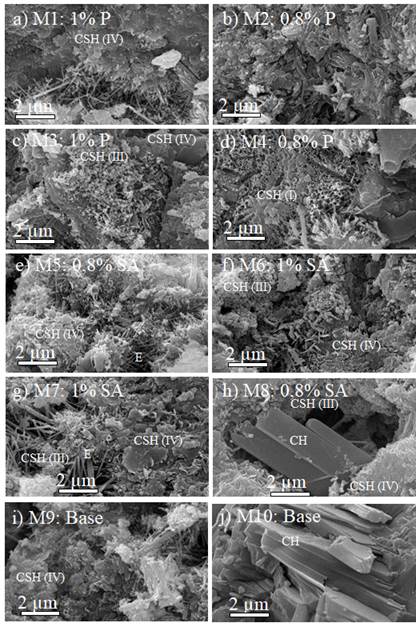
SEM images for several samples are shown in Figures 7 and 8.
Source: Authors
Figure 7 SEM images for cement paste with additives: a) 1,0 wt% additive 1, b) 0,8 wt% additive 1, c) 1,0 wt% additive 2, d) 0,8 wt% additive 2
Source: Authors
Figure 8 SEM images for mortar samples with additives: a) 1,0 wt% additive 1 and coarse sand, b) 0,8 wt% additive 1 and coarse sand, c) 1,0 wt% additive 1 and fine sand, d) 0,8 wt% additive 1 and fine sand, e) 0,8 wt% additive 2 and coarse sand, f) 1,0 wt% additive 2 and coarse sand, g) 1,0 wt% additive 2 and fine sand, h) 0,8 wt% additive 2 and fine sand, i) base sample with coarse sand, j) base sample with fine sand
CSH as fibrous particles were identified, namely those with reticular growth (type 1), reticular with fibrous structures in radial growth from the cement grain (type 2), globular (type 3), and amorphous gel (type 4) (Diamond & Bonen, 1993). Portlandite (CH), as usual, was in the form of parallel plates with a prismatic pseudo-hexagonal shape (Galan et al., 2015). Ettringite (E) in circular shapes was also observed. Figure 9 shows the SEM-EDS for selected samples. Figure 9a corresponds to sample 4, which is cement paste with coarse sand and 1,0 wt% additive 1 and showed the highest compressive strength. No pores were found, which supports the results regarding air content for this formulation. Figure 9b corresponds to sample 7, which is composed of fine sand with 1 wt% additive 2 and exhibited the lowest compressive strength values. Very few pores were found, which also confirms the air contents presented in this research. The images also show that the samples are basically composed of two materials: one with a high calcium content due to the cement paste; and another with a high content of silica and aluminum, most likely due to the aggregate.
General multilevel factorial design
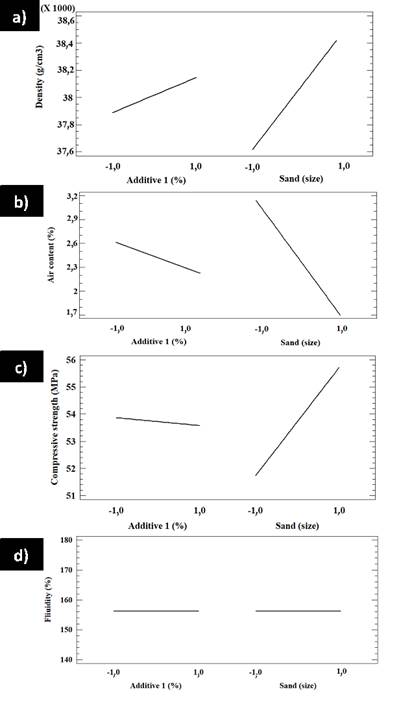
The main effects of additive 1 and sand over the density, air content, compressive strength, and fluidity for factorial design A are shown in Figure 10. In Figure 10a, it is observed that, by increasing the additive 1 content and the sand grain size, the density is increased, whereas an increase in the same variables produces a decrease in the air contents (Figure 10b). Figure 10c shows that increasing the content of additive 1 results in a decrease in compressive strength, whereas increasing the sand grain size increases it. Figure 10d shows that the fluidity does not significantly change by changing the amount of additive 1 and the sand grain size.
Source: Authors
Figure 10 Main effects plots of factorial design A for a) density, b) air content, c) compressive strength, and d) fluidity
Similarly, Figure 11 shows how changes in additive 2 and sand content affect the density, air content, compressive strength, and fluidity of factorial design B. This Figure shows that, by increasing the contents of additive 2 and the sand grain size, a density increase is produced, whereas the air content is decreased (Figure 11b). Figure 11c shows that, when the amount of additive 2 increases, the compressive strength decreases. On the other hand, an increase in the sand grain size produces an increase in compressive strength. Figure 11d shows that, by increasing the additive 2 content, fluidity increases, which also occurs when the sand grain size increases.

Source: Authors
Figure 11 Main effects plots of factorial design B for a) density, b) air content, c) compressive strength, and d) fluidity
The effect of the interaction between additive 1 and sand in factorial design A on density, air content, compressive strength, and fluidity is shown in Figure 12. In Figure 12a, it is clear that the sand and additive 1 contents will eventually intersect. It is observed that the lowest content of additive 1 is more significant than the lowest sand content. It is also observed that a low additive content and low grain size of sand produce a low density, while the highest density is obtained if the lowest additive content and the largest grain size are used. Figure 12b shows that the sand and additive contents do not interact and show no combined effect on the air content. If a low air content is needed, higher additive content and grain size must be employed, whereas, if a high air content is required, lower additive content and grain size must be employed.

Source: Authors
Figure 12 Interaction plots of factorial design A for a) density, b) air content, c) compressive strength, and d) fluidity
Source: Authors
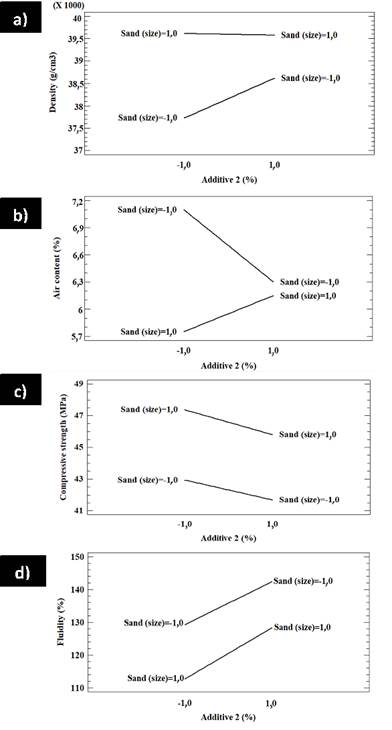
Figure 13 Interaction plots of factorial design B for a) density, b) air content, c) compressive strength, and d) fluidity
Figure 12c shows that additive 1 and sand have a high interaction regarding compressive strength. In addition, a greater content of additive 1 has a great effect on sand. Furthermore, for a higher compressive strength, the best combination is a greater content of additive 1 with coarser sand. Figure 12d shows not only that there is no interaction between additive 1 and sand, but also that there is no significant change in the fluidity, regardless of the combination of additive 1 and sand used.
The interaction between additive 2 and the sand in the factorial design B in terms of density, air content, compressive strength, and fluidity is shown in Figure 13. Figure 13a shows a low interaction between sand and additive 2; the lower the content of additive 2, the greater the effect on sand. If a higher density is required, the best combination is a lower content of additive 2 with a higher sand grain size. On the other hand, if a lower density is required, the best combination is given by a lower content of additive 2 and a lower size of sand. Figure 13b shows the interaction between additive 2 and sand: the lowest content of additive 2 has a significant effect on sand.
Source: Authors
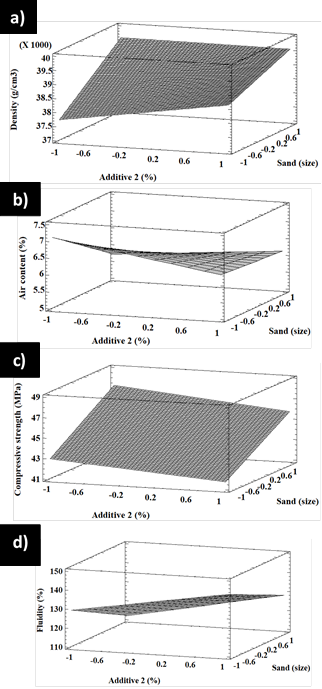
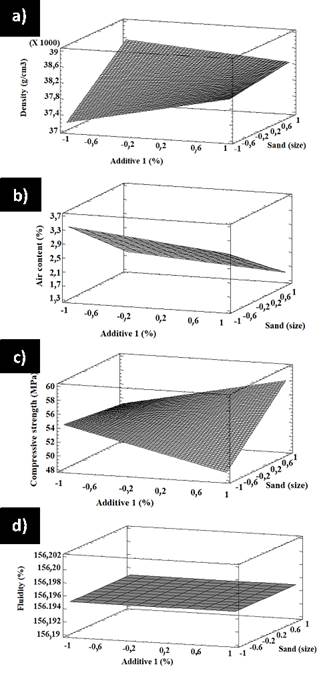
Figure 14 3D response surface plots for factorial design A showing the effect of additive 1 and sand on a) density, b) air content, c) compressive strength, and d) fluidity
Moreover, for a high air content, less additive 2 and smaller sand are needed. Conversely, a low air content requires less additive 2 and larger sand. Figure 13c shows a poor interaction between additive 2 and sand regarding compressive strength. Both high and low contents have a similar effect on sand. If a high compressive strength is desired, less additive and larger sand are required. Figure 13d also reveals a poor interaction between additive 2 and sand, as well as the fact that both low and high additive 2 contents have similar effects on sand. If a high fluidity is required, a higher amount of additive 2 and a smaller size will work. Figure 14 shows the surface response of factorial design A for the effect of additive 1 and sand on density, air content, compressive strength, and fluidity. Figure 14a shows that density increases with less additive 1 and smaller sand. Figure 14b shows that the air content decreases with additive 1, regardless of the sand size. In addition, there is a slight increase in the air content with an increase in sand size, regardless of the additive 1 contents. Figure 14c shows that compressive strength decreases with the increase in additive 1 and smaller sand, but the strength increases with additive 1 and larger sand. Figure 14d suggests that fluidity does not change with additive 1, regardless of the sand size or additive content in any of the tested contents. The surface response of factorial design A regarding the effect of additive 1 and sand on density, air content, compressive strength, and fluidity is shown in Figure 15. Figure 15a shows that density increases with additive 2 for small sand sizes and has no significant effect on large sand grains. Density increases with sand and both high and low contents of additive 2. Figure 15b shows that the air content increases with sand when low contents of additive 2 are used, but it is not affected by sand when additive 2 contents are higher. Furthermore, the density decreases with additive 2 regardless of sand size. The same happens with compressive strength, as shown in Figure 15c. In addition, compressive strength increases with sand regardless of the additive 2 content, as does fluidity (Figure 15d).
Discussion
In the first place, this research was very important for Conasfaltos, a large-scale manufacturer and constructor in Medellín, Colombia, given that its results and methods were implemented in the company within the framework of a large-scale production process. This will benefit the city, as this collaboration addresses a major problem in the region, which involves pollution from many different sources. More companies will eventually implement these methods, not only because the community and scientists demand it, but also because some leading companies are now implementing them.
The results presented in this article are very important because the two studied commercial additives showed very significant differences, even though their manufacturers claim to offer the same benefits. Regardless of the additives, the evidence certainly supports the fact that, for every chemical variation in the cement, mortar, or concrete used, a full study must be conducted to determine the actual interaction of the materials involved. The two superplasticizers were very representative for the studied cement formulations. However, they cannot be generalized to other materials or cements, since, despite the low content of these nanomaterials in the mix, they are very reactive and can easily affect a large number or properties; their influence in the mix can therefore be quite significant and chemistry-dependent.
The formulations of these superplasticizers are recommended in applications where it is necessary to use ultra-high-performance or ultra-high-strength cements or concretes, such as in skyscrapers, bridges, or infrastructure subjected to ultra-high stresses. Other applications may include prestressed girders, precast concrete piles, thin bonded overlays of bridge decks, and security and blast mitigation applications (Azmee & Shafiq, 2018). Moreover, they are appropriate when materials with complex chemistry must be incorporated in cement or concrete, such as waste, which may require tailoring the rheology or other material properties of the mix (Colorado et al., 2015; de Azevedo, Costa, et al., 2021; Florez et al., 2018, 2019). For example, these results can be useful to adapt the mix for natural fiber cement composites (de Azevedo, Marvila, et al., 2021; Quintero-Dávila et al., 2019) where properties such as viscosity need to be optimized in order to enable manufacturing with fibers. These results also contribute to applications involving additive manufacturing of cements, as rheology plays a key role in production, and typical formulations used in the industry do not work and need to be adapted as well (Vergara & Colorado, 2020). Certainly, the use of these superplasticizers contributes to using less water and cements, thus enabling more sustainable methods in new technologies (Colorado et al., 2020).
In the results of this this research, it is observed that additive 1 entails a better increase in the evaluated properties of the mortar, not only in fresh but also in hardened samples. The additive 1 content that proved to be more valuable during testing was 1,0 wt%. Coarse (larger) sand was selected for making the mortar mix as per the compressive strength results. Table 10 summarizes the reductions implied by these methods and materials: the water/cement ratio was reduced by 21,65 wt%, the amount of raw cement by 7,27wt%, and water by 27,34 wt%. With this dosage, the same tests were conducted for both fresh and hardened samples: the compressive strength was determined in samples released from the mold after 28 days of curing by applying a compression force of 58,87 ± 3,07 MPa. Fluidity was 121,86 wt%, and the air content was 4,9 wt%.
Table 10 Water and cement content reduction
| Component | Reference (without additive) | Modified (with additive) | |
|---|---|---|---|
| Water/cement ratio (W/C) | 0,485 | 0,38 | |
| W/C decrease (%) | 21,65% | ||
| Cement content (kg/m3) | 550 | 510 | |
| Cement decrease (%) | 7,27% | ||
| Water content (kg/m3) | 266,75 | 193,8 | |
| Water content decrease (%) | 27,34% | ||
Source: Authors
Figures 14 and 15 show that the mortar properties strongly depend on both the sand size and the additive type. This research confirmed that the use of superplasticizer additives delays the initial setting time and increases the final setting time in cement (Brooks et al., 2000). In addition, the air content in the mix changes depending on its fluidity; if the mix has a high fluidity, it has a low air content. Conversely, if it is too viscous, it has a high air content (Aïtcin & Flatt, 2015). Moreover, this study also revealed that the use of superplasticizers increases the fluidity of the mix, as reported before (Burgos-Montes et al., 2012; Sakai et al., 2006). The use of these additives increased the compressive strength, which agrees with previous research (Lohtia et al., 1995).
The naphthalene-based superplasticizing additives are adsorbed to the cement grains through their anionic groups (Lohtia et al., 1995). In addition, a part of these negatively charged groups remain in contact with the solution, giving the cement grains a net negative charge, which is responsible for an electrostatic-type repulsion between them (Mollah et al., 2000; Y. Zhang & Kong, 2015). In contrast, the adsorption of additives based on polycarboxylate occurs through carboxylate groups. The dispersion that these additives induce among the cement grains has been associated with an electrostatic repulsion (as in additives based on melanin and naphthalene) and fundamentally to a steric repulsion phenomenon that is related to the long sidechains of the ethers (Aïtcin & Flatt, 2015; Rivva, 2002). Considering the differences in properties obtained in this study for just these two additives, new technologies such as additive manufacturing (Revelo & Colorado, 2018) in the field of building materials could be substantially improved by the proper use of additives 1 and 2.
CONCLUSIONS
The size of the aggregate used in mortar mixtures has an effect not only on the liquid, fresh, unhardened mortar, but also on the hardened solid paste. When a fine sand is used, the fluidity increases, but the compressive strength of the mortar is reduced. On the contrary, when a coarse sand is used, the fluidity decreases, while the compressive strength increases.
The use of additive 2 (superplasticizer) improves the workability and increases the fluidity of the mixtures while keeping a W/C of 0,485, thus fulfilling the required conditions of a pumpable mortar. However, this does harm the compressive strength of samples with respect to the neat cement sample, even if the dosage is increased from 0,8 to 1,0 wt%.
The use of additive 1 has a greater efficiency at improving the several properties of the mix. As the dose increases from 0,8 to 1,0 wt%, the workability, fluidity, and setting time increase. This implies a decrease in porosity, and, therefore, the value of the compressive strength increases with respect to the reference sample. In addition, this superplasticizer can be used to reduce both the amount of water and raw cement powder. In this work, the W/C was reduced from 0,485 to 0,38. This also implied a reduction of 7,27% in cementitious material and of 27,34% in the amount of water needed. In addition, the reduced mixture meets the conditions of a pumpable mortar.
The use of the studied additives affected the degree of crystallinity of the portlandite and ettringite phases, which can lead to denser structures in the cement paste mixtures.
By implementing this research work and under the parameters herein specified, the amount of cementing material used by Conasfaltos can be reduced from 1.021.800 to 947.480 tons, which would decrease the production of gray cement by 74.320 tons and CO2 emissions by about 66.888 tons.
The chemistry of the additives influences the properties of cement, mortar, and concrete because these work in the solid-liquid interface of cement. Therefore, the functional groups that make up the chain of the additives must be taken into account since these are responsible for the adsorption process. This implies that any cement mix must be studied with each additive if an optimal material is desired.


