INTRODUCCIÓN
Current scientific studies show that there are three possible means of COVID-19 transmission: contact with contaminated surfaces, a respiratory route and possibly a fecal oral route (Allenet al.,2016). Regarding the respiratory route, the presence of the virus in droplets from sneezing (with a diameter of more than 5 μm) must be considered (Schibuola & Tambani, 2021). Those fall quickly to the ground, remaining in the air for a short period of time. The formation of smaller droplets (0.1 to 0.5 μm) must be considered too; these are aerosols that remain floating in indoor environments (Freire-Vinuezaetal.,2021). The virus can remain for hours in aerosols and a few days on surfaces. In indoor spaces, the spread of the virus by aerosols is greater than in outdoor spaces, with higher risks if ventilation is poor (Chenet al.,2021). It is important to ensure proper ventilation in indoor spaces (Quesada Carvajal et al.,2018). This ventilation can be natural or forced (using ventilation/air conditioning systems). Some recommendations by government/multilateral organizations specify that the minimum air renewal should be 30m3of clean air per hour per worker (Vorobioffet al.,2020). However, for health reasons, air currents with speeds greater than 0.25 m/s are not recommended for work in non-hot environments (Li & Tang, 2021).
CO2 concentration can be used as a good ventilation indicator (Zivelonghi & Lai, 2021). The atmospheric CO2 level is approximately 450 ppm and this value is taken as a reference level. On the other hand, the concentration of CO2 in exhaled air is in the order of 40000 ppm (Di Gilioet al.,2021). Therefore, a measurement of 850 ppm means that 1% of the air in a room was exhaled by a person (Persily & de Jonge, 2017). The indicator P, the probability of contagion, which is a function of the time of exposure to contaminated air, is used. See Eq. (1).
Where T is the exposure time, n is the number of people in a space, I is the number of people infected, σ(n) is 1 I fn >0, other wise 0, q is a unit of infection or a value determined as a function of activity and specific people (Satishet al.,2012). The variable f (see Eq. 2) is the fraction of air rebreathed, estimated based on the measured CO2 concentrationC, the exhaled concentration Ca and the concentration in open environments C0(García Alvarado et al., 2016).
Many organizations recommend a maximum threshold of 800 ppm (Tusmanet al.,2020). The UK Health and Safety Executive Agency in its guidance for air conditioning and ventilation during the Coronavirus pandemic recommends that CO2 measurements should be used as an indicator to indoor ventilation rather than treating them as safe limits (Ostroet al.,2000). Outdoor levels around400 ppm and indoor levels with a consistent CO2 value of less than 800 ppm are likely to indicate that a space is properly ventilated (Gil-Baezet al.,2021). In a similar way, the Argentine Ministry of Health says that “One strategy to indirectly assess the degree of indoor air tightness is CO2 (carbon dioxide) monitoring. It is recommended to increase how opened are doors and windows when the level of CO2 exceeds 700 ppm (parts per millions of air mass)” (Sanchez Quintero et al.,2021).
In buildings with no change on their ventilation rate, high CO2 concentrations have negative effects on decision making and working performance. At 1000 ppm, performance is significantly reduced in six of nine decision-making metrics compared to 600 ppm. At 2500 ppm CO2, performance is reduced in seven of nine performance metrics (Satishet al.,2012).
METHODOLOGY
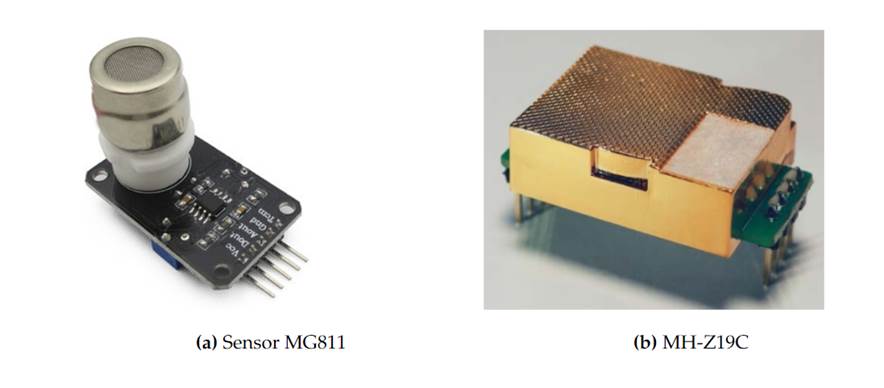
A small, portable, low cost and flexible gas monitor was designed and built. Electrochemical gas sensors model MG811 and infrared (IR) gas sensors model MH-Z19C (manufactured by Winsen) were used (see Fig.1).
The MG811 sensor works through an electrochemical reaction that occurs when carbon dioxide passes over the sensor (Shen, 2014). The output voltage is measured to estimate CO2 concentration, with 350ppm to 10000ppm detection ranges. The used sensors show good sensitivity and selectivity to CO2, low dependence to temperature and humidity, good stability and repeatability, and low-cost (Rodríguez et al.,2019).
The IR gas sensor is a general use sensor that utilizes NDIR (non-dispersive infrared) principles to detect CO2concentration in the air. It has good selectivity, temperature compensation and a long useful life (Massacaneet al.,2010). Measurements can be made via serial, analogical or PWM output; all of them work simultaneously. It combines a reliable IR absorption gas detection technology with low cost and a reduced size.
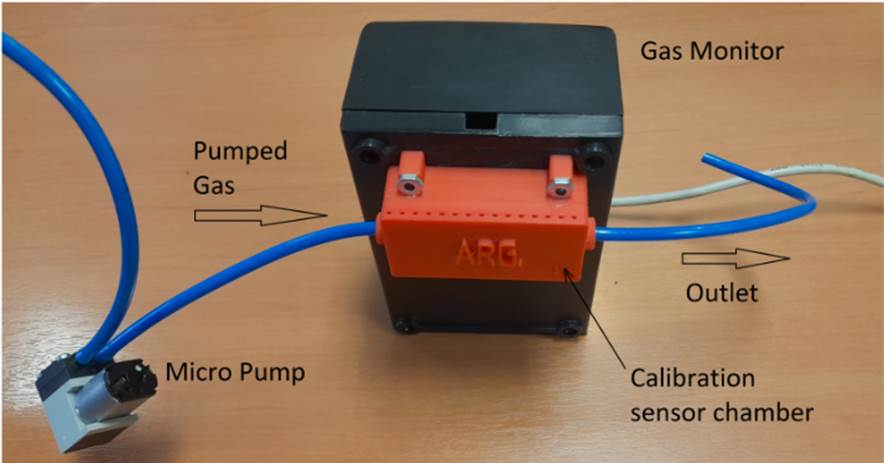
The gas monitor uses the previously mentioned sensors, and it can use up to eight sensors. It also has a simple calibration system which can set a reference level by means of a micro pump that circulates clean ambient or synthetic air (Acosta Pérez et al.,2016), as shown in Fig. 2. The calibration curve parameters are adjusted automatically by software, to indicate the concentration levels in ppm (Díaz,2021). Exhaled breath measurements were made on indoor conditions. It was also measured with a gas bench for sensor calibration that can mix CO2 and synthetic air in controlled flow and concentration conditions is available too. Fig. 2. Gas monitor with calibration sensor chamber Source: AuthorsCO2 monitor results are indicated on LCD display and via computer software. Optionally, wireless transmission can be added to display the results on cellphones.
CO2monitor results are indicated on LCD display and via computer software. Optionally, wireless transmission can be added to display the results on cellphones.
MG811 sensor calibration
The measured concentration can be calculated using Eq. 3:
Where:
c- CO2concentration in ppm
d- Constant equal to 400
v- Sensor voltage measurement in mV
a- A parameter adjusted during calibration with an initial value of 1500
b- Constant equal to 600
To calibrate the chemical sensor, a is calculated using Eq. 4:
Wherec1is the real concentration value. For example, for a well ventilated room it would be 400ppm.In practice, it is assumed that d=c1and in this case the adjustment equation will be:
If a decision is made to changec1thenbanddshould be changed using Eq. 6 and 7:
Once sensors are calibrated, the chamber is removed.
Gas bench
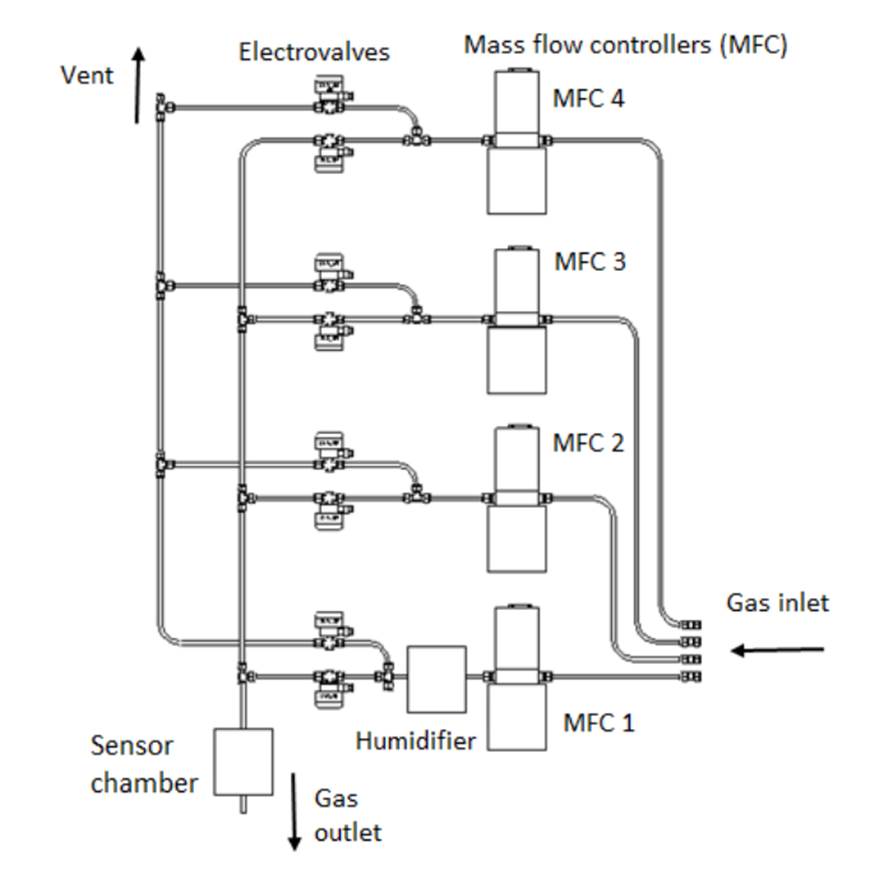
A gas bench was used to calibrate the sensors. This control system can mix different gases with precision; those gases flow through the sensor chamber described on the previous section. The system is controlled by a computer connected to a hardware controller. This hardware includes gas lines, four mass flow controllers (MFC), electro valves, humidifiers and a command module responsible for the gas mix with controlled caudal, humidity and concentration. Synthetic air (99.999%) and CO2(2000ppm) tubes provided by Indura Argentina S.A fed the bench.
Gas lines can provide a gas mix with controlled humidity at the desired concentration range. The mix procedure is accomplished with high precision thanks to the use of MFCs. Once the desired mix is obtained, it’s injected into a measurement chamber where sensors are located. The gas line has 4 input lines connected to high pressure tubes (see Fig. 3). Lines 1 and 2 are both connected to the synthetic air tube while lines 3 and 4 are connected to target gases/pollutants (in this case CO2). MFCs allow the flow of gas from a specific line through a voltage signal.
MFC connected to the second allows a 100cm3/min maximum flow and the MFCs connected to the other lines allow a 500cm3/min maximum flow.
The gas bench guarantees the purity of gas mixes injected into the chamber, controlling the flow and concentration of any external pollutant/gas connected to one of the lines. Fig. 3. Simplified gas line scheme. Source: own preparation Four MFCs (MKS instruments, model 1179A01352CS1BV) are used to control the flow of the lines.
Four MFCs (MKS instruments, model 1179A01352CS1BV) are used to control the flow of the lines with a 500/100cm3/min maximum range. Those MFCs adjust and measure the desired flow. An MFC command module model SDPROC Version 1.03, manufactured by Aalborg, is used to control and read the MFCs. This controller connects to the computer to send data and execute commands via an RS-232 to USB converter.
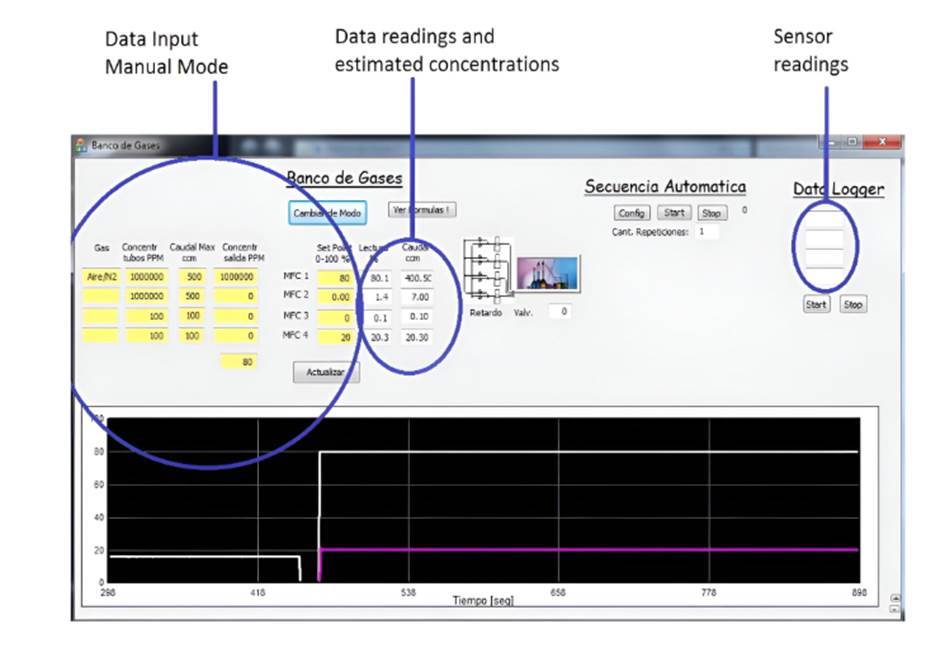
Software was developed to communicate with MFCs, register flows for each line, and control the closure and aperture of electro valves. The implemented algorithms calculate the value of those flows. Gas mix procedures can be automatized by setting concentration sequences. These sequences are composed of different mixes at different time intervals. Flow levels are plotted in real time. Gas sensors levels can be read at the gas monitor software interface and optionally through the gas bench software. Fig. 4 shows the bench’s graphical interface. The total flow, desired output concentrations, incoming flow levels, interval times and repetitions per sequence can be set.
Because the gas tubes have a specific gas concentration, the desired concentration of a gas to measure is achieved by diluting specific gases in a carrier gas (e.g., nitrogen, pure air, etc.). The proportion (for each gas to measure) of the configured total flow to the gas chamber is chosen in such a way that the diluted concentration is the desired one. This is done indirectly through MFC set points (percentage of the max flow of a tube), as seen in Eq. 8. The flow of carrier gas (therefore its set point, SP (1)) is constrained by the other flows and the configured total flow, as seen in Eq. 9.
Where:
i= 2,3,4 (gases to measure) ; i= 1 (carrier gas)
CT: configured total Flow
concentrout(i): desired output concentration for line i
concentr tubo(i): configured tube concentration i
C(i): Flow for MFC ip(i): Proportion of total flow for MFC i
CM(i): Max flow for MFC i (100 cm3/min if i=3,4 or 500 cm3/min if i=1,2)
SP(i): set point sent to MFC i, expressed in percentage
In this work, only two MFCs are used, one for CO2 and one for the carrier (pure air)
Gas chamber
The sensors were mounted in chambers made of plastic bottles, with inlet tubes to connect to the gas bench and outlet to the environment. Those tubes were sealed to avoid leakages (see Fig. 5). Small bottles were chosen to avoid the need for an excessive gas volume to fill the chamber.
Measurement procedures
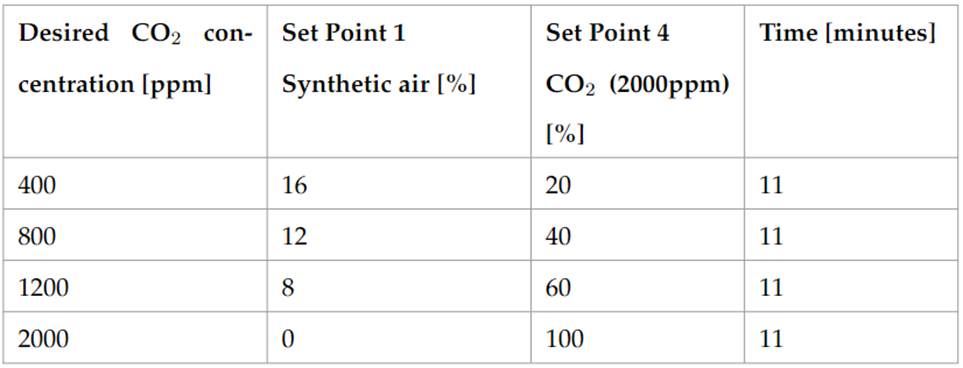
MH-Z19C sensor measurements were made injecting a mix of synthetic air and CO2 as it is shown in Table 1. The first step was a purge with conditions similar to well ventilated environments (400ppm). Later steps increment the concentration level up to the sensor’s limit detection range
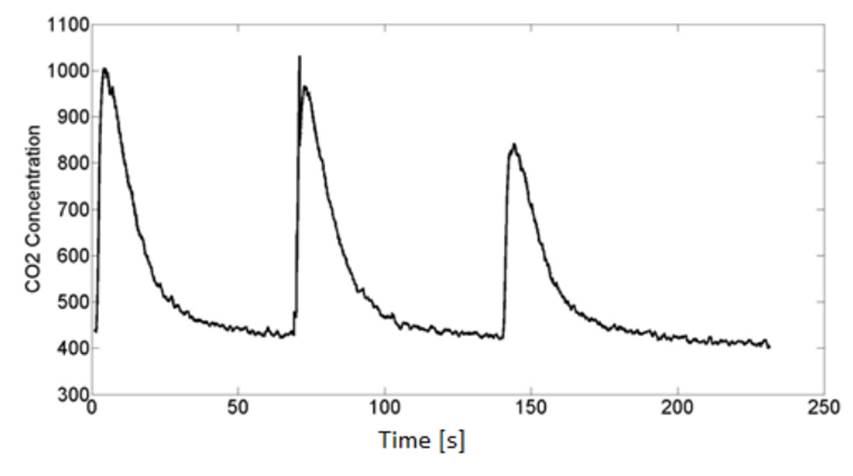
MG811 sensor measurements were made on an indoor environment, by exposing it to exhaled breath to observe the transient response of the sensor. The room where the measurements were made was properly ventilated and vacant (except for the person responsible for the measurement itself), and the sensor was blown repeatedly with 3 minutes’ pauses between every attempt, to be able to observe transient effects.
MHZ19C response can be seen in Fig. 6. Sensor response can be divided in three stages: an initial stage where air flows into the chamber replacing old air with a different concentration, a transient stage where the sensor reacts to the new concentration and a stationary stage where the current concentration level can be measured.
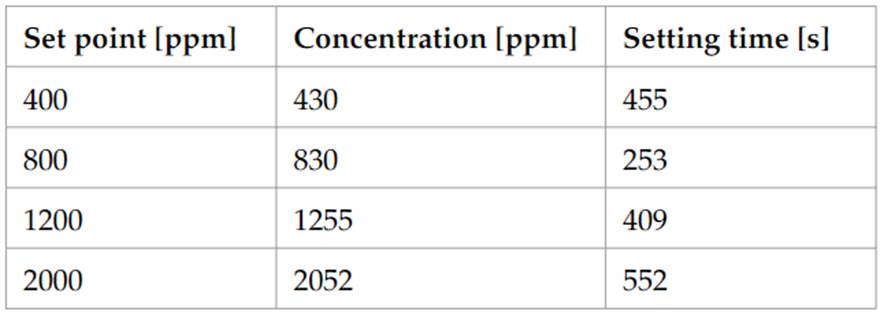
The measured concentrations and setting time can be seen in Table 2. Observed values are within the error margins given by the sensor accuracy (±50ppm+ 5%reading value) and MFC accuracy (1%max range).
MG811 response can be seen in Fig. 7. As expected, the signal is stronger after exposure to exhaled breath because of the increased CO2 levels, yet there are transient effects because of sensor saturation. Those effects can last a few minutes to wear off. The procedure is repeated 5 times obtaining adequate results
Table 2 Set point, setting time and measured concentration Source: own preparation
Source: own preparation
CONCLUSIONS
CO2 level is a good indicator of COVID-19 contagion risk on indoor environments. It is also important to analyze gas levels to avoid diminished labor performance. A low cost, flexible gas monitor for indoor environments like schools, offices, laboratories and industries was designed in this work. Gas sensors were calibrated using a gas bench, to improve measurement reliability. Gas monitors have an alarm that warns the need to ventilate the environment. Experimental work demonstrated that sensors have a satisfactory response for this application. As future work, it remains to study possible interfering substances that cause an increase in the signal produced by CO2 as false positives or in the event that the interferents displace CO2, as false negatives, in order to modify the correlation between the level of CO2 and the possible presence of COVID. Different models of sensors should be tested and their sensitivity and specificity compared to different gases should be compared.


