Introduction
Energy is considered a significant indicator of economic and social development for any nation [1]; the transport sector is the leading world's energy consumption, and it remains heavily reliant on fossil fuels, particularly petroleum-based liquid fuels [2]. In this context, the high energy demand, the depletion of fossil fuel reserves, and the increase of greenhouse gas emissions have led to the resurgence of alternative fuels such as biofuels. Nowadays, bioethanol and biodiesel have already been produced as alternatives [3]; bioethanol is usually made by fermenting the sugars in crops like wheat, corn (maize), sugar cane mash, or molasses, and in some more recent applications, switchgrass, or wood-derived biomass [4]. The bioethanol demand and production are increasing continuously, and it has a higher octane number, higher heat of evaporation than gasoline, and is predominantly considered renewable and environmentally friendly [5]. Additionally, ethanol from renewable sources can be used as an alternative fuel or an oxygenating additive to the current fossil fuels. The production of bioethanol from agricultural lignocellulosic waste can be sustainable and feasible.
Nevertheless, the availability of sugars for fermentation is low and needs pretreatment to fractionate and release fermentable sugars. The pretreatment of these materials changes the physical-chemical structure of the lignocellulosic biomass and improves the hydrolysis rate [6]. Several processes have been developed for the treatment of lignocelluloses, including hot water [7], steam explosion [8], ultrasound-assisted with acid treatment [9], alkali treatment [10], and enzymatic treatment [11]. These processes enhance the availability of sugars by increasing porosity and changing the crystallinity, which is critical in the subsequent bioconversion process to ethanol. However, the pretreatments of lignocellulosic materials are limited for the recalcitrance caused by high amounts of lignin. Pretreatments could be less expensive when substrates with low amounts of lignin such as Beta vulgaris monorosa, Beta vulgaris L. conditiva, and Beta vulgaris alttisima. In this sense, Mexico stands out with the red beet (Beta vulgaris L. conditiva) available all the year; then, beet can be used with the juice and bagasse for bioethanol production. In Mexico, the abundance of red beet in the country's central regions allows us to investigate the idea of using color industry processing residues. Furthermore, it is possible to use beets that do not meet commercial quality standards as a bioenergetic crop in Mexico.
On the other hand, Beta vulgaris L. can be saccharified to increase the availability of sugars because it has low lignin content, making the pretreatment less severe and cost affordable. The sugar beet pulp was characterized and reported with (%w/w): 30.55 cellulose, 25.92 hemicelluloses, 3.91 lignin [12]. Many pretreatment methods have been investigated for the hydrolysis of different Beta vulgaris or by-products of the industrially processed sugar beet. The ethanol production from sugar beet pulp hydrolysate is obtained by diluting acid pretreatment and Pichia stipitis yeast in Turkey [13]. Beet pulp was undergoing ammonia pressurization and hydrolyzed as described in the methodology [14]. Beta vulgaris cv. monorosa (fodder beet) was adjusted to pH 3 (partial hydrolysis) to inhibit bacterial contamination and was fermented to ethanol [15]. Some authors reported the effect of the factors: reaction time, substrate concentration, temperature, and speed stirring on the hydrolysis of sugar beet [16], [17].
With the available sugars, it is necessary to develop models to describe ethanol production using microorganisms; the analysis of rate equations for microbial growth, substrate uptake, and product formation facilitates the prediction of experimental conditions [18], [19].
Information regarding the influence of time, uptake of sugars, and biomass growth is still necessary to understand and improve ethanol productivity; mathematical models are valuable tools for this purpose. Several structured and unstructured mathematical models have been developed which attempt to describe the fermentation reaction. Using logistics, Pirt, and Luedeking-Piret equations , we can describe the fermentation of juice and hydrolysates of red beet bagasse [20], [21].
The present study aims to pretreat red beet bagasse using acid and alkali to improve the availability of sugars and describe quantitatively in the hydrolysates the microbial growth, substrate consumption, and ethanol production with simulation using data kinetics of red beet and logistic, Pirt, and Luedeking-Piret equations.
Materials and Methods
Experiments were carried out with H2SO4 and NaOH (conditions described in Table 1) to examine the influence of alkali and acid hydrolysis on Beta vulgaris L. bagasse (RBB). In addition, RBB was hydrolyzed in conditions of sterilization.
Table 1 Matrix design of hydrolysis a) acid; b) alkaline.
Source: Own elaboration
Red beet preparation. Samples of RBB were provided by a farmer from Hidalgo, Mexico, and kept frozen until used. RBB was washed and passed through an extractor hammermill (Moullinex A75312). The red beet was dried for 24 h at 70 °C and homogenized to quantify the mass concentration; then passed into a mill of 12-32 mesh size screens kept at 4 °C.
Experimental design/alkaline treatment. Selected factors and their levels for the experimental designs are shown in Table 1a. The experimental design consisted of three levels of alkali concentration (0.1, 0.3, and 0.5 N), three levels of time (24, 48, and 72 h), and three levels of mass (2, 4, and 6 g of dry RBB). The number of experiments was from run 1 to 27 of the matrix design (Table 1a). Experiments were carried out in 250 mL Erlenmeyer flasks, and each flask contained 50 mL of NaOH at different concentrations. All flasks were maintained at room temperature and static. Samples were collected filtered at regular intervals of time (24, 48, and 72 h).
Experimental design/acid treatment. Sulfuric acid was used for hydrolysis, and three different levels were applied, concentration (0.1, 0.3, and 0.5 N), pretreatment time (24, 48, and 72 h), and mass (2, 4, and 6 g of dry RBB). The number of experiments was from run 28 to 54 of the matrix design (Table 1b). The acid hydrolysis of RBB was similar to that used in the alkali treatment but using H2SO4.
Hydrolysis at sterilization conditions. Different concentrations of H2SO4 (0, 2, 4, 6, and 8 % v/v) were applied to determine the best concentration for the release of sugars; the reaction was carried out at sterilization conditions (11 min, 121 °C, 1 kg/cm2). The experiments were conducted in 250 mL Erlenmeyer flasks. Six grams of dry RBB were placed in 50 mL of H2SO4 of different concentrations (0, 2, 4, 6, and 8 % v/v), then were sterilized in an autoclave for 11 minutes at 121 °C/1 kg/ cm2, and kept overnight at 20 °C. Samples were filtered to determine total sugars with a modified phenol-sulfuric method and phenolic compounds [22]. The percent of hydrolysis was determined concerning the total sugars and the dry weight of red beet.
Analytical techniques. The moisture content of RBB was analyzed by heating a known weight at 70 °C for 24 h. Total sugar content was determined by the phenol sulfuric acid method using glucose as standard [23]. Glucose standard samples were prepared to establish the calibration curve. The acid hydrolysate was analyzed through HPLC Agilent (RID with column Bio-Rad HPX-87H), H2SO4 0.0045 N was used as a mobile phase. The phenolic compounds were determined by the Folin-Ciocalteu method [24]. Tukey and Dun-net test for multiple comparisons were used to find meaningful differences, while multivariate and effects between-subject tests were performed for the effect of interaction between factors. The SPSS statistical package (version 17) was used for all the statistical applications.
Modeling. The logistic, Pirt and Lue-deking-Piret equations can be used to obtain simpler ones to establish relationships between growth, substrate consumption, growth, and product synthesis. Eq. 1 is obtained by integration of the logistic equation, while eqs. 2 and 3 are obtained by dividing the Pirt, and Luedeking-Piret equations, respectively, by the logistic equation followed by integration, as demonstrated previously [20]:
Nomenclature
X biomass concentration/(g/L)
X 0 biomass concentration at t=0/(g/L)
t time/h
X max maximum biomass concentration/(g/L)
μ specific growth rate/hr-1
m max maximum specific growth rate/hr-1
S sugar concentration/(g/L)
S 0 sugar concentration at t=0/(g/L)
Y x/s biomass per sucrose yield/(g of biomass per g of sugar)
Y p/s ethanol per sugar yield/(g of ethanol per g of sugar)
m maintenance coefficient/(g of sugar per g of biomass per h)
P concentration of the product/(g/L)
Pi concentration of the product at t=0/(g/L)
α growth-associated coefficient for the product/(g of ethanol per g of biomass)
β non-growth-associated coefficient for the product/(g of ethanol per g of biomass per h)
Qp volumetric ethanol productivity/(g of ethanol per L per h)
The kinetic data of red beet juice fermentation is used to describe the sugar of hydrolysates using the Solver function of Microsoft Excel (Microsoft Corporation, Redmond, WA, USA); the simulation program was designed to achieve the minimal normalized error using the Solver function. Eqs. 1-3 were fitted to the experimental data to determine the kinetic parameters for microbial growth. The experimental data and those generated by the model were analyzed using regression curve fitting (Microsoft Excel) with statistical significance set at p=0.05. The kinetics data were obtained with Saccharomyces cerevisiae ATCC 9763 [24].
The kinetic data were used to simulate the fermentation of hydrolysates.
Results and Discussion
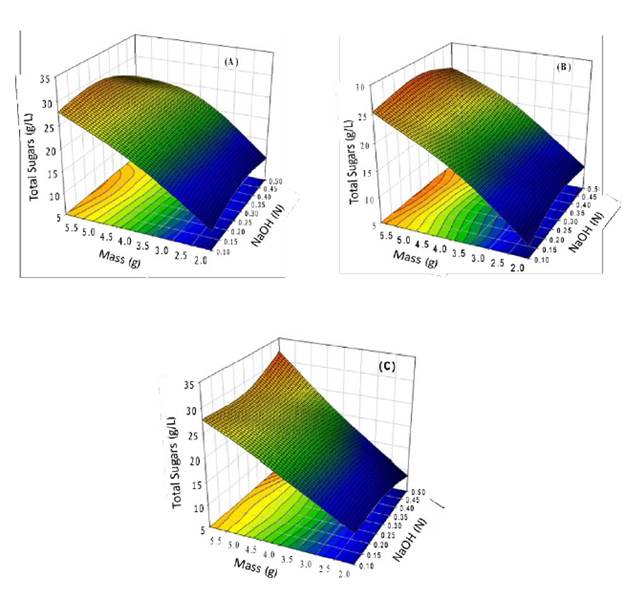
Effect of alkaline treatment. For alkali treatment, the release of sugars was increased with the increasing mass of RBB. During the alkali hydrolysis, two phases were formed, a solid phase and a gelatinous solution with characteristics like pectin. The pectin of sugars beet hydrolyzed by a simple alkali process can form gels [25]. The maximum concentration of total sugars was observed at 24 hours, 28 g/L, from 6 g of dry mass (RBB) at a concentration of 0.3 N NaOH; at a concentration of NaOH of 0.5 N were obtained 24.5 g/L (Fig. 1a). Multiple comparison tests (Tukey HSD) showed no significant (p < 0.05) differences between the different concentrations of NaOH. he evaluation of interactions between the concentration of NaOH and the mass of RBB on the total sugar release was analyzed by testing between-subjects effects. The analysis showed significant (p < 0.05) differences in the mass substrate due to the release of sugars at 24 h and the increase of substrate in the experiments. he NaOH-mass concentration showed no significant (p < 0.05) differences in the release of the total sugars. his behavior suggests that in alkali pretreatment, the first reactions are solvation and saponification; this causes a swollen state of the biomass and makes it more accessible. In the reactions carried out with high alkali concentrations, the degradation and decomposition of dissolved polysaccharides occurred [26].

Source: Own elaboration
Fig. 1 Alkaline treatment, the effect of mass, and NaOH concentration on RBB: a) 24 h, b) 48 h, and c) 72 h. The experiment was conducted at room temperature and without a stir. The experiment provides data of maximum total sugars at different times of reaction.
At 48 hours of reaction, the hydrolysis value was similar to that at 24 hours; hence there is no time effect on hydrolysis of bagasse (Fig. 1b). Usually, a significant fraction of the lignin is solubilized together with some of the hemicelluloses. A large fraction of the hemicellulose's sugars is usually recovered as oligomers. Alkaline pretreatment breaks the bonds between lignin carbohydrates and disrupts the lignin structure, making the carbohydrates more accessible [27]. The lignin content on sugar beet is less than 3 % [28]; the conditions for the release of sugar with alkali were reduced by the scarce surface internal (porosity available) due to the low lignin content in the RBB. For this reason, the reaction of NaOH was reduced to the surface area of RBB and not at the internal area inside of the porous matrix that is generated in other substrates with higher lignin content [29].
Fig. 1c shows the alkaline hydrolysis of RBB at 72 hours. he maximum concentration of total sugars was 32 g/L from 6 g of mass dry at a concentration of 0.5 N alkali. The interaction between the mass and alkali concentration was determined by test between subjects; the test shows that at 72 hours of reaction, the hydrolysis was significantly increased (5 g/L) than at 24 h. The increase of internal surface identifies the phenomenon that occurs with alkaline treatment on biomass, swelling, a decrease of polymerization degree and crystallinity, destruction of links between lignin and other polymers, and breakdown of lignin. he contact between the alkaline medium the RBB was the factor for the sugar increase from 27 to 32 g/L at 48 and 72 hours, respectively. However, the 32 g/L generated from bagasse can be used for ethanol production because they are cheap and renewable sources.
Effect of acid treatment. The production of total sugars during the acid treatment is presented in Fig. 2. The release of sugars increased with the increase of acid concentration until 0.5 N. The maximum concentration of total sugars was 27 g/L which corresponds to 24 h of reaction, 6 g of dry mass, and 0.5 N acid concentration (Fig. 2a). The test of multiple comparisons (Tukey HSD) showed no significant (p < 0.05) differences between concentrations of acid from 0.1 to 0.3 N. This may be due to the short time of contact between the substrate and the acid in all the preparations. For the concentration 0.5 N, the test shows significant differences, which can be due to the effect of time and higher acid concentration.

Source: Own elaboration
Fig. 2 Acid treatment, the effect of mass, and acid concentration on RBB: a) 24 h, b) 48 h and c) 72 h. The experiment was conducted at room temperature and without a stir. The experiment provides data of maximum total sugars at different times of reaction.
For the effect of substrate, the ANOVA indicated significant positive differences in the release of sugar at 24 h. In the evaluation of interactions of both factors (concentration of acid and mass of RBB) on the hydrolysis, the between-subjects effects test was used; this analysis shows a significant (p < 0.05) difference of substrate on results of the released sugars at 24h. Tis later analysis must be taken as a reference to consider in interactions between factors. Te interaction between mass and acid concentration favored hydrolysis by increasing the contact area of the particles of RBB; the external surface increased with the addition of mass.
Fig. 2b shows the effect of the RBB mass and acid concentration on hydrolysis after 48 hours.
Te maximum concentration of total sugars was 35 g/L, 30 % higher than that obtained at 24 hours of reaction. At 48 hours, the hydrolysis reaction was significantly increased from 4 and 6 g of mass.
With increasing mass (from 4 to 6 g) and reaction time (from 24 to 48 hours), the hydrolysis is incremented by the attack of acid on both surface area of RBB and matrix porous generated during hydrolysis. Some reports suggested that the matrix of lignocellulose should be broken heterogeneous to reduce the cellulose's crystallinity degree [29]; also, the hydrolysis reaction is a heterogeneous reaction that affects all the porous matrix, and structure changes as a function of time.
Fig. 2c presents the hydrolysis profiles of RBB at 72 hours. Te concentration of total sugars was 38 g/L. Te interaction between mass and acid concentration shows the interaction of factors. In 72 hours of reaction, the hydrolysis was significantly increased, 8.5 % higher than that obtained at 48 hours. With the multivariate test (Wilk's Lambda), the concentration of acid and mass of rbb have significant effects. Also, the increase in reaction time affected the hydrolysis due to the dissemination of acid to the matrix internally and the increased surface porous, which is consistent with the result obtained in this work, where the particle size was reduced and the effect of the mechanical treatment, together with the factor evaluated, favors the release of total sugars.
Hydrolysis using dilute acid (0.1-0.3 N) at 24 h was slow (8 g/L); however, increasing acid concentration and the reaction time, the concentration of total sugars released was 37 g/L. So, the effect of acid pretreatment was more evident with the increase of time (72 h). To date, there are no reports on the hydrolysis of Beta vulgaris L; but, using sugar cane bagasse [30], the optimal conditions obtained were 0.5 % of H2SO4,121 °C, 1 kg/ cm2 in an autoclave; yielding the concentration of a total sugar of 24.7 g/L. Te reaction time range was 15-240 min, but the energy used in the hydrolysis conditions was higher than this work. Te best condition of hydrolysis of RBB was obtained with acid treatment. While in alkali treatment, the solubility of pectin provoked separate phases (gelatinous and solid) on the reaction medium; this is detrimental to the total sugar release due to the decreasing the interaction between catalyst and the substrate. HPLC analysis of carbohydrates from hydrolysates shows the main composition of glucose 20.9 % and fructose 68.1 %; meanwhile, sucrose was not found. Hence, products of RBB like glucose and fructose can be fermented by yeasts, for example, Saccharomyces cerevisiae, strains that can ferment glucose, and fructose without inhibition by the substrate.
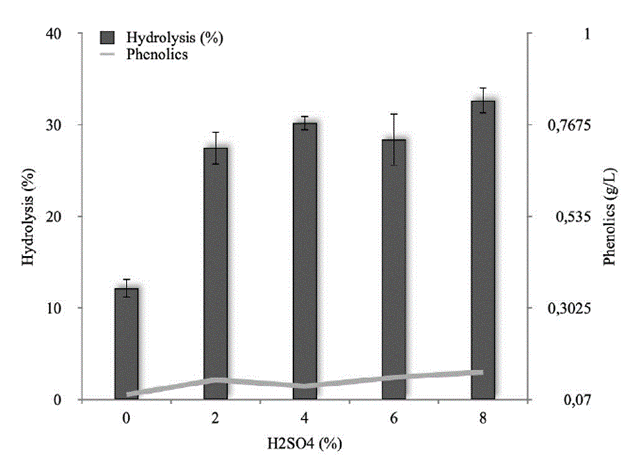
Hydrolysis at sterilization conditions. Hydrolysis of RBB in extreme conditions (autoclave) was 12 and 32 % in control (without acid) and with acid, respectively. The test of Dunnet indicated significant (p < 0.05) differences between the control and the treatments. With 2-8 % of acid, the hydrolysis conditions show no significant differences. At 2 %, the medium can be used for hydrolysis of RBB with autoclave conditions at 11 minutes (Fig. 3). Under high temperature and pressure conditions, hydrolysis processes generate by-products that are inhibitors compounds for the microorganism in the fermentation of sugars.

Source: Own elaboration
Fig. 3 Hydrolysis of RBB at sterilization conditions. Continuous line phenolics compound.
The total concentration of sugars released in the process of hydrolysis, and the own juices of the red beet, are sugars available to improve the process fermentatively. The salts formed during neutralization can be used in the culture media for the fermentation to ethanol. Harnessing autoclave conditions, time reaction extension, and acid catalysts can generate the best conditions for the pretreatment and reduce energy uptake.
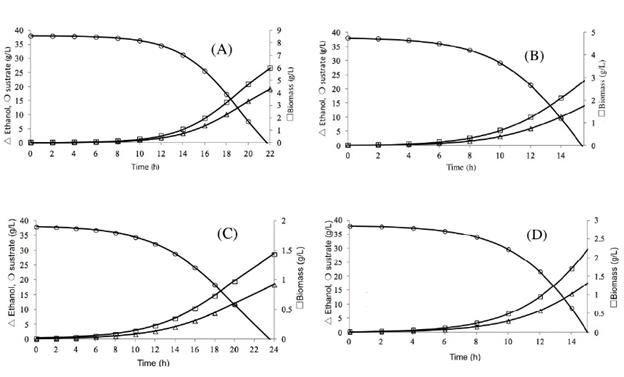
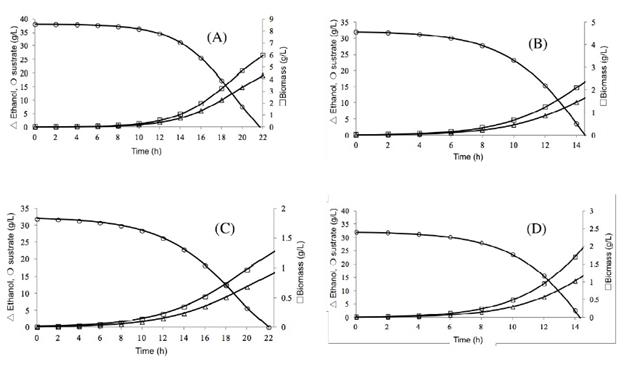
Modeling. The profile of ethanol production, growth of biomass, and sugar consumption are obtained with the simulation of hydrolysates acid and alkaline red beet juice by S. cerevisiae ATCC 9763, Figs. 4 and 5, respectively. The ethanol production by S. cerevisiae ATCC 9763 was obtained between 16 and 24 h; the production of ethanol estimate by the model was 15 to 18 g/L with hydro-lysates of acid treatment; however, the theoretical yield was 78 to 92 y by Saccharomyces cerevisiae. At an experimental and industrial level, only between 87-95 of the theoretical yield of ethanol is reached in the fermentation [31].

Source: Own elaboration
Fig. 4 Fermentation of hydrolysates acid of Beta vulgaris L. Ethanol production, sugar consumption, and growth of Saccharomyces cerevisiae ATCC 9763. pH 2.8 and 30°C (A); pH 5.5 and 30°C (B); pH 2.8 and 37 °C (C), and; pH 5.5 and 37 °C (D).

Source: Own elaboration
Fig. 5 Fermentation of hydrolysates alkaline of Beta vulgaris L. Ethanol production, sugar consumption, and growth of Saccharomyces cerevisiae ATCC 9763. pH 2.8 ans 30°C (A); pH 5.5 and 30°C (B); pH 2.8 and 37 °C (C), and; pH 5.5 y 37 °C (D).
The ethanol production by S. cerevisiae ATCC 9763 was obtained between 14 and 22 h, the production of ethanol estimate by the model was 12 to 15.5 g/L with hydrolysates of alkaline treatment, the variability of these results can be explained by the initial concentration of sugar, due to theoretical yield were 73 to 94 y, both yields are similar.
These simulations of hydrolysates show that the production of ethanol is growth-associated at different conditions of fermentation. The biomass, product, and substrate profiles by S. cerevisiae ATCC 9763 were similar. It is essential to point out that this mathematical model could predict the fermentation under simulation using fermentation data kinetics of red beet juice. A mathematical model is a tool, and the fitted values of its parameters are valid for the conditions used in this study.
Conclusion
From the data, the reaction time mass of RBB in the reaction medium is a critical factor in the hydrolysis process; the acid pretreatment also vital achieves better yields than the alkaline pretreatment. The concentration of NaOH had a more negligible effect on the hydrolysis, and the mass of RBB and the reaction time are factors to obtain significant hydrolysis of RBB. The equations used to simulate the fermentation of hydrolysates could estimate the yield of ethanol, uptake of sugar, and growth of biomass under different conditions.


