INTRODUCTION
Weeds represent a major problem for the agricultural sector worldwide because they can cause losses in yield of more than 80% (Cousens and Mortimer, 1995). Despite the fact that weeds represent a serious problem, agricultural practices have been directed in recent years towards insect control (Labrada and Paper, 2003), causing almost no impact on reducing weed biodiversity (Pakeman et al., 2020). Consequently, new strategies in the field that help minimize weed diversity while maintaining or increasing the crop production level are needed (Seppelt et al., 2013; Barzman et al., 2015).
The biodiversity of weed communities within a crop is related to the types of tillage systems, fertilization plans, and influence of environmental conditions in the area (Fried et al., 2008; Pinke et al., 2012). The application of these plans or variations in physicochemical conditions in soil have been shown to act as limiters of weed diversity in crops (Storkey et al., 2010). Therefore, the frequency and diversity of weeds and their relationship with different physicochemical conditions and soil agricultural practices should be studied in the interest of agroecosystem conservation (Power 2010; Smith et al., 2010; Rassam et al., 2011; Travlos, 2013).
Agricultural practices can positively or negatively influence the frequency and diversity of weed species (Travlos, 2010). One of the most common practices is tillage, which has a negative effect on weed species diversity but increases the frequency of lagging species (Melander et al., 2013; Santín-Montanyá et al., 2013). While the effects of mechanical agricultural practices may result in increased weed frequencies, differentiations in soil nutrient concentrations and availability greatly affect weed populations (Murphy and Lemerle, 2006). Variations in major nutrients (i.e., N, P, K) have shown, worldwide, that a change in concentrations in crop soil can generate significant changes in the population dynamics of weeds because of dependence on nutritional balance (Gu et al., 2007; Storkey et al., 2010; Huang et al., 2013; Cheimona et al., 2016).
The objective of this study was to determine the composition and frequency of weed species in relation to physicochemical variables in soil for a peach crop of Prunuspersica L. var. Rubidoux.
MATERIALS AND METHODS
Area of study
Soil samples were taken from a peach crop on the Tunguavita farm of the Universidad Pedagógica y Tecnológica de Colombia, located in the municipality of Paipa at an altitude of 2,470 m a.s.l., 5º45' N - 73º06' W, with an average annual temperature of 14.1ºC, average rainfall of 966 mm and average relative humidity of 74.9%, with a bimodal rainfall regime with the sampling being near the beginning of the second rainy season (Ideam Station No. 2403517). Four ha were dedicated to the peach (Prunus persica L.) Rubidoux variety, with a planting density of 1,500 trees and a planting distance of 5×5 m. This study only had access to half of the crop (i.e., 2 ha). The area has soil with less anthropic influence on land use changes and entry and management in the crop. This makes this zone one of the most stable in terms of physicochemical and biological conditions throughout the year. General phytosanitary management for the crop is based on the collection of crop residues (i.e., fallen leaves, flowers and fruits), reduction of insecticide application and nutrition of zone (Puentes and Castro, 2012).
Field phase
Within this area (2 ha), a total of twenty 10×10 m quadrats were used, spaced at regular intervals of 20 m (Mbong et al., 2020). The sampling distribution was carried out in this way in order to obtain a greater homogeneity of the terrain to be evaluated for both the physicochemical variables and the weeds to be classified. In each quadrat, a 200 g soil sample was taken, stored, and sent to the laboratory for subsequent physicochemical analysis (Ubom et al., 2012). In each quadrat, weed plants were enumerated and grouped into morphospecies. Specimens of each morphospecies were collected, pressed, and transferred in paper bags and plastic containers to ensure hygienic conditions to the laboratory for correct identification. Within each quadrant, at the weed observation point, a photographic record was taken to determine the vegetation cover of each of the weed species. The photographs were taken at 1 m, with a wide-angle lens and a focal length of 10-20 mm, in each of the quadrants.
Laboratory phase
For each of the soil samples, the analysis of the physicochemical variables were carried out in the laboratory of at the Universidad Pedagógica y Tecnológica de Colombia, with the methods proposed by the Instituto Geográfico Agustín Codazzi (IGAC, 2006) where the following were analyzed: pH ratio 1:1, %OC Walkey - Black method, %OM = %OC * 1.724, real density was calculated using the pycnometer method, bulk density was calculated using the ring of known volume or cylinder, gravimetric humidity percentage (GH) at 105ºC for 24 h and volumetric humidity (VH) is the product of the gravimetric humidity by the value of the bulk density.
The taxonomic identification was carried out with the help of a vascular plant catalog and the use of weed identification books for Colombia and the Neotropics (Zubizarreta and Díaz, 2014; Bernal et al., 2015; Lorena et al., 2018). The taxonomic classification and geographic distribution were confirmed using the International Plant Names Index (IPNI, 2021).
Statistical analysis
In order to quantify the patterns of weed composition and the influence of physicochemical variables of the soil, the following statistical analysis were carried out. The frequency and coverage of each species in the quadrants (Pp1-20) in the peach crop were determined. A canonical correspondence analysis (CCA) was performed to evaluate the possible relationships between the relative frequency of weeds and the evaluated soil physicochemical variables (González et al., 2008). To compare the groupings (taxonomic-physicochemical) of the weed communities and soil conditions, a Tanglegram was constructed using the similarity distances obtained with vegan package version 2.5.6 (Oksanen et al., 2013). All statistical analyses and tests were performed using the vegan library of the RStudio program (Team R., 2015). Frequency is a useful index for monitoring and comparing plant community changes over time (Bonham, 2013). The relative frequency was calculated by relating the sampling unit to the number of species using the following formula (Travlos et al., 2018) (Eq. 1):
RESULTS AND DISCUSSION
The lowest pH value (5.35) was in the Pp15 sample, and the highest (7.07) value was in the Pp13 sample. For the bulk density and real density, the lowest values were observed in the Pp13 and Pp4 samples, respectively (1.4 and 2.53 g cm3), while the highest values were observed in Pp7 and Pp16 samples, respectively (1.93 and 2.72 g cm3). For the %GH and %VH variables, the lowest values were found in the Pp14 and Pp1 samples, respectively (20.42 and 33.42), and the highest values were in the Pp10 and Pp11 samples, respectively (35.09 and 56.78). Finally, for the % OC and % OM data, the lowest values were found in the Pp1 and Pp2 samples (0.28 and 0.49), and the highest values were found in the Pp5 sample (2.47 and 4.26) (Tab. 1).
Table 1. Physicochemical variables of the peach crop soil for each sample. The high and low values of each variable are shown in bold.
| Sample quadrant | pH | Bulk density (g cm3) | Real density (g cm3) | % GH1 | % VH2 | % OC3 | % OM4 |
|---|---|---|---|---|---|---|---|
| Pp1 | 6.26 | 1.58 | 2.6 | 21.44 | 33.42 | 0.28 | 0.49 |
| Pp2 | 6.46 | 1.67 | 2.66 | 21.61 | 35.73 | 0.28 | 0.49 |
| Pp3 | 6.97 | 1.74 | 2.59 | 23.33 | 40.02 | 1.01 | 1.75 |
| Pp4 | 6.54 | 1.68 | 2.53 | 24.68 | 39.45 | 1.84 | 3.45 |
| Pp5 | 5.66 | 1.52 | 2.45 | 25.78 | 38.69 | 2.47 | 4.26 |
| Pp6 | 6.45 | 1.72 | 2.64 | 25.84 | 43.15 | 1.65 | 3.14 |
| Pp7 | 6.87 | 1.93 | 2.71 | 25.99 | 49.71 | 0.28 | 0.49 |
| Pp8 | 5.66 | 1.53 | 2.54 | 29.68 | 44.82 | 0.87 | 1.49 |
| Pp9 | 5.62 | 1.69 | 2.59 | 30.4 | 49.42 | 0.68 | 1.35 |
| Pp10 | 5.56 | 1.81 | 2.62 | 31.78 | 56.78 | 0.73 | 1.25 |
| Pp11 | 5.96 | 1.63 | 2.61 | 35.09 | 56.42 | 2.32 | 4.01 |
| Pp12 | 6.45 | 1.54 | 2.6 | 34.1 | 45.32 | 2.15 | 3.78 |
| Pp13 | 7.07 | 1.4 | 2.62 | 24.84 | 34.56 | 2.03 | 3.5 |
| Pp14 | 6.55 | 1.64 | 2.6 | 20.42 | 38.69 | 1.06 | 1.83 |
| Pp15 | 5.35 | 1.67 | 2.58 | 33.78 | 55.66 | 1.6 | 2.76 |
| Pp16 | 5.56 | 1.71 | 2.72 | 29.26 | 49.55 | 0.28 | 0.49 |
| Pp17 | 5.59 | 1.68 | 2.68 | 30.14 | 50.15 | 0.98 | 1.42 |
| Pp18 | 5.62 | 1.66 | 2.63 | 31.64 | 52.03 | 1.11 | 1.92 |
| Pp19 | 5.64 | 1.65 | 2.7 | 30.98 | 50.18 | 1.04 | 1.65 |
| Pp20 | 5.66 | 1.64 | 2.72 | 30.26 | 48.93 | 0.87 | 1.49 |
| Mean | 6.07 | 1.65 | 2.62 | 28.05 | 45.63 | 1.18 | 2.05 |
| SD | 0.5 | 0.11 | 0.07 | 4.44 | 7.34 | 0.71 | 1.25 |
1 Gravimetric humidity; 2Volumetric humidity; 3Organic carbon; 4Organic matter.
A total of 13 weed species were found, distributed in 10 families and 8 orders (Tab. 2 and Fig. 1). The family with the highest number of species was Asteraceae (Sonchus oleraceus L., Taraxacum officinale F.H.Wigg., Gamochaeta coarctata (Willd.) Kerguélen.and Conyza bonariensis (L.) Cronquist.); while the families Oxalidaceae, Fabaceae, Caryophyllaceae, Chenopodiaceae, Poaceae, Cyperaceae, Plantaginaceae, Polygonaceae and Apiaceae had only one representative species. The contribution of the family Asteraceae was 30.79% of the total species reported (Tab. 2).
Table 2. Taxonomic classification of the weeds found at each sampling site within the peach crop.
| Class | Order | Family | Genus | Species |
|---|---|---|---|---|
| Magnoliopsida | Oxalidales | Oxalidaceae | Oxalis | Oxalis corniculata L. |
| Fabales | Fabaceae | Trifolium | Trifolium repens Walter. | |
| Caryophyllales | Caryophyllaceae | Stelleria | Stellaria media Cirillo. | |
| Chenopodiaceae | Chenopodium | Chenopodium murale L. | ||
| Asterales | Asteraceae | Sonchus | Sonchus oleraceus L. | |
| Taraxacum | Taraxacum officinale F.H.Wigg. | |||
| Gamochaeta | Gamochaeta coarctata (Willd.) Kerguélen. | |||
| Conyza | Conyza bonariensis (L.) Cronquist. | |||
| Liliopsida | Poales | Poaceae | Pennisetum | Pennisetum clandestinum Hochst. ex Chiov. |
| Cyperaceae | Kyllinga | Kyllinga brevifolia Rottb. | ||
| Lamiales | Plantaginaceae | Veronica | Veronica pérsica Poir. | |
| Caryophyllales | Polygonaceae | Polygonum | Polygonum segetum Kunth. | |
| Apiales | Apiaceae | Coriandrum | Coriandrum spp. L. |
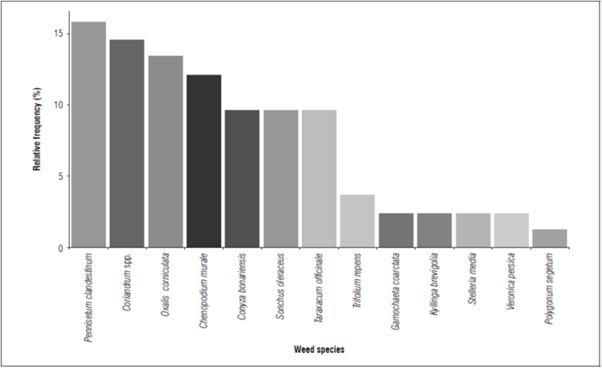
Figure 1. Frequency of observation of each species in relation to the total number of sites sampled.
The results obtained in the samples of the peach crop had a frequency greater than 50% of the samples for the weed species P. clandestinum, Coriandrum spp., O.corniculata, and C.murale (Fig. 1). While, the weed species G.coarctata, K. brevifolia, S.media, V.persica and P.segetum presented a frequency of less than 10% in the samples; the latter had a frequency of less than 5% (Fig. 2).
Soil physicochemical conditions and plant nutrient absorption capacity can be regulated to a large degree by management within the crop (i.e., input plans, type of fertilization, agricultural practices) (Allan et al., 2015). These effects result in increased agricultural production yields in a crop, as well as changes that favor or disfavor weed communities (Allan et al., 2015). An example is weed communities generally tend to be more diversified in high input cropping systems (i.e., peach crops) (Gough et al., 2000; Suding et al., 2005; Bilalis et al., 2010). But several studies have found that this is not the only relationship between physicochemical conditions and weed diversification; it has been shown that agricultural practice types and management intensity are fundamental components in variations in weed diversity and frequency (Hyvönen et al., 2003; Santín-Montanyá et al., 2013). The latter especially favors the appearance of weed species that are rare (van Elsen, 2000; Bengtsson et al., 2005; Vasquez et al., 2008).
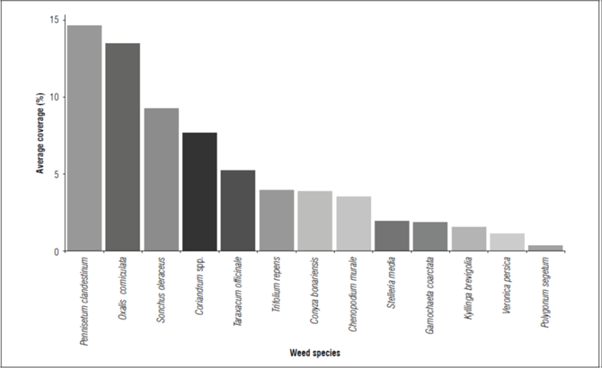
The average coverage (AC) values for the weed species in the peach crop had patterns that were similar to those of the species frequency (Fig. 1). Although the species P. clandestinum and O. corniculata presented average coverage values greater than 10%, the species that presented a high frequency, such as Coriandrum spp. and Sonchusoleraceus, presented values below 10% for the average coverage (Fig. 2). The weed species T. repens, C.bonariensis, C.murale, G.coarctata, K.brevifolia, S.media, V.persica and P. segetum had average coverages of less than 5%; T.repens, C.bonariensis, and C.murale very low coverages in relation to their frequency (Fig. 1-2).
One of the limiting factors in structuring weed communities within a crop has always been the availability of primary nutrients and organic matter (Berner et al., 2008). The demand for these nutrients is not only determined the crop's conditions but also by the total biomass of weeds near the crop's fertilization zone and the main plants (Blackshaw et al., 2005; Sweeney et al., 2008). At the same time, physical soil conditions such as compaction, actual density, and bulk density have effects on the distribution and germination of weed seeds, and the amount of N that is assimilated by plants has an effect on weed seed mortality (Davis, 2007). In turn, since differences in nutrient availability and concentration appear to have a significant effect on weed density, frequency, and diversity, it has been shown that practices (i.e., tillage and fertilizer type) have a significant effect, and that, depending on the practice, the community structuring will be different (Bilalis et al., 2010; Travlos, 2010; Bilalis et al., 2012).
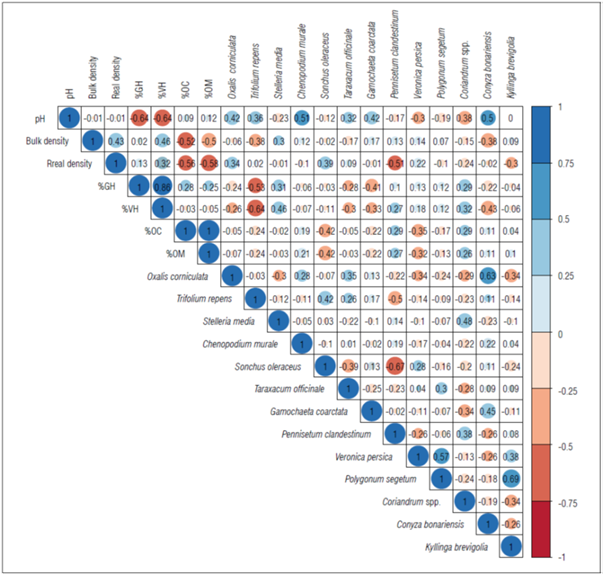
The correlation matrix (Fig. 3) revealed mean and significant values of correlation coefficients between the soil physicochemical properties and weed frequency in the study sites. The matrix showed that mainly %OC and %OM correlated negatively and significantly with the bulk density and real density of the soil (-0.58 and -0.56), while, on the contrary, the %VH, %GH and pH correlated positively and significantly with the organic carbon and organic matter values. Likewise, the weed species, such as P. clandestinum, correlated negatively and significantly with the soil density (-0.51). While, G. coarctata correlated negatively and significantly with the %VH and %GH (-0.41 and -0.33) (Fig. 3). On the other hand, C. murale showed a positive and significant correlation with pH (0.51). In general, the regressions of the weeds showed moderate, positive and negative values in relation to the physicochemical characteristics of the soil. However, among the same weeds, the values were mostly negative, an indicator of possible interspecific exclusion (Fig. 3).
The weed composition in the study area showed groups of plants growing together in similar or favorable conditions. This effect was demonstrated with patches and variations of densities within the sampling quadrats, an effect reported in other types of crops (Okezie and Agyakwa, 1998; Ogbemudia and Mbong, 2013; Mbong et al., 2020). Species such as P. clandestinum, G. coarctata and C. murale, which are variable in frequency and coverage, presented variability in the physicochemical conditions of the soil. This suggests an effect of competition and nutrient availability, leading to competition between soil patches, an effect similar to that reported in wild grasslands (Ubom et al., 2012; Mbong et al., 2020). This effect can be persistent and favorable for weed eradication in crops.
The analysis of canonical correlation showed the correlation between the physical-chemical variables of the soil and the frequencies of the weed species. The structure of the factors showed that the relationship between the percentage of gravimetric humidity, volumetric humidity, and pH levels were the soil variables that better explained the distribution of the weed frequency. The correspondence analysis showed a negative association between T.officinale, O.corniculata, C.bonariensis, S.oleraceus and T.repens species with the percentage of gravimetric and volumetric soil moisture. The species V.persica, K.brevifolia and P.segetum were negatively associated with the variables %OC and %OM, and the other species had a relationship with low values for pH and real density, along with average values of %OC, %OM %VH and %GH. Therefore, the possible relationships between the physical-chemical and biological variables of the soil were causal to the intrinsic characteristics and adaptive competences of weed-weed and weed-crop (Fig. 4).
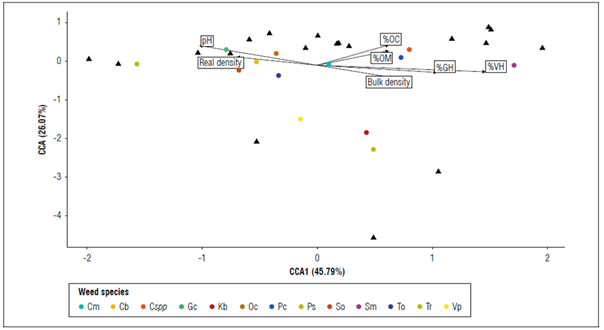
Figure 4. Canonical Correspondence Analysis (CCA), relationship of weed species with physicochemical factors in the peach crop sampling sites. The black triangles correspond to the sampling points and the colored dots correspond to the weed species obtained. Cm, Chenopodium murale; Cb, Conyza bonariensis; Cspp, Coriandrum spp.; Gc, Gamochaeta coarctata; Kb, Kyllinga brevifolia; Oc, Oxalis corniculata; Pc, Pennisetum clandestinum; Ps, Polygonum segetum; So, Sonchus oleraceus; Sm, Stellaria media; To, Taraxacum officinale; Tr, Trifolium repens; Vp, Veronica persica.
Regardless of whether the types of agricultural practices positively or negatively affect community structure, several studies have shown that the physical conditions of soil, which can be greatly modified by the tillage type, have an effect on the density and coverage of weed species in a crop (Nichols et al., 2015), which has been studied and reported by several authors (Coffman and Frank, 1992; Buhler, 1995). Recently, the presence and cover of weed species have been directly correlated with systems that affect soil physical conditions (Thomas et al., 2004; Grey et al., 2015). But weeds have physiological and adaptive mechanisms that increase diversity and frequency when tillage is suspended or interrupted (Sheley et al., 2011).
To explore the relationship between the taxonomic and physicochemical patterns observed among the soil samples, dendrograms were constructed from the dissimilarity distances to Bray-Curtis of the taxonomic composition of weeds (Fig. 5A) and compared in a tanglergram with the dissimilarity distances to Bray-Curtis of the physicochemical variables of each sampling point (Fig. 5B). With the exception of 2 samples, Pp1 - Pp2, the tanglergram did not show any significant congruence between the grouping of the samples based on the taxonomic composition with the physicochemical variables of the weed species (Fig. 5). This result suggests that weed community structuring in crop soil samples is largely mediated by soil physicochemical conditions. However, it was observed that sites with similar physicochemical conditions, such as Pp5,4,6, and 13, presented very different weed compositions, which could indicate that uncontrolled external factors, such as micronutrients and interspecific competition, could also be fundamental in community structuring (Fig. 5).
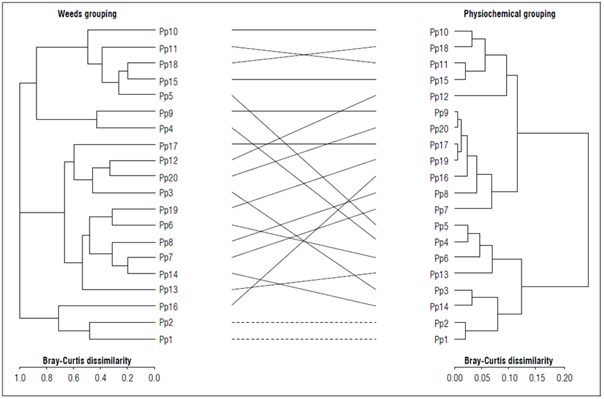
Figure 5. Taxonomic-physicochemical Tanglergram of 20 soil sampling sites. Left: Dendrogram of the taxonomic composition of weeds in each sampling site. Right: Dendrogram of the physicochemical variables of each sampling site. The lines connecting the terminals of the dendrograms indicate the contrasting position of each site in the two dendrograms, and the dotted lines indicate the sampling sites that were grouped the same way in the two dendrograms. The dendrograms were obtained from the Bray-Curtis distance.
It has been shown that the effect of soil physicochemical conditions in a crop can have a direct impact on weed community structure, but it has also been shown that patterns of relationships between these factors can generate patterns of diversity in a crop community (Little et al., 2015). These patterns of weed diversity have been reported as variations in densities, composition, frequency, and frequency between sampling sites (Ni et al., 2017). Our results and other studies support the hypothesis of interspecific competition between weeds (Mbong et al., 2020), which indicates homogenizing factors, such as essential macronutrients and soil physical conditions in the adult stages of crops, that increase the interspecific competition of weeds and lead to manual control for remaining species as the sole purpose of strengthening productivity and health in a crop (Ugen et al., 2002; Travlos et al., 2018; Mbong et al., 2020; Pakeman et al., 2020).
CONCLUSION
The structuring of the weed communities for the work site within the peach crop showed patterns of frequency and coverage that can be explained by the intrinsic conditions of each of the study plots. This relationship may be mainly due to the assimilation capacity of macronutrients, physical characteristics of the soil, such as density and compaction, and ecological aspects, such as interspecific competition. The groupings of the sampling zones given by the physicochemical conditions showed different groupings with respect to the biological attributes, which supports the idea that patterns of species distribution respond to a relationship with the set of physicochemical aspects, competition for nutritional resources, and conditions extrinsic to the crop. Therefore, our study is not only a pilot to further explore the structuring of weed communities within an agricultural crop but also allows us to propose other types of weed management studies using physicochemical information and interspecific competition.


