1. Introduction
Stratified reservoirs, whose layers or strata have diverse properties, originate due to changes in energy in depositional environments [28]. Studies on these types of systems were first performed in the 1960s. [21] conducted a study on composite stratified reservoirs, i.e., without crossflow. They derived analytical solutions for this type of reservoir, assuming that the porous volume is filled with a compressible fluid. The authors noted that in an unsteady state, the most permeable layer depletes at a faster rate than the least permeable layer. However, when a steady state is reached, all layers contribute equally to the total reservoir production. Through curves from theoretical pressure buildup tests, they indicated the extent of reservoirs with more than two layers and presented field examples where they applied their analytical solutions. They found that it was not possible to determine the individual properties of the layers from a pressure buildup curve.
[24] conducted the first study that relates the change in pressure as a function of time to parameters that allow the characterization of reservoirs. An analytical solution that allows extrapolating and estimating the static pressure of the reservoir was proposed; however, this study did not consider fluid compressibility. [23] presented a method for calculating effective permeability from pressure buildup tests. This model considers a uniform formation and a compressible liquid, including biphasic flow. Additionally, [17] developed a method for the estimation of permeability from the slope of the semilog plot. These studies constituted the theoretical basis for the analysis of pressure tests as indicated by [22]. [5] presented a method of interpreting pressure tests, whose basis lies in the rate of change of pressure over time. This study was an important advancement in the interpretation of pressure tests because it was found that the pressure derivative allows a simple and precise distinction of the flow regimes present in the recorded pressure data.
[29] conducted a simplified study of a two-layer horizontal reservoir being depleted by wells completed in both layers. This work did not consider crossflow, that is, the layers only presented communication through the well. Assuming steady-state conditions, they developed simplified analytical solutions with a lower error than the solutions developed for the unsteady state. They reported that the production rate of the well greatly affects the relative depletion of the layers.
[27] and [18] developed the first studies for multilayer crossflow reservoirs. They first developed an analytical solution for a cylindrical reservoir composed of two layers, in which the porous volume is a fluid of constant compressibility. The system is assumed to have a drilled well in the center. They found that for a well producing at constant-pressure conditions, once the unsteady state has been achieved, production declines exponentially. On the other hand, for wells that produce at constant-rate conditions, during the unsteady state, the pressure-time ratio declines linearly. They also reported that during initial production time, a multilayer reservoir with crossflow behaves like a commingled multilayer system, concluding that a multilayer crossflow reservoir can be modeled as a single-layer reservoir, whose properties are the average properties of all layers.
[18] also developed Bessel and Fourier series analytical expressions for the distribution of pressure and flow rate. They demonstrated the applicability of their method by extending the analytical solution of the pressure distribution for cases where more than two layers are present.
[19] developed a numerical model to assess the effect of reservoir stratification on pressure response in flow-restricted wells. They derived equations to determine the appropriate duration of flow and pressure buildup tests in stratified reservoirs. On the other hand, [20] presented methods for determining the individual damage factors and flow capacity of each layer for an infinite reservoir with two layers without crossflow; however, the method can be extended to cases where crossflow occurs. Furthermore, [6] developed a new model for radial and linear incompressible flow in stratified reservoirs. He evaluated the effect of crossflow on the pressure response and reported the causes of crossflow for a single phase. He also established criteria for the consideration of crossflow during reservoir assessment. The model developed is known as a semipermeable wall model. He found that when a low permeability layer between the layers is not present, the system can be treated as a single-layer system whose permeability corresponds to the average permeability of all layers and the width of the system corresponds to the sum of the layer thicknesses.
[4] developed the double permeability model for multilayer reservoirs with crossflow. He reported that multilayer systems with crossflow do not respond exactly to the heterogeneous reservoir model used to model naturally fractured reservoirs, that is, the double porosity model. He found that the pressure responses of multilayer crossflow reservoirs correspond to intermediate cases between homogeneous reservoirs and double porosity models with interporosity flow conditions. [26] evaluated the pressure response for a two-layer crossflow reservoir, they reported the possibility of estimating the damage factors of each layer from the production data, having used the concept of thick skin to evaluate these types of reservoirs.
[7] studied both cases of stratified systems, i.e., with crossflow and commingled. They presented an analytical solution for a reservoir with n homogeneous layers where crossflow may or may not occur. They included wellbore storage effects for cases where the reservoir is infinite and or has boundaries. [25] conducted a detailed study of the effect of permeability, vertical permeability, skin factors, wellbore storage, layer order, and boundary conditions on pressure response in crossflow multilayer reservoirs. [2] developed an analytical solution for multilayer reservoirs from existing single-layer reservoir solutions, taking into account crossflow between layers. The model was validated using a field example. [1] presented a method for calculating the dimensionless storativity ratio in multilayer deposits with crossflow. Analytic expressions were generated from the separation of the two straight lines presented in the semilog plot of pressure as a function of time. He performed the validation of the information using examples of cases of multilayer reservoirs.
[28] developed the maximum effective hole-diameter model for multilayer crossflow reservoirs in response to the instability in the dual permeability model. That is, the maximum effective hole-diameter model is stable for both positive and negative values of the skin factor. This model was reported by [16] and is the model that will be used in this work for the application of the TDS technique [30], with the aim of a better and practical characterizing of multilayer reservoirs with crossflow. [12] also applied the TDS technique for the interpretation of pressure tests for a two-layer commingled system separated by a stratum of low permeability. The model was successfully validated using two synthetic examples.
[30] presented a method that allows reservoir characterization without the use of type curves. The method is known as the TDS technique and is both practical and accurate. This method uses characteristic points and lines found on the pressure and pressure derivative log-log plot. Some studies are mentioned regarding this method: [8] applied the TDS technique for the interpretation of pressure tests in naturally fractured reservoirs. The method allows a complete characterization of this type of reservoir, as it allows the calculation of parameters necessary for their characterization, such as dimensionless storativity ratio and the interporosity flow parameter, whose correlations were generated by relating the values of these with characteristic values and lines. [11] extended the application of the TDS technique to cases of naturally fractured and elongated deposits. The method was validated with field data and synthetic data. [14] applied the TDS technique to the analysis of variable flow tests for homogeneous and heterogeneous gas fields. Through simulation runs, the accuracy of the method was demonstrated and verified by synthetic examples. Detailed extension of the TDS technique for different cases has also been reported by [9], [10], and [13].
A multilayer reservoir model with all layers being complete, proposed by [16], is employed here to simulate several scenarios and develop the TDS technique for this case. The expressions developed were successfully applied to field examples.
2. Mathematical model
[16] presented the Laplacian solution for a well in a two-layer reservoir with crossflow, where both layers are completed:
where,
Variable b in Eq. (3) defines the boundary type. Eq. (10) corresponds to an infinite reservoir, Eq. (11) to a reservoir with a constant pressure limit, and Eq. (12) to a closed reservoir. Note that k = 1,2.
The dimensionless permeability, dimensionless storativity ratio, and flow capacity ratio are obtained by the following:
The dimensionless pressure of layer j, dimensionless pressure derivative, dimensionless radius, dimensionless time, and dimensionless wellbore storage coefficient are defined as follows:
3. Formulation
3.1. Dimensionless semipermeability, λ
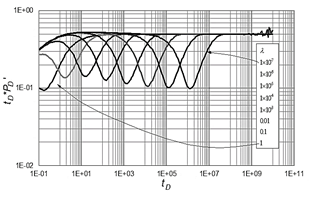
With a variation in the dimensionless semipermeability in a range from 0.1 to 1x10⁻⁷, the pressure derivative curves reported in Fig. 1 were generated. In Fig. 1, it can be observed that the decrease in the value of the dimensionless semipermeability generates a decrease in the value of the minimum (with respect to the axis of the pressure derivative) and its displacement to the right.
Source: Authors
Figure 1 Pressure derivative response for different dimensionless semipermeability values
As seen in Fig. 2, a direct relationship exists between the dimensionless semipermeability parameter and the minimum dimensionless time, which allows the formulation of the following correlation:
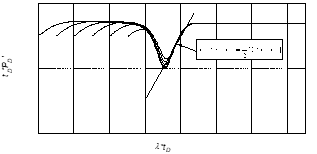
In order to provide an interpretation procedure, it is necessary to find a relationship between the semipermeability, pressure derivative, and time. To do so, the affected parameter, which is time, is multiplied by the dimensionless permeability raised to a given power, which is found by either trial and error or using a mathematical procedure as outlined by [15]. The unified pressure derivative behavior is given in Fig. 3, from which the following equation is obtained:
Source: Authors
Figure 3 Unified pressure derivative response for different dimensionless semipermeability values
Plugging Eqs. (17) and (19) into Eq. (22) and solving for the dimensionless semipermeability yields the following:
Intercepting the straight line defined by Eq. (22) with the late radial flow line, which is a horizontal line that intersects in one half, allows the obtainment of another method for estimating the dimensionless semipermeability:
After replacing the dimensionless time defined by Eq. (19), the following is derived:
3.2. Dimensionless storativity coefficient, ω
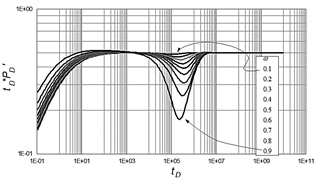
To evaluate the effect on the pressure and the pressure derivative responses of the dimensionless storativity coefficient, pressure derivative curves were generated by varying the dimensionless storativity coefficient across a range from 0.1 to 0.9 as reported in Fig. 4.
Source: Authors
Figure 4 Pressure derivative response for different dimensionless storativity coefficient values
Fig. 4 shows that increasing the value of the dimensionless storativity coefficient generates a decrease in the value of the minimum of the transition zone with respect to the axis of the pressure derivative.
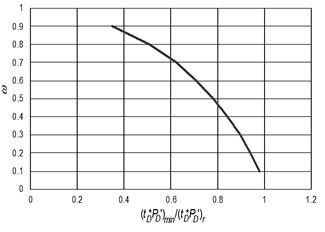
When plotting the dimensionless storativity coefficient as a function of the ratio of the value of the pressure derivative of the minimum of the transition zone with the value of the pressure derivative in the radial flow of the late time (see Fig. 5), we found a correlation that allows the estimation of this parameter with a coefficient of determination of 0.9999999743, that is, Eq. (24).
Source: Authors
Figure 5 Dimensionless storativity coefficient as a function of the ratio of the minimum pressure derivative value and the pressure derivative during late radial flow regime
Once this value is calculated, it is possible to obtain the individual value of the dimensionless storativity coefficient of the other layer or the other group of layers using Eq. (27).
3.3. Capacity ratio, γ
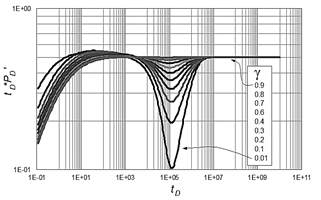
Similarly, the effect of capacity ratio variation on the pressure derivative response in a multilayer crossflow reservoir was evaluated. The variations were made in a range from 0.01 to 0.9. Fig. 6 indicates that the increase in the value of capacity ratio generates a decrease in the value of the minimum of the transition zone with respect to the axis of the pressure derivative.
Source: Authors
Figure 6 Pressure derivative response of a multilayer crossflow reservoir to changes in the capacity ratio
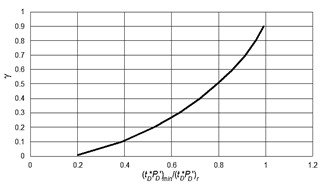
After plotting the capacity ratio as a function of the relationship of the value of the minimum pressure derivative of the transition zone and the value of the pressure derivative at the late radial flow regime (see Fig. 7), a correlation was found that allows the calculation of the capacity ratio with a coefficient of determination of 0.999981509, that is, Eq. (28).
Source: Authors
Figure 7 Capacity ratio as a function of the ratio of the minimum pressure derivative value in the transition zone to the value of the pressure derivative during the late radial flow zone
The individual capacity ratio of the other layer or the other group of layers can be calculated using Eq. (29):
Examples
The expressions developed in this study were evaluated using data reported by [1], [4], and [16]. [1] developed correlations for the calculation of the dimensionless storativity coefficient ω in a crossflow reservoir and, in turn, proposed two examples. The schematics of the systems used in Examples 1 and 2 are illustrated in Tables 1 and 2. Example 1 is evaluated by [1] based on the results obtained by [4].
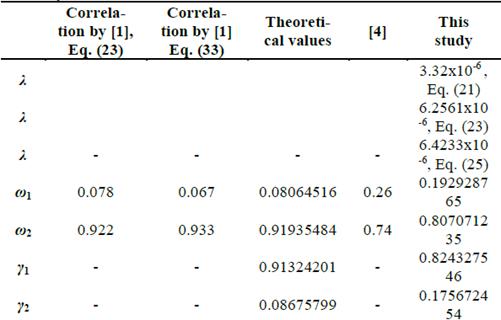
Table 3 Results of example 1 using Eqs. 38 and 48 developed by [1] and compared to the theoretical values, the values reported by [4], and the values obtained in this study
Source: Authors
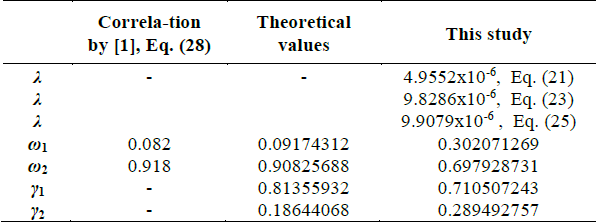
Table 4 Results of example 2 of [1] and their comparison with the theoretical values of the parameters and the results obtained in this study.
Source: Authors
Figs. 8 and 9 show the log-log plots of the pressure derivative versus time for examples 1 and 2, respectively. Table 3 shows the results obtained by [1], the theoretical values, the values reported by [4], and the values obtained using the TDS methodology for Example 1. Table 4 shows the results obtained for Example 2.
The theoretical values were calculated using Eqs. (13), (14), and (15).
When applying the TDS technique, the value calculated using Eq. (26) was found to correspond to ω 2; this implies that the storativity coefficient value calculated by Eq. (27) corresponds to ω 1. A similar case occurred in the calculation of capacity ratio, where the value calculated using Eq. (28) corresponds to γ 2, and the value calculated using Eq. (29) corresponds to γ 1.
Table 5 Results from the double-permeability model by [4] and the results from this study

Source: Authors
As for the example of case 1, the theoretical values were calculated using Eqs. (13), (14), and (15). Like example 1, it was found that the results generated by Eqs. (24) and (26) correspond to the values of ω 2 and γ 2. In his study, [4] evaluated the double permeability model with a real-field case (see Fig. 10). Table 5 shows the results reported by [4] and those calculated using the expressions developed in this study.
Again, it is pointed out that by calculating the dimensionless storativity coefficient and the capacity ratio, the values calculated using Eqs. (25) and (2) correspond to the values of ω 2 and γ 2, respectively.
5. Comments on the results
As for the case of the naturally fractured parameters, the results obtained from the worked examples can differ in an order of magnitude. However, the authors consider that the results are very acceptable compared to those obtained from other sources. The unit-slope line during the transition period was not very well defined in all the worked-out exercises. Therefore, the minimum point should be used for these cases for the calculation of the dimensionless semipermeability (Eq. 21).
Synthetic examples were also worked out but not reported here for lack of space. As expected, the simulated results are much closer to the input simulation values. It is also worth mentioning that [3] developed the TDS technique for two-layer reservoirs, where the total transmissibility of the formation can be determined from the late radial flow regime. Thus, if the capacity of each layer or group of layers is known, it is possible to determine the transmissibility of each layer.
Based on the foregoing, the application of the correlations generated in this work can provide a more precise characterization of multilayer reservoirs compared to the characterization that can provide double porosity or double permeability models.
6. Conclusions
1. The TDS technique was extended to multilayer reservoirs using the model of [16]. Most of the expressions developed correspond to empirical correlations applicable to field examples. The results obtained are close to results reported from other sources. However, using correlations, it is not possible to determine the layer or group of layers to which the calculated parameter belongs.
2.The correlations developed here can be used together with the TDS technique described by [3] for a more complete reservoir characterization because, in late radial flow, the total transmissibility of the formation can be determined. By knowing the capacity of each layer or group of layers, it is possible to know the transmissibility of each layer.


