


 English (pdf)
 Article in xml format
 Article references
 Send this article by e-mail
 Cited by SciELO
  Cited by Google
  Similars in
SciELO
Similars in
SciELO  Similars in Google
 Permalink
INTRODUCTION
In the period from 1993 to 2018, the area harvested of citrus fruits in Mexico increased 60.79% with oranges and lemons being the most important citrus fruits (Pérez & Nava, 2021). By 2019, Mexico allocated 845,805 ha to citrus production (FAOSTAT - Organización de las Naciones Unidas para la Agricultura y la Alimentación. Base de datos por cultivo, 2021), and it ranked second as an exporter of these products in 2021 (SIAP - Servicio de Información Agroalimentaria y Pesquera, 2022). The main citrus fruits grown in Mexico are orange (Citrus sinensis Osbeck), Persian lime or Persian limon (seedless) (Citrus latifolia Tan.), Mexican green or bitter lemon (Citrus aurantifolia L.), yellow or Italian lemon (Citrus lemon) and grapefruit (Citrus paradise Macfad) (SIAP, 2022).
There are about 110,000 ha planted with Persian lemons in Mexico (SIAP, 2022). Veracruz is the state with the largest planted area and the highest production volume (52,990 ha and 858’602,000 tons, respectively), with a yield of 16.43 t ha-1. Nayarit stands out for being the state with the greatest productive potential for this citrus (412,691 ha) (SAGARPA - Secretaría de Agricultura y Desarrollo Rural, 2012), and which, in turn, has grown 68% in the last 10 years. The yield obtained in Mexico is below that reported by FAOSTAT (2021) for countries in the Americas, such as the United States of America (34.6t ha-1), Argentina (33.6t ha-1), and Brazil (25.7t ha-1). Among the factors that propitiate low yields is the poor follow-up to cultural practices, such as nutrition management or harvest scheduling.
The nutritional status of fruit trees can be evaluated indirectly with a chemical analysis of the soil or directly through leaf analysis (Volke-Haller et al., 2017; De Mello-Prado & Rozane, 2020). The latter is considered to indicate the current nutritional status of fruit trees (Matsuoka, 2020), and considering that leaves are indicators of tree health, their analysis allows for diagnosing a specific problem, monitoring nutritional status, and adjusting fertilization programs (Shunfeng et al., 2018).
Leaf nutrient content is affected by factors such as soil texture and fertility level, water management, nutrition management, rootstock, grafted variety, etc. Likewise, fruit yield and quality are affected by rootstock (Machado et al., 2017) and chemical fertilization (Castricini et al., 2017). Some studies in citrus evidenced that rootstocks have an effect on leaf nutrient content, for example, in 'Rio Red' grapefruit and 'Satsuma' mandarin (Yıldız et al., 2018). In 'Kinnow' mandarin in India, it was reported that the rootstocks Rough lemon, Karna Khatta, Citrange Carrizo, Rangpur lime, Citrange Troyer, Jatti Khatti, and sour orange significantly influenced leaf mineral composition, with potassium (K), calcium (Ca) and magnesium (Mg) content being higher in plants grafted on Rough lime, while the concentration of nitrogen (N), phosphorus (P), iron (Fe), zinc (Zn), manganese (Mn) and copper (Cu) was higher in those grafted on sour orange (Kumar et al., 2018).
Nutrient accumulation is considered a continuous process during the growing season, and its uptake depends on the nutrients related to that particular growth stage (Freire-Cruz et al., 2019). That is why the age of leaves affects their nutrient content. Such is the case of citrus in Florida (USA), where as leaves age from spring to fall, the concentration of N, P, and K decreases while that of Ca and Mg increases, and around four to six months of age, they present relatively stable concentrations of nutrients (Morgan et al., 2017). For apple, peach, persimmon, fig, mandarin, and grape in Japan, the existence of an important seasonality in mineral nutrition in these is suggested, mainly for N and P. In addition, the concentration of P and K was found to be low during fruit formation, especially in temperate species, where the greatest difference occurs between spring and summer, while in the case of mandarin, these variations were not so significant (Freire-Cruz et al., 2019). Other chemical compounds, such as carbohydrates (Freire-Cruz et al., 2019; Liu et al., 2018), and tannins, also show significant differential storage between seasons, even within the same species (Liu et al., 2018).
There are some recommendations on the age and time to collect leaves for nutritional analysis. Some authors point out that for citrus, leaves should be 4 to 6 months old and be from spring sprouting (Obreza et al., 2020). In crops such as apple, it was reported that the analysis of leaves collected early in the growing season (28 days before full bloom) determined the status of N, P, K, Ca, Mg, Zn, Mn, and B, but not Fe or Cu (Uçgun & Gezgin, 2017). In Mexico, currently, for the citrus-growing regions of Veracruz and Nayarit, there is no information on the timing of foliar sampling to diagnose the nutrient status of orchards. Given the usefulness of having an appropriate date, the objective of the present study was to determine the period of nutritional stability in Persian lemon leaves in Nayarit and Veracruz, and to define the appropriate time to perform foliar sampling for nutritional diagnosis in two vegetative flushes.
MATERIAL AND METHODS
Orchard and tree characteristics. In 2017, rainfed Persian lemon orchards of productive age were selected in Nayarit and Veracruz (Table 1). The nutrition management was in charge of the producers, so, in Nayarit, the orchard El Ocotillo was fertilized to the soil with 500 g per tree of the chemical fertilizer: 12 N, 8 P2O5, 16 K2O, 3 Mg, 0.06 Fe, 0.01 Zn, and 0.02 B. In Veracruz, in the Paso Largo orchard from September 2015 to February 2016, 764 g N, 147 g P2O5, 100 g K2O, 22 g Ca, and 26 g Mg were applied to the soil per tree, and in the Grupo Exportador orchard from December 2017 to March 2018, 262 g N, 96 g P2O5, 96 g K2O, 126 g CaO, 166 g MgO, and 48 g SO4, per tree, were applied to the soil. In each orchard, 20 visibly healthy trees of similar size, without apparent nutrient deficiencies and without damage by pests and diseases, were selected. Each tree was marked on the trunk with a consecutive number from 01 to 20.
Table 1 Municipality, name, planting density, age of trees and geographical coordinates of orchards.
| Municipality | Orchard | Trees (per ha) | Age (years) | Latitude N | Longitude W |
|---|---|---|---|---|---|
| Nayarit | |||||
| Santa Ma. del Oro | El Ocotillo | 178 | 5 | 21°12’51.8’’ | 104°38’41.8’’ |
| Veracruz | |||||
| San Rafael | Paso Largo | 416 | 7 | 20° 08’33.2’’ | 97° 00’ 59.5’’ |
| Mtz. de la Torre | Grupo Exportador | 208 | 10 | 20o03’17.2’’ | 96° 59’ 53.5’’ |
Soil sampling and analysis. In each orchard, five soil subsamples were obtained from 0 to 30 cm depth from the drip area of each five out of the 20 trees selected. The five subsamples were combined and formed a composite sample that was analyzed in a NAPT-The Soil Science Society of America accredited laboratory for fertility. Texture, pH (1: 2 water) (McLean, 1982), organic matter by the Walkley and Black method (Walkley & Black, 1934), N-inorganic (Dahnke, 1990), P-Bray (Bray & Kurtz, 1945), K, Ca, Mg and Na with ammonium acetate (Doll & Lucas, 1973), Fe, Zn, Cu, and Mn by the DTPA method (Lindsay & Norvell, 1978), and B by the hot water and Azomethine-H method (Bingham, 1982). With the exception of P and B, which were determined on a Genesis 20® spectrophotometer (Thermo Scientific, Madison, USA), the rest of the nutrients were quantified with an ICAP 7200® spectrophotometer.
Vegetative flushes. In each of the 20 trees in each orchard, 50 shoots from two growth flushes were marked with plastic strips. In Nayarit, shoots from the winter (started in August 2017) and summer (started in January 2016) growth flushes were marked. In the Veracruz orchards, shoots from the winter growth (started in October 2017) and spring growth (started in February 2018) were marked.
Leaf sampling. Leaf sampling began when the leaves of each sprouting completed their growth before acquiring the dark green color and leathery consistency characteristic of a mature leaf. Sampling was carried out on a monthly basis until completing 10 for each flush and each orchard, starting with the trees identified with even numbers and then continuing with the odd numbers. In each sampling, 20 to 25 healthy and complete leaves were taken from each of the five trees, located in positions four or five from the apex to the base of the shoot. The collected leaves were placed in a cooler and transferred to the laboratory for processing and subsequent shipment.
Leaf analysis. Leaves were washed with tap water, then with electro-pure water, and finally with distilled water. They were dried with blotting paper and dehydrated in a Lab-line 3488M Imperial V digital oven (Vernon Hills, USA), with forced air at 70°C, until a constant weight was achieved. The composition of macro and micronutrients in the foliar samples was analyzed in a laboratory accredited by the NAPT Program (The Soil Science Society of America). The determination of N-total was by semi-microKjeldahl digestion (Carlson et al., 1990), and for NO3, the colorimetric method was used (Baker, 1967). K was extracted by the atomic absorption method using an ICE 3000® atomic absorption spectrophotometer (Thermo Scientific, Cambridge, UK). The P, S, Ca, Mg, Cu, Fe, Mn, and Zn were extracted by ICP-optically coupled plasma (Haung & Schulte, 1985) using an ICAP 7200® spectrophotometer (Thermo Scientific). The B was determined by colorimetry (Wear, 1965) with a Genesis 20® spectrophotometer (Thermo Scientific).
Nutrient evolution. The results of the foliar analysis were subjected to quality control with the Boxplot Procedure of the Minitab 17 Statistical Software (Minitab, 2021). In the case of Veracruz, the data from the two orchards were processed as a single set. Subsequently, and based on the methodology reported by Salazar-García et al. (2015) , daily predicted values were calculated, using the days of leaf life as the independent variable and nutrient content as the dependent variable. The general equation was: nutriment= β0 + β1D + β2D2 + β3D3 + β4D4 + β5D5. Where D= days after sprouting and β= mathematical coefficients. For each nutrient, the best mathematical function was selected by order of response (first through sixth order) with the Stepwise SAS/STAT procedure (SAS Institute Inc., 2011).
The criteria for choosing the best functions were: 1) the highest R2 value; 2) the lowest mean square of the error (CME); and 3) the value of the Mallows coefficient (Cp) (Draper & Smith, 1981; Neter et al., 1985). Once the best mathematical functions were identified, their mathematical coefficients (β0, βn) were calculated by the REG SAS/STAT procedure (SAS Institute Inc., 2011), according to the above criteria. The predicted values for each day of nutrient evolution were calculated by substituting the value of D (days after sprouting) in the general equation and then plotted in the SigmaPlot 10 program (Systat Software Inc., 2012).
Appropriate period for foliar sampling
The procedure described by Salazar-García et al. (2015) was followed. Mathematical derivatives were calculated for each day from the best functions of each nutrient. As values (positive or negative) approach zero, the rate of change of the concentration of each nutrient is lower. The predicted values per day were plotted in the SigmaPlot 10 program (Systat Software Inc., 2012) for each state, vegetative flush, and nutrient. The criterion for determining the best period for foliar sampling was that the derivative of the best mathematical function for each nutrient was equal to or close to zero (Granville et al., 1963).
RESULTS AND DISCUSION
Soil fertility. The soil analysis reported an acid pH and moderately low organic matter content for the Nayarit orchard (Table 2). Soil acidity limits nutrient availability and nutrient uptake. This has been reported in fruit trees such as cacao (Theobroma cacao) (Rosas-Patiño et al., 2021) and Persian lime (Baquero-Peñuela et al., 2018). Likewise, soil acidity partly explains the moderately high Fe content. On the other hand, nutrient content values classified as moderately low and very low were reported. Only the K content was moderately high.
For the Veracruz orchards, the soil fertility analysis reported some differences between orchards, although the pH was classified as acidic in both cases. As in the Nayarit orchard, the acid pH could limit the availability and absorption of nutrients. The Grupo Exportador orchard had higher fertility and less acid pH and only showed moderately low values for Cu and B content. The Paso Largo orchard presented a greater number of nutrients in moderately low and very low ranges (Table 2).
Table 2 Results of soil analysis (depth 0 to 30 cm) of samples from Persian lemon orchards in Nayarit and Veracruz.
| pH | MO† (%) | N org. | P | K | Ca | Mg | S | Fe | Cu | Mn | Zn | B | |||||
|---|---|---|---|---|---|---|---|---|---|---|---|---|---|---|---|---|---|
| mg kg-1 | |||||||||||||||||
| Huerto Ocotillo, Sta. Ma. del Oro, Nayarit | |||||||||||||||||
| 5.3 | 3.4 | 25.4 | 3.9 | 484.8 | 2113.7 | 384.9 | 64.1 | 43.6 | 0.2 | 4.9 | 0.7 | 0.2 | |||||
| Ácido | MoB | MoB | MB | MoA | M | M | M | MoA | MB | MoB | MB | MB | |||||
| Huerto Paso largo, Veracruz | |||||||||||||||||
| 3.92 | 2.32 | 17.4 | 417.5 | 297.2 | 1154.2 | 137.7 | 141.2 | 113.1 | 2.6 | 36.7 | 3.9 | 1.1 | |||||
| E. Ácido | Bajo | Bajo | MA | M | MoB | MoB | M | A | MoB | MoA | MoB | MoB | |||||
| Gpo. Exportador, Veracruz | |||||||||||||||||
| 4.89 | 4.6 | 34.5 | 204.9 | 280.1 | 4609.3 | 342.6 | 53.6 | 143.6 | 2.8 | 90.1 | 6 | 0.7 | |||||
| Ácido | M | M | MA | M | MA | M | M | A | MoB | MA | M | MoB | |||||
†MO= materia orgánica. Interpretación de laboratorio: E= extremadamente, A= alto, MoA= moderadamente alto, MA= muy alto, M= medio, B= bajo, MoB= moderadamente bajo, MB= muy bajo.
Nutritional analysis and foliar nutrient evolution.
Nayarit. Sampling of the winter flush began in September 2017, and those of the summer flush in February 2018. N, P, and K showed similar behavior between flushes, with higher initial values in the winter flush (5.42, 0.39 and 3.25 g kg-1, respectively) and lower concentration in the summer flush. In both flushes, Ca and Mg behaved similarly. The Ca concentration was increasing as leaf age increased; this coincides with what was reported for citrus in Florida (Morgan et al., 2017) and for rambutan (Nephelium lappaceum), for which it was noted that over the years, the Ca accumulation increases (Sosa-Rodrígues et al., 2020). For its part, Mg concentration presented higher values in summer. S concentration showed a different trend between flushes, with less variation in winter.
Micronutrient concentration curves showed some similarities between flushes. These similarities are explained considering that nutrient accumulation is a continuous process during the growing season (Freire-Cruz et al., 2019). The Fe concentration decreased gradually in winter from the fifth sampling onwards, while it continued to increase in summer. The Cu concentration presented lower values in the summer flush, while Mn and Zn presented higher concentration in this flush. The B level increased steadily throughout the summer flush, eventually surpassing the concentration of the winter flush.
Veracruz. During the first three weeks of vegetative sprouting, Diaphorina citri Kuwayama, the main vector of the bacterium Candidatus liberibacter asiaticus, which causes Huanglongbing (HLB), was present in the orchards. This pest and the drought caused a three-week delay in sprouting and, consequently, in leaf sampling. Therefore, in Veracruz, the first sampling of the winter flush was carried out in October 2017 and that of the spring flush in April 2018. In both flushes, the behavior of N and P was similar. N presented higher initial values in spring and P presented higher values in winter. Regarding the concentration of both nutrients, it decreased with increasing age, and the same behavior was reported by Morgan et al. (2017) in Florida. The foliar concentration of K had higher values in spring and a tendency to decrease as leaf age increased, while in winter, there was a clear increase during the first months.
The Ca, Mg, and S showed different behavior patterns among the vegetative flushes evaluated. The Ca concentration increased as leaf life days increased, and Mn increased during the first 80 to 120 days of leaf life. This same behavior was observed in Florida, where Ca and Mg concentration increased as leaves aged, and around four to six months of age, the concentrations of Ca and Mg were relatively stable (Morgan et al., 2017). The behavior of S showed an inverted trend; in spring, it increased and subsequently decreased, while in winter, it decreased and then increased.
The foliar nutrient evolution of the micronutrients Fe, Cu, Mn, Zn, and B was similar between both flows evaluated. The concentration of Fe and Mn increased with leaf age. The concentration of Cu and Zn decreased in the first days of leaf life and then increased with increasing leaf age. The B concentration increased rapidly in the first weeks of leaf life and continued to increase until the last sampling.
The foliar nutrient evolution of the micronutrients Fe, Cu, Mn, Zn and B was similar between both flows evaluated. The concentration of Fe and Mn increased with the leaf age. The concentration of Cu and Zn decreased in the first days of leaf life; after that, their concentration increased with the increasing leaf age. The concentration of B increased rapidly in the first weeks of leaf life, and it continued to increase until the last sampling.
It should be noted that the presence of D. citri could lead to the transmission of the bacterium, causing HLB. This bacterium lodges in the phloem of the plant and promotes the overproduction of starch (Suh et al., 2018), in addition to reducing the absorption of nutrients, mainly Mn, Zn, K, and Cu (Gómez-Flores et al., 2019).
Appropriate period for foliar sampling. Nayarit. Winter flush sprouting started on August 13, 2017, while summer flush sprouting started on January 12, 2018. The nutrient stability periods are shown in Figure 1 (A and B) and Figure 2 (A and B), for the winter and summer flushes, respectively. The appropriate period for foliar sampling was set from July 29 to August 18 for the summer vegetative flush and from February 08 to March 19 for the winter flush (Figure 3).

Figure 1 Mathematical derivatives of winter flush (A: macronutrients, B: micronutrients), in Nayarit.

Figure 2 Mathematical derivatives of summer flush (A: macronutrients, B: micronutrients), in Nayarit.

Figure 3 Period of nutrient stability and an appropriate period for foliar sampling (delimited by vertical dashed lines) of Persian lime in Nayarit, winter and summer flushes.
Veracruz. The onset of winter vegetative sprouting occurred on October 4, 2016, and spring vegetative sprouting began on February 17, 2017. These dates were considered as day zero of leaf age. With the calculation of the derivatives, the periods of nutrient stability were obtained for the winter flush (Figure 4 A and B) and for the spring flush (Figure 5 A and B).
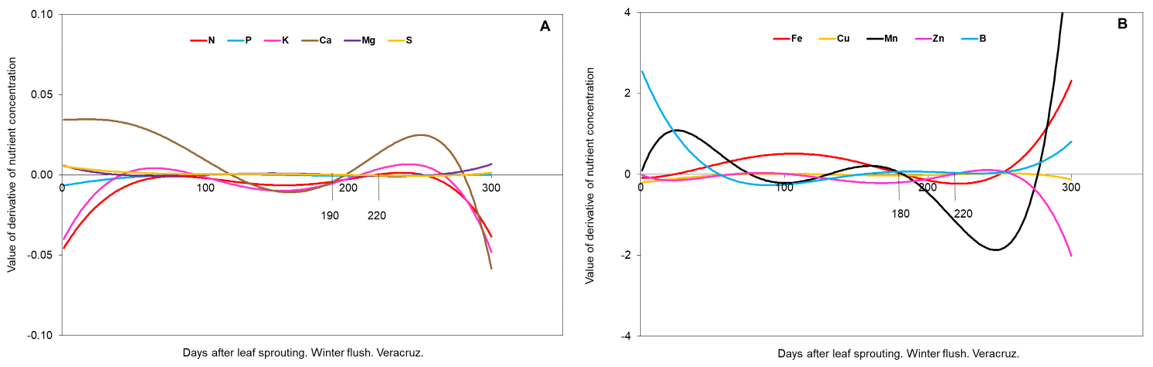
Figure 4 Mathematical derivatives of winter flush (A: macronutrients, B: micronutrients), in Veracruz.
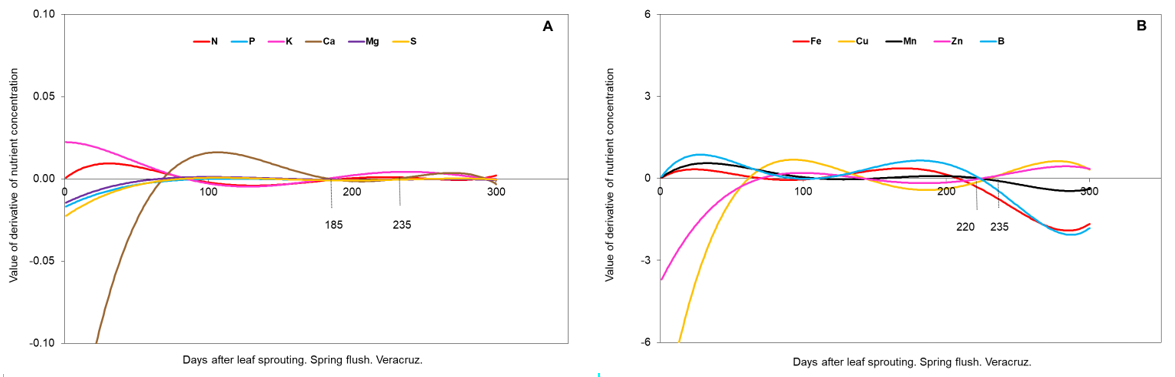
Figure 5 Mathematical derivatives of spring flush (A: macronutrients, B: micronutrients), in Veracruz.
With the nutrient stability periods, the appropriate time for foliar sampling was defined (Figure 6). For the winter flush, the stability period or the appropriate period for foliar sampling was from April 10 to May 10, and for the spring flush, it was from September 23 to October 8.
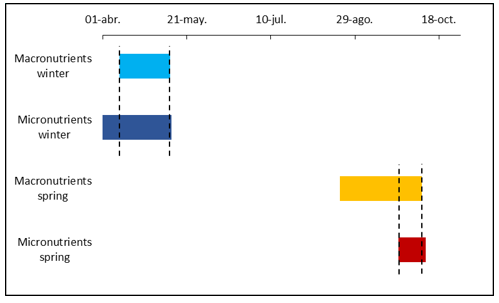
Figure 6 Period of nutrient stability and appropriate period for foliar sampling (delimited by vertical dashed lines) of Persian lemon in Veracruz, winter and spring flushes.
The evolution of the concentration of some nutrients in the leaves showed similarities and differences. Among the similarities, it stands out that the concentration of N, P, and K in the leaves showed a decrease as the leaves aged, which, as already mentioned, has been reported previously for citrus (Morgan et al., 2017). Other studies in 'Rio Red' grapefruit and 'Satsuma' mandarin also reported that leaf N, P, and K concentrations decreased from January to March-April, increased during the growing season until mid-to-late summer, and then decreased until December, regardless of rootstock (Yildiz et al., 2018). Regarding Ca and Mg, there are reports that the concentration of these increases as leaf life progresses (Morgan et al., 2017). This coincided with what was found in Nayarit in both flushes and in Veracruz in the spring flush, since the winter flush initially showed a decrease in the Ca concentration, although it subsequently increased.
The differences in the evolution of nutrient concentration in the leaves of the vegetative flushes evaluated in Nayarit and Veracruz were attributed to the different availability of nutrients in each orchard, as reflected in the fertility analysis. It has already been pointed out in other studies that nutrient content in leaves is affected by factors such as soil nutrient availability, which is affected by its physical, chemical, and biological characteristics (Mattos et al., 2020), growth stage (Freire-Cruz et al., 2019), and sometimes rootstock (Yildiz et al., 2018).
The orchards included in the present study received different doses of fertilizer, the soil had different fertility levels, and the orchards in Veracruz were the most favored in both aspects. The effect of these conditions was not seen in the higher foliar nutrient concentration in the orchards of this state. Similar chestnut (Castanea sativa) cultivation in Portugal was found, for which a poor relationship between available soil nutrients and leaf nutrient concentration was reported (Arrobas et al., 2018).
The period of foliar nutrient stability is related to the phenology of the crop. For litchi (Litchi chinensis) in Mexico, it was reported that the concentration of P, K, and Mg decreases at the beginning of flowering. As the months go by, the concentration of K and Mg increases as the production cycle progresses, while P decreases at the beginning of flowering and at the beginning of fruiting (Aburto-González et al., 2017). In citrus, foliar nutrient concentration is relatively stable between 4 to 6 months after emergence in spring (Morgan et al., 2017). In Türkiye, it was reported that leaves collected 28 days after full bloom serve to determine the content of N, P, K, Ca, Mg, Zn, Mn, and B in apple trees (Uçgun & Gezgin, 2017).
The difference in the number of days in the period of nutrient stability found and that reported in the literature could be due to the strategy followed to define the day of leaf sprouting, the growth flush from which the leaves were obtained, and the climatic conditions. It is considered important to follow up on research focused on the effects of the different phenological stages of the Persian lemon crop on leaf nutrient concentration patterns. This would allow adjusting the optimal dates for foliar sampling for nutrient diagnostic purposes established here.
CONCLUSIONS
The periods of foliar nutrient stability in the winter and summer flushes in Nayarit and spring and winter in Veracruz were between 6 and 7 months of leaf age. For Nayarit, the appropriate period for foliar sampling was from July 29 to August 18 for the summer vegetative flush and from February 8 to March 19 for the winter flush. For Veracruz, the appropriate period for foliar sampling was from April 10 to May 10 for the winter flush and from September 23 to October 8 for the spring flush.

