Introduction
The rapid growth of the bio biofuel industry has caused an increase in the prices of agricultural commodities, including corn and soybean. As a result, goat and sheep farmers are looking for alternative ingredients to include in animal diets (Makkar, 2018) with the aim of reducing costs without affecting productivity. In this context, the ecological footprint, social inclusion, and farm profitability are encouraging the use of agro-industrial products as alternatives for ruminants (Pulina et al., 2017). Inclusion of vegetable oils as alternative ingredients in sheep diets is a promising approach for feedlot systems, as it increases the energy density of the diet, influences fat deposition, modifies the fatty-acid profile (FA) of meat (Parente et al., 2018; Bagaldo et al., 2019; Vargas et al., 2020), decreases the short-chain fatty-acid content (SCFA), and increases the levels of 18:1 t11 and 18:2 c9t11 acids (Palmquist and Jenkins 2017)
Brazil has a many palm species with potential to produce vegetable oil. Among these is the licuri palm (Syagrus coronata (Martius) Beccari) of the Arecaceae family, native to the Brazilian semiarid regions of Caatinga and covering the eastern and central areas of northern Minas Gerais to southern Pernambuco (Araújo et al., 2019). The licuri palm produces about four bunches a year, with an average of 1,357 small coconuts (licuri). The almond in these coconuts is rich in oils (54% of the almond weight; Rodrigues et al., 2020) widely used in the food, cosmetic, pharmaceutical, and biodiesel industries (Araújo et al., 2019; Santos et al., 2019; Daza et al., 2020). However, the use of licuri oil as an additive for animal feed is still little explored (Silva et al., 2011; Lima et al., 2015; Oliveira et al., 2016).
About 84.9% of the fatty-acid content in licuri oil is saturated, containing 36% lauric acid (Araújo et al., 2019), which may be important in tropical regions, since oils with high unsaturated acid levels are subject to oxidation. Although saturated fatty acids have hypercholesterolemic properties, most of them are highly oxidized after absorption. This can contribute to decrease the accumulation of body fat in small ruminants, which may be of interest to consumers (Parente et al., 2020). To the best of our knowledge, no scientific study has been conducted on the inclusion of licuri oil in diets for ewes and its effects on the carcass traits of confined animals.
The economic analysis of the investments made in a feedlot is an important assessment tool that validates the viability of a project by describing all the details of the production chain and seeking the necessary changes for greater productive efficiency (Santos et al., 2017). Studies evaluating the economic viability of licuri oil as an ingredient in the diet of confined ewes are scarce in the literature. Thus, we hypothesized that ewes fed diets containing licuri oil would have carcass traits similar to those fed the control diet, but that licuri oil would reduce the deposition of fat in tissues due to the greater oxidation of lauric acid. Additionally, licuri oil could reduce production costs and improve the economic response in confined discard ewes.
Therefore, the objective of the present study was to evaluate carcass yield, non-carcass components, and the economic viability of including licuri oil in diets for Santa Ines ewes.
Material and Methods
Ethical considerations
This study was approved and certified by the Ethics Committee on Human and Animal Studies of UNIVASF (Protocol Nº 0002/24102017).
Location
The experiment was conducted at Universidade Federal do Vale do São Francisco (UNIVASF), Petrolina, PE, Brazil. The predominant climate of the region, according to Köppen and Geiger (1928), is semi-arid BSh with summer rains. The rainy season starts in November and ends in April, with an annual rainfall of 376 mm. During the experimental period, the maximum and minimum temperatures were 33.8 and 24.6 °C, respectively, with relative humidity of 50.5 and 73.6%, respectively.
Animals, treatments, and experimental diets
Thirty-two Santa Ines discard ewes (multiparous, non-lactating, 2-4 years old and 36.7 ± 0.87 kg of body weight-BW) were distributed in a randomized block design with four treatments (diets) and eight replicates per treatment. The confinement lasted 77 days preceded by 15 days of adaptation. The ewes were housed in individual pens (2.42 m²) and provided with feeders and drinking fountains.
The treatments consisted of increasing levels of licuri oil in the diet (0, 2, 4 and 5%, based on dry matter). The experimental diets (Table 1) were formulated to be isoproteic, in a roughage/concentrate ratio of 50:50, based on dry matter, and balanced to allow an average daily gain of 40 g/day, following NRC (2007) recommendations. Diet samples were collected to determine the fatty-acids profile by gas chromatography (Table 1) following the methodology of Visentainer (2012). The chemical composition of the ingredients of the experimental diets are shown in Table 2.
Table 1 Ingredients and chemical composition of experimental diets.
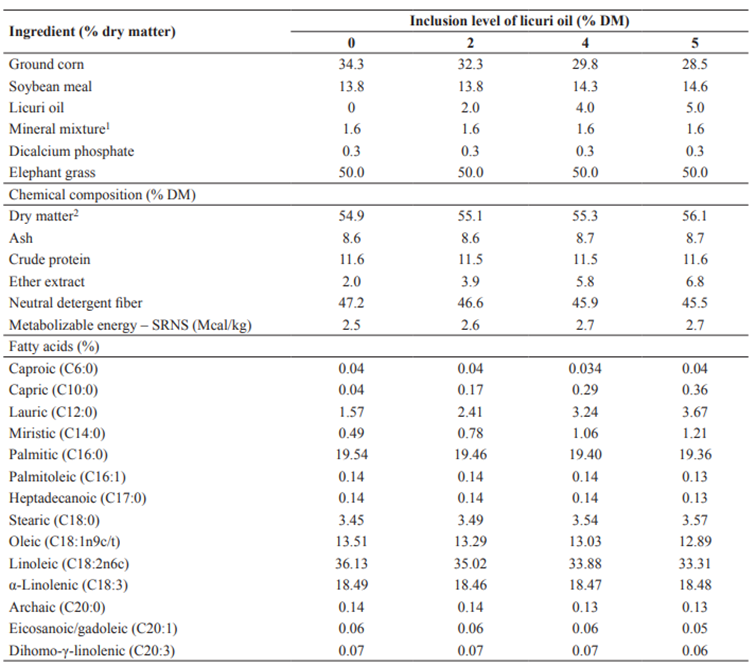
1Composition= 7.5% P; 19% Ca; 1% Mg; 7% S; 14.3% Na; 21.8% Cl; 500 ppm Fe; 300 ppm Cu; 4,600 ppm Zn; 1,100 ppm Mn; 80 ppm I; 405 ppm Co; 30 ppm Se. 2% of natural matter.
Table 2 Chemical composition of diet ingredients.
| (% DM) | Elephant grass | Ground corn | Soybean meal | Licuri oil |
|---|---|---|---|---|
| Dry matter1 | 26.2 | 87.6 | 88.6 | 100 |
| Mineral matter | 7.9 | 2.0 | 6.5 | - |
| Crude protein | 6.9 | 8.9 | 48.8 | - |
| Ether extract | 2.9 | 4.5 | 1.9 | 100 |
| Neutral detergent fiber | 70.9 | 13.0 | 14.8 | - |
| Acid detergent fiber | 41.9 | 7.7 | 8.7 | - |
| Total carbohydrates | 83.0 | 72.0 | 42.8 | - |
| Non-fiber carbohydrates | 17.4 | 77.8 | 27.6 | - |
| Total digestible nutrients | 57.0 | 86.0 | 81.2 | - |
1% of natural matter.
Feeding was carried out twice a day (9 am and 4 pm) as complete ration, allowing for refusals of 10% of offered feed (DM basis). Water was provided ad libitum. Refused feed was collected and weighed daily to adjust the feed offered and calculate dry matter intake (DMI). During the experimental period, the ewes showed average dry matter intake, ether extract and average daily gain (in g.day-1) of 1,609, 44, and 91.3 (0% licuri oil); 1,759, 64, and 103.9 (2% licuri oil); 1,356, 63, and 63.9 (4% licuri oil); and 1,307, 79, and 48.6 (5% licuri oil), respectively.
Samples of ingredients, feed supplied, and leftovers were collected weekly and stored at ‑20 ºC for further analysis. Subsequently, the samples were pre-dried in a forced ventilation oven at 55 °C for 72 hours and ground to 1-mm particle size (Wiley mill, Marconi, MA-580, Piracicaba, Brazil). Chemical analyses were performed using the procedures described by AOAC (2016) for dry matter (DM; method 967.03), mineral matter (MM; method 942.05), crude protein (CP; method 981.10), and ether extract (EE; method 920.29). Neutral detergent fiber was determined according to Mertens (2002).
Slaughter and carcass yield
After 77 days in feedlot the ewes were individually weighed to obtain BW after solid fasting of 16 hours, according to animal welfare standards. After this period, the animals were weighed to determine body weight at slaughter (BWS). The animals were first desensitized by cerebral concussion and immediately slaughtered by bleeding through the carotid arteries and jugular veins, according to the current rules of the Regulation for the Inspection of Industrial Sanitation of Products of Animal Origin (Brazil 2017).
After bleeding the animals were skinned. The head was separated from the carcass and the limbs separated by section of the carpometacarpal joints (forelimbs) and the tarsometatarsal joints (hind limbs). Evisceration was performed through an opening along the abdominal midline to remove the non-carcass components: chips (reproductive and respiratory tracts + bladder), gastrointestinal tract, liver, spleen, heart, heart fat, omental fat, pancreas and skin, which were washed and weighed separately for later calculation of the total weight of the organs, in order to determine their yield in relation to the weight of the empty body and the body weight at slaughter (Silva-Sobrinho 2001).
The carcasses were identified and weighed with the kidneys and renal fat to obtain the hot carcass weight (HCW). The carcasses were transferred to a cold chamber where they were hung on appropriate hooks and kept refrigerated at 5 °C for 24 hours. After this period, carcasses were weighed to obtain the cold carcass weight (CCW). Hot carcass yield (HCY; HCY = (HCW/BWS)×100)), cold carcass yield (CCY; CCY = (CCW/BWS)×100)) and determination of cooling losses (CL; CL = [(HCW - CCW)/HCW]×100)) were calculated according to Silva Sobrinho et al. (2005). The real yield (RY; RY = HCW/Empty BW) was obtained according to Sañudo and Sierra (1986). The kidneys and kidney fat were removed from the chilled, weighed carcasses, and the weights obtained were subtracted from the HCW and CCW.
Morphometric evaluation of carcasses
After the refrigeration period, measurements were made on the carcasses according to the methodology of Cezar and Souza (2007), with the following measurements (in cm) being determined: external carcass length (ECL); internal carcass length (ICL); first chest width (FCW); second chest width (SCW); croup width (CW); croup perimeter (CP); leg length (LL); leg perimeter (LP) and depth of the chest (DC).
Evaluation of commercial cuts and ribeye area
The carcasses were divided longitudinally and the left half-carcass (LHC) was weighed and divided into six commercial cuts: neck, shoulder, ribs, loin, leg and saw. The cuts were weighed separately and then the yields of each cut calculated in relation to the weight of the left half-carcass (Silva Sobrinho 2001). After obtaining the commercial cuts, the loins were identified, vacuum packed and frozen at -18 ºC for further dissection. Between the 12th and the 13rd ribs, a cross-section was made to measure the loin eye area (LEA) of the Longissimus dorsi muscle, tracing its outline on transparent slides for later measurement with the AutoCAD® software (Autodesk, Inc, Brazil). The thickness of the subcutaneous fat was measured with a digital caliper (150 mm, MTX-316119, Franca, Brazil).
The loins were thawed under refrigeration (8 oC; 12 hours) and dissected manually. Tissues were separated into total fat (subcutaneous and intermuscular combined), muscle (total muscle dissected, after complete removal of all adhered subcutaneous and intermuscular fat) and bones (dissected after complete removal of all muscle and adhered subcutaneous and intermuscular fat), which were weighed individually, to be expressed as a percentage of the weight of the loin, as described by Purchas et al. (1991) and Hopkins et al. (1997).
Economic analysis
The economic analysis was performed to verify the viability of using licuri oil in diets. The cost of feed per kg of roughage (irrigated and fertilized elephant grass) was 0.06, corn was 0.16, soybean meal 0.24; mineral mixture of 0.52, licuri oil of 0.84, and bicalcium phosphate USD$ 0.64 (cost of ingredients in the São Francisco Valley region in May 2018, expressed in USD$ kg-1 DM; dollar quotation on 12/22/2022; 1 BRL = 0.1928 USD, Central Bank of Brazil).
The purchase price of each ewe was USD$44.28. The capital invested in the construction of the containment was estimated at USD$3,052.56. The opportunity cost was calculated as 6% of the capital invested, divided by 360 days and multiplied by the 77 days of confinement, which was later divided by four experimental treatments (diets). The annual depreciation was calculated using the straight-line method (constant quotas), using the amount spent on the facilities and subtracting the residual value (10%), which was divided by the 15 years of useful life. Finally, it was adjusted to 77 days and divided by the four experimental treatments (diets). The cost of labor was calculated based on the minimum wage in force in May 2018 (USD$168.96), plus 37% social charges. For this, the labor apportioned to the work performed for 0300 h daily was adopted, corresponding to the time needed to feed the ewe and to clean the facilities.
To determine the cost of production, the Total Operating Cost of Production methodology, described by Matsunaga et al. (1976), which defines and takes into account all costs related to the production of a good, product or service. The economic indicators analyzed were: Gross Income (GI, USD$/year) = total production in kg BW × market selling price; Effective Operating Cost (EOC, USD$/year) = costs of operations (maintenance of facilities and equipment) + costs of contracted labor + costs of inputs (food, medications, energy); Total operating cost (TOC, USD$/year) = EOC + depreciation; Total cost (TC, USD$/year) = TOC + return on average capital invested in animals and improvements; Gross margin (GM, USD$/year) = GI - EOC; Net margin of activity (NM, USD$/year) = GI - TOC; Result (profit or loss) = GI - TC.
Economic performance indicators were assessed by profitability (P; USD$/year) and rentability (capital invested, %). Profitability was obtained by the following equation: P = GI - TC * 100)/GI. To calculate gross income (GI), gross income from the sale of shredded meat, income from the sale of skin and manure were considered. The sales values per kg of shredded meat, per piece of raw leather and per kg of manure were USD$3.36, USD$0.88, and USD$0.02, respectively. Values were based on prices current in the São Francisco Valley region of northeastern Brazil in 2018.
Statistical analysis
The data were submitted to the Shapiro-Wilk test to verify the normal distribution of residues and homogeneity of variances, using the univariate procedure. Analysis of variance was performed using the GLM procedure using orthogonal polynomials. Finally, with a significant effect at 5% probability, regression equations were estimated using the REG procedure. The SAS statistical package, version 9.1 (SAS Institute, Cary, NC, USA; 2003) was used for all tests.
Results
The inclusion of licuri oil in the diets of sheep promoted a quadratic effect for BWS (p=0.03), HCY (p=0.014), CCY (p=0.013), and RY (p=0.007). The HCW (p<0.001) and CCW (p<0.001) were reduced and CL increased (p<0.001) according to the increase in licuri oil levels in the diets (Table 3). The increase in licuri oil levels provided a quadratic effect for first chest width (p<0.001) and second chest width (p=0.03) measured in the chest of the carcass. There were no effects of the levels of licuri oil on ILC, ECL, LL, CW, CP, LP and DC (p>0.05; Table 3).
Table 3 Weight (kg), yield (%) and morphometry (cm) of carcasses of Santa Ines ewes fed diets containing increasing levels of licuri oil.
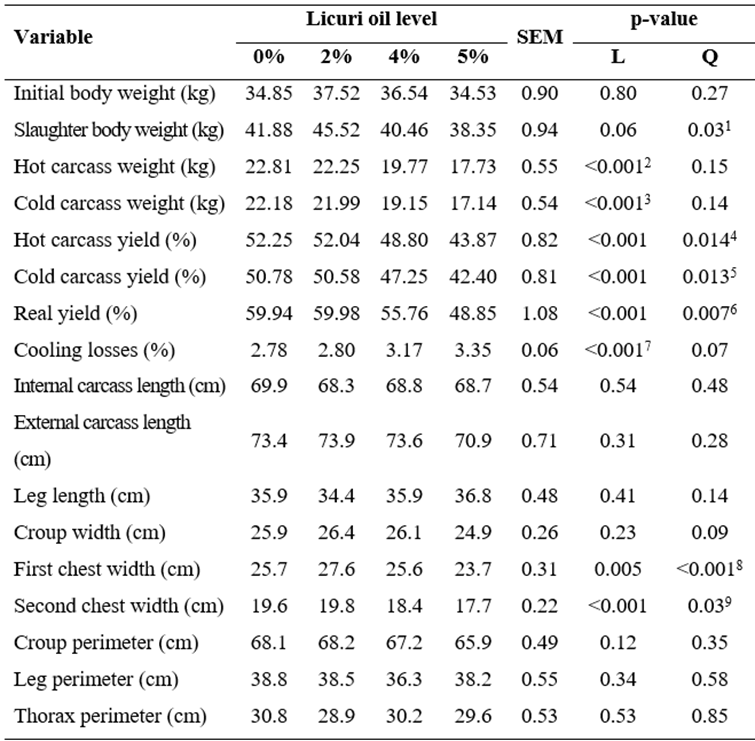
SEM= standard error of the mean; L= Linear Effect; Q= Quadratic Effect; Significance was determined at the 5% probability level. Equations: 1y= 42.10+2.81x-0.74x², R²= 0.57; 2y= 0.23-0.99x, R²= 0.51; 3y= 22.73-0.99x, R²= 0.42; 4ŷ= 52.12+1.39x-0.59x², R²= 0.56; 5ŷ =50.67+1.36x-0.59x², R²= 0.57; 6ŷ= 59.75+2.17x-0.85x², R²= 0.58; 7ŷ= 0.27+0.12x, R²= 0.48; 8y= 25.72+1.76x-0.43x², R²= 0.63; 9y= 19.60+0.33x-0.15x², R²= 0.49.
A reduction in heart weight (p=0.004) was observed as the levels of licuri oil increased. A quadratic effect was seen on the weight of heart fat (p=0.001), pancreas (p<0.001) and omental fat (p<0.001), increasing from 0 to 2% inclusion of licuri oil (Table 4). No effect of licuri oil levels was observed on the weight of spleen, liver, kidneys, trimmings, rumen + reticulum + omasum + abomasum, small intestine, large intestine, legs and skin (p>0.05; Table 4).
Table 4 Red and white viscera, feet, and skin of Santa Ines ewes fed increasing levels of licuri oil.
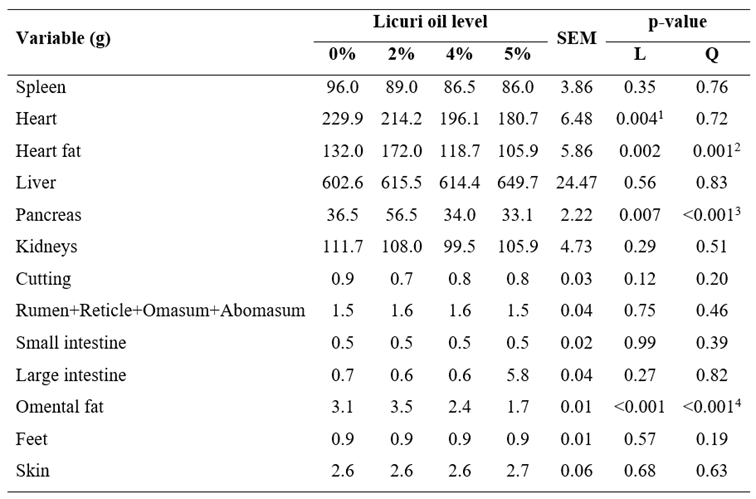
SEM = standard error of the mean; L= Linear Effect; Q= Quadratic Effect; Significance was determined at the 5% probability level. Equations: 1y= 0.24-0.14x, R²= 0.59; 2y= 0.13+0.28x-0.70x², R²= 0.49; 3y= 0.38+0.12x-0.28x², R²= 0.58; 4y= 1.08+0.14x-0.52x², R²= 0.44.
The addition of licuri oil to the diets promoted a linear increase of LHC weight (p<0.001) and saw yield (p<0.001), and a reduction of leg yield (p<0.001). There was no effect of licuri oil on rib, loin, shoulder, and neck yields (p>0.05; Table 5).
Table 5 Left half-carcass weight, yields from commercial cuts, loin eye area (LEA), fat thickness of the LEA and tissue composition of the loin of Santa Ines ewes fed increasing levels of licuri oil.
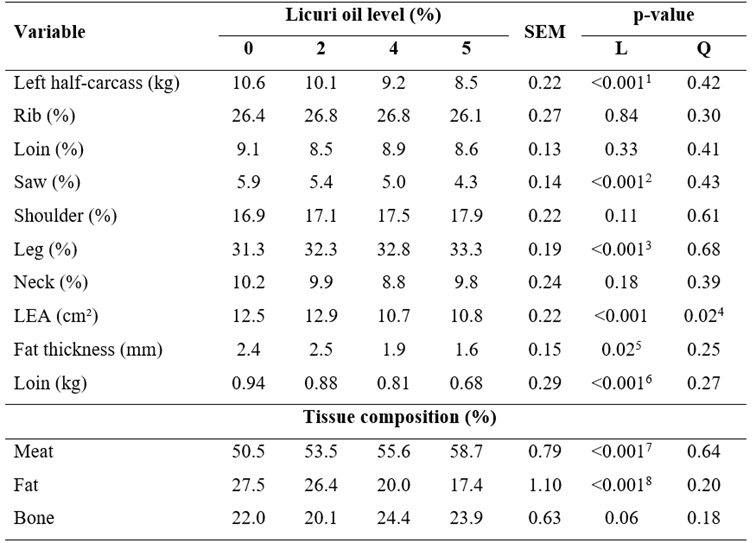
SEM= standard error of the mean; L= Linear Effect; Q= Quadratic Effect. Significance was determined at the 5% probability level. Equations: 1y= 10,747-409.05x, R²= 0.43; 2y= 6.02-0.30x, R²= 0.55; 3y= 31.41+0.38x, R²= 0.51; 4y= 12.63+0.16x-0.12x², R²= 0.55; 5y= 2.58-0.17x, R²= 0.56; 6y= 950.7-38.08x, R²= 0.58; 7y= 50.39+1.52x, R²= 0.44; 8y= 28.65-22.11x, R²= 0.44.
A quadratic effect (p=0.02) of licuri oil on LEA was observed, for levels 0 and 2% of licuri oil. Fat thickness (p=0.02) and loin weight (p<0.001) decreased linearly according to the inclusion level of licuri oil. Regarding tissue composition of the loin, licuri oil resulted in linear increase in the proportion of meat (p<0.001) and reduction in fat proportion (p<0.001). There was no effect of licuri oil on the proportion of bone (p>0.05; Table 4).
The selling price per kg of carcass during 2018 in the different regions of Brazil ranged between 2.13 and 3.19 for lambs/ram and between 1.59 and USD$2.13 for discard ewes. The economic analysis was performed considering the purchase cost of the animal. The treatment that resulted in the best gross revenue was the one with 0% inclusion of licuri oil in the diet, making a value of USD$663.35, however, considering the economic performance indicators, the result was negative with a loss of approximately USD$55.48 (Table 6).
Table 6 Operating costs, gross revenue result indicators and economic performance indicators for the acquisition and termination of ewes, receiving a 50% concentrate diet and different levels of licuri oil.
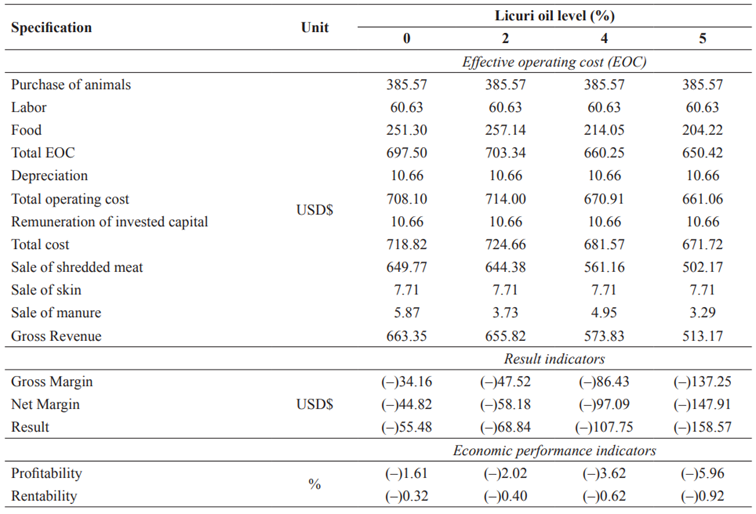
Values expressed in US Dollars (USD$); Dollar quote on 12/22/2022; 1 BRL = 0.1928 USD$; Central Bank of Brazil).
Discussion
Carcass yield parameters are directly affected by BWS (Costa et al., 2019a) and these were strongly influenced by the dietary levels of licuri oil, showing progressive decreases that caused a reduction in the measurements made in the thorax of the discard ewes. The change in carcass yield in relation to the increasing levels of licuri oil may have been influenced by the reduced deposition of adipose tissue and the increase in CL in animals supplemented with 4 and 5% licuri oil, which is directly related to lower DM intake.
In addition to DMI, one of the factors that may have contributed to a reduction of carcass yield with high levels of licuri oil could be the weight of the liver. Although there was no effect of treatment on this organ, at the highest level of licuri oil (5%), the liver weight stood out in relation to the other treatments (649.7 g). This result can be explained by the high metabolic rate of the organ, and this activity is intensified by the increase in the EE level in the diets (Bauchart et al., 1996), a result seen in this study. The liver is more developed to meet the demand for nutrient metabolism, since it is the central organ that gathers the absorbed nutrients and those from circulation in general, moderating and distributing them to the peripheral tissues and acting as the main site for the regulation of nutrient supply (Meikle et al., 2018).
Once ingested, medium-chain fatty acids in licuri oil are absorbed by the abomasum, reach the liver through the hepatic portal system, and behave in a similar way to glucose (Daza et al., 2020). This readily available energy source results in greater development of organs involved in energy balance. Thus, the increase in pancreas weight by the addition of up to 2% licuri oil to the diet may be related to changes in lipolytic activities, which require more of this gland to guarantee the best use of fatty acids, causing its hypertrophy (Delgadillo-Puga et al., 2020). Thus, the lower values of pancreas weight due to the greater inclusions levels of licuri oil may reflect possible changes in the influx of nutrients in the duodenum and in the secretion of lipases (Xu et al., 2009) caused by the low DMI. Such an event may also have caused a reduction in heart weight, which suffered a decrease of 49.12 g (21.37%); that is, losses of 9.82 g for each 1% inclusion of licuri oil in the diet. These losses may be related to a low availability and absorption of nutrients as a result of the damage caused to the metabolism and rumen fermentation.
The inclusion of vegetable oils in ruminant diets modifies the production of volatile fatty acids in the rumen, increasing the proportion of propionate and reducing acetate. Propionate is a gluconeogenic precursor and therefore can increase glucose supply for lipogenesis, resulting in greater fat deposition (Park et al., 2018). This factor, combined with the fatty-acid composition of licuri oil, the intake of DM and the inherent characteristics of the animal such as early growth, lower adult weight and greater accumulation of fat due to sex hormones, makes females more efficient, whereas fat metabolism in males (Argente-Arizón et al., 2016) explains the greater deposition of omental and heart fat with dietary inclusion of 2% licuri oil.
Leg was the cut that showed the highest yield with the rise in licuri oil level in the diets. The highest percentage of carcass muscle mass is found in this cut, with a higher edible yield and, in addition to predicting the total content of the tissues, it is considered the most noble cut in sheep (Araújo et al., 2017). Saw yield and loin weight were reduced by 0.33 and 5.53%, respectively, in their proportion and weight for each 1% licuri oil added to the diet. These reductions are related to the lower HCW and CCW observed with the increase in licuri oil in diets, a reduction in fat thickness and the later maturity of cuts.
The LEA is a measure that reflects the amount of muscle in the carcass, being positively correlated with muscularity. Comparing inclusion levels of 0 and 5% licuri oil, we observed a reduction of 10 g (36.84%) in the proportion of fat in the total composition of the loin, which could explain the increase in the proportion of meat in this cut.
The EOC, describing the amount of resources used to cover the costs of confinement (Costa et al., 2019b), underwent changes due to the levels of licuri oil in the diet, reflecting the fluctuations in the DM intake according to the level of inclusion. The DM intake of the animals associated with decrease in the costs of concentrates in diets containing licuri oil was the determining factor in EOC. Similarly, it affected the total operating cost, which, in addition to expenses, also includes the depreciation of improvements, machinery and equipment.
Considering the results and the economic performance indicators, the addition of licuri oil to the diet was unsatisfactory. In the short and medium term, the gross and net margins were negative, revealing that the income obtained from the activity did not even cover the actual operating costs and an interruption of the production process would be indicated. In the long run, the results (profit or loss) were also negative, meaning that return on the capital invested in the activity would be lower than the opportunity interest rate, and therefore, neither treatment was economically viable.
Within the system, the effective cost of animal feeding is mainly responsible for compromising the remuneration generated by the sale of products (Ferreira et al., 2017), even though it has worked with cut meat as a strategy to add value to the meat discard sheep. Thus, in order to achieve a return on the capital invested in the activity of at least US$ 19.28 above the opportunity interest rate adopted, it would be necessary to reduce feed cost with the inclusions of 2, 4, or 5% licuri oil. In these conditions, if profitability and rentability of each diet were compared, the system including 5% licuri oil in the feed would have better profitability and rentability.
Under the experimental conditions, the inclusion of up to 2% licuri oil in the diet provided an increase in carcass yield of discard ewes. However, the acquisition or purchase of this category of animal for feedlots was not profitable, nor was the inclusion of higher levels of licuri oil in the diet.


