Introduction
The Chemical Enhanced Oil Recovery (CEOR) are methods in which chemical fluids such as surfactants, alkalis, and polymers are injected to produce the remaining oil in the reservoir after primary and secondary recovery processes [1,2]. Among these methods, polymer injection is the most used CEOR technique due to its technical simplicity [3]. In polymer-flooding, the primary recovery mechanism involves increasing the viscosity of water, consequently reducing the oil/water mobility ratio, which results in improved sweep efficiency [1,4]. Therefore, the polymer solution viscosity is one of the most important properties to evaluate the performance of this CEOR method, both in the laboratory and field settings. The polymer injection technique has undergone both dynamics and statics experiments to elucidate oil recovery tendencies and additional mechanisms for enhancing oil recovery [1]. Dynamic experiments, such as porous injection tests at the laboratory level serve as valuable tools for assessing the technical feasibility of secondary and enhanced hydrocarbon recovery processes by analyzing sweep efficiencies [5]. However, the use of closed core holders can sometimes pose challenges for researchers in tracking the front, saturation profiles, and viscous fingering patterns in both 1D and 2D core flooding tests [6]. To address this issue, various investigations have incorporated non-intrusive techniques, including computed tomography, Nuclear Magnetic Resonance (NMR) [7], and micro-visualized models, to simulate the sweep process and visualize fluid distribution within the porous medium [8]. Computed tomography has been extensively employed to describe recovery mechanisms and displacement efficiency during the injection of different types of chemicals in a porous medium [9-11]. A primary challenge associated with the use of computed tomography is the identification of phases in the porous medium. This identification relies on the attenuation coefficients of the fluids within the porous medium, and it is related to the similarity between the displaced and displacing fluids [12,13]. A potential solution to this issue is the incorporation of dopants during injection tests. When introduced into one of the phases, these dopants enhance the differentiation between the attenuation coefficients, thereby improving the visualization of the displaced and displacing phases [14,15].
For aqueous phases, such as water injection or CEOR agent solutions, compounds like sodium iodide (NaI) and sodium bromide (NaBr) are preferred during core-flooding tests [11,16,17]. These salt additives have high molecular weight, exhibit high solubility in water, and interact with the rock similarly to sodium chloride (NaCl), which is naturally present in the formation water, and then prevents the adverse interaction with rock/fluids in terms of wettability [18,19]. Likewise, petroleum dopants are iodinated, or brominated hydrocarbons obtained from heavy aliphatic alkanes such as Dodecane and Hexadecane [13]. In these last dopants, the degree of affinity depends on the chemical similarity between the crude oil and the base hydrocarbon composition of the dopant. The type and concentrations of dopants must be carefully selected for specific rock-fluid systems under given conditions of pressure and temperature [20]. During the representation of water injection processes, the doped phase is the aqueous phase to avoid altering the rheological properties of the crude oil [20,21]. However, during the chemical injection process, the oleic phase is often doped to prevent affecting the properties of the chemical solutions [9,10,22]. Nevertheless, some authors suggest avoiding doping the oleic phase because the rheological properties of hydrocarbons are considered critical characteristics of the process. Therefore, any change in their properties increases uncertainty in the enhanced recovery displacement process in a porous medium [11,13,23]. On the other hand, changes in the rheological properties of the injected fluids can be mitigated by determining the optimum dopant concentration and counteracting the change in viscosity by changing the polymer concentration to achieve the defined condition. Therefore, this study evaluates the impact of adding four of the most used dopants in a polymeric solution to ensure an adequate contrast between fluids. The investigation analyzes the dopants effect on the most critical aspect during this process, the polymeric solution viscosity. The evidence obtained generates a methodological basis for future research to assess the polymer injection behavior in porous media using dopants without altering the mobility ratios of the solution.
Materials
The Flopaam (FP) 3230, partially hydrolyzed polyacrylamides (HPAM), was selected to perform the experimental design at 600 ppm concentration as a base case. It was selected based on the chemical recovery process in a Colombian oil field case. The Flopaam (FP) 3230 has a molecular weight of 8 MDa(MegaDalton) and a hydrolysis degree of 30% mole. The preparation brine was taken from the field composition, whose salinity had a sodium chloride equivalent content of approximately 431 ppm [24], making it effectively freshwater. The hydrocarbon phase was represented by six samples from different Colombian reservoirs with API gravity ranging from 17 to 34° API (Table 1). Furthermore, Sodium iodide (NaI), potassium iodide (KI), sodium bromide (NaBr), and sodium molybdate (Na2MoO4) were opted as dopants in the present study after a review of previous research.
Characterization techniques
Viscosity measurement
A Brookfield viscosimeter model DV2T was used to measure the viscosity in the sample. A needle LVT type with a special UL adaptor was employed, assuring an accuracy of 1% and a repeatability of 0.2%. The data was measured following the ASTM D7042 standard. In the investigation was established 7,3 s-1 as a unique value of shear rate at 332 K.
Computed tomography scanning
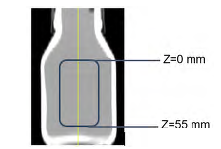
In the current investigation, samples of the polymeric solution with the different dopants were poured into 45 ml-amber vessels. Afterward, these vessels were taken to a computed tomography scanner (CT). The CT scanner was a General Electric model GE Optima 660 operated at 170 keV and a current of 140 mA. CT cross-sectional images were acquired at with a 7 mm spacing between them along the sample. These parameters correspond to the typical scanner configuration for core displacements at conditions of 14.7 psi (0.1 Mpas) and 298.15 K. The results were processed by Image J software and a twodimensional rectangular area was defined as a region of interest (ROI), away from the walls of the container to prevent beam hardening effects. Figure 1 illustrates this ROI, enclosed by a blue rectangular frame.
Experimental procedure
The process began with the preparation of brine using a magnetic stirrer. The stirrer was set to rotate the distilled water at 500 rpm while the salt (NaCl) was added. The brine solution in the conical flask was sealed. It was stored for 2 additional days on the rotating magnetic shaker (500 rpm) under ambient conditions to obtain a complete saline solution. Subsequently, the solution was passed through the 0.45 μm-Whatman cellulose nitrate membrane to remove solids particles greater than 0.45 Lim. Finally, the brine was stored in a sealed beaker at room temperature. This solution was used for preparing the polymer solution of the required concentrations.
On the other hand, the polymer solution was made, following the API RP-63 standard. Firstly, a stock solution was prepared with the brine, adding the polymer to reach a concentration of 5,000 ppm. The solution was agitated using a magnetic stirrer for 12 h to form a consistent solution, i.e., the solution exhibited a homogeneous aspect and did not have insoluble particles (fisheye). Afterward, the stock solution was diluted to obtain polymeric solutions at 600 ppm. These were prepared carefully with the minimum agitation (80 rpm) to avoid the mechanical degradation of the long-chain molecules and were stored in sealed recipients to minimize oxygen uptake. The viscosity of the polymeric solution at 600 ppm was a base case with a value of 33 cP at 7.3 s-1 and 332 K. However, the stock solution was employed to prepare the different polymer solutions in the evaluation process, as shown further. Once the prepared polymer was obtained, the analysis of the effect of the dopants on the physical properties of the polymer began, following the process depicted in Figure 2. Firstly, the effect of polymer over attenuation was evaluated by comparing the CT number of polymer solution with the brine and distilled water. Subsequently, the minimum concentration of dopants to generate an adequate fluid contrast in the saturation profiles of a hypothetical displacement experiment computed tomography technique was determined.
Moreover, the effect of the dopants on the polymer solution viscosity was analyzed at 298.15 K. Then, the polymer fraction necessary to counteract the change in the mixture properties and reach the viscosity value of the base case (without dopant) was estimated. Finally, the correlations for calculating the minimum dopant concentration as a function of the oil density were presented. In the following sections, each one of these phases will be explained.
Effect of polymer over attenuation
Five tests were developed to observe the effect of the polymer presence over the water attenuation value recorder by the CT scanner, as shown the Table 2. The primary solution analyzed was polymer at its maximum concentration and NaI as the dopant phase. The polymer sample was concentration of 3,500 ppm, and NaI was added at a concentration of 10,000 ppm. The NaI concentration was established from previous research, where it has been estimated, after repeated experimentation, an appropriated concentration between 10,000 - 15,000 ppm [17,19]. In this phase, two different water samples from different sources were employed, distilled water and the prepared brine, to compare the CT number.
Minimum dopant concentration
To determine the minimum concentration of dopant in the aqueous phase that can produce a contrast with the oleic phase, four test sets were scanned for each agent selected for the study, using various dopant proportions (Table 3). In this section, the experimental matrix was of the factorial type, where the factors were the concentrations and types of dopants. A total of 28 tests were conducted, each with its respective repeatability procedures. Finally, these values from each mixture were compared with the attenuation values of the oil, which possessed a gravity of 20 °API.
Effect of the minimum concentration over viscosity
The presence of dopants, acting as saline components, directly affects the viscosity of the polymer solution. Hence, in this investigation, the change in viscosity was estimated by adding the minimum concentration of the different dopants. Besides, the polymer concentrations were increased in the doped solutions until the viscosity of the base case was achieved. The preparation of four sets of diluted solutions at different polymer concentrations was proposed. These samples were prepared with brine at the minimum dopant concentration, while the polymer amount varied from the field ratio of 600 ppm up to 3,500 ppm to determine the required polymer concentration at which the viscosity of the base case is achieved after the doping process.
Dopant concentration correlation as a function of the density
The six Colombian oil samples were collected (Table 1) and scanned. Once the average CT of the oleic phase was obtained, the CT number for the polymer solution required to get a 300 CT of contrast was calculated. This difference in CT between phases is considered enough for saturation profile estimation in core floodings [20]. Finally, a correlation was established by relating the regression of the CT vs density and the CT vs Minimum dopant concentration. This correlation proves valuable in calculating the minimum dopant concentration as a function of the oil's density for each dopant used.
Results and discussion
Effect of polymer addition on solution attenuation
This first phase of this research aimed to demonstrate whether the presence of a polymer in the solution influences the attenuation values, as shown in Table 4. The attenuation value for water samples is considerably lower compared to other solutions that contain dopants. Moreover, the inclusion of the polymer in the solution resulted in an attenuation value increase of less than 1.5 % compared to a formulation without it. This information demonstrates that the addition of the polymer to the formulation does not significantly affect the attenuation measurements because viscosity is not a property directly related to the CT response.
Table 4 Results of the test for evaluating the effect of polymer addition over attenuation.
| Test set | Polymer | Dopant | Water | Attenuation [CT] | |||
|---|---|---|---|---|---|---|---|
| Min | Max | Mean | Standard deviation | ||||
| 1 | X | X | Field | 231.1 | 231.7 | 231.6 | 0.51 |
| 2 | X | Field | 228.4 | 228.4 | 229.8 | 0.68 | |
| 3 | X | Distilled | 224.1 | 227.2 | 226.1 | 1.14 | |
| 4 | Distilled | 4.1 | 8.7 | 7.5 | 1.45 | ||
| 5 | Field | -1.4 | 6.3 | 2.0 | 3.07 | ||
Calculation of the minimum dopant concentration
After observing the minimal impact of the polymer's presence on attenuation values, tests to And the minimum concentration of the dopant to ensure a contrast between the phases of the process were developed. Although the use of dopants increases the attenuation coefficient and CT number, the difference between crude oil and the polymeric solution is not detected until a relevant differential is generated [20]. The crude oil sample (20 °API) presented an attenuation with -86.05. This indicates that to achieve a marked differentiation during a polymer injection process under computed tomography analysis, an attenuation higher than 213.9 must be obtained in the chemical solution.
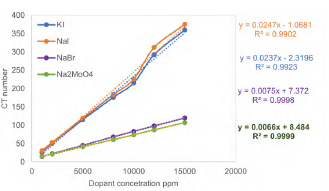
Figure 3 shows the behavior of each formulation prepared, the trend of the results, and the equation that represents them. It can be observed that the dopants with NaI and KI are the ones that achieve the highest attenuation value, described by the CT number, in a range from approximately 26 to 350. On the other hand, NaBr and Na2MoO4 dopants produce a lower CT number, from 15 to almost 120. With this information, each of the minimum dopant concentrations necessary to achieve the contrast required in the tests described above was calculated in Table 5. The salt with which good contrast is achieved with less concentration is NaI at 8,686 ppm, followed by KI at 9,125 ppm.
Effect of minimum dopant concentration on viscosity
Once the minimum values of dopant concentration required to accomplish an optimum contrast in the attenuation values were found, the next step was calculating the amount of polymer necessary to achieve the same viscosity value obtained in the test without dopant. The viscosity achieved in the laboratory with the undoped 600 ppm polymer solution was 33.5 Cp at 7.3 s-1 and 332 K, which corresponds to the target viscosity of the present study. Figure 3 shows the viscosity curves obtained for the solutions at the polymer concentrations proposed in the experimental procedure. Since the polymer had a low viscosity capacity in the presence of NaBr and Na2MoO4, it was necessary to add more points up to 3,500 ppm to have more points in its behavior and to make a better regression.
As can be seen, the four dopants decrease the viscosity of the polymer solution by roughly 90%. This reduction in the property occurs because the chemical compound, due to a partially hydrolyzed polyacrylamide is a polyelectrolyte, that is highly sensitive to the ionic environment of the medium. Therefore, when salts such as dopants are added, they dissociate and interact with the polymer chains, generating a double layer of electrolytes that shields the repulsive forces. Thus, the extension of the macromolecule is reduced, and the viscosity decreases [25-27]. Depending on the nature of the added salt, the rheological and structural changes of the polymer solution are different, as illustrated in Figure 4.
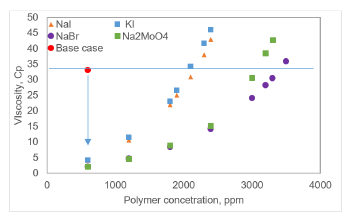
Figure 4 Behavior of viscosity at different polymer concentrations with dopants added at 7.3 s-1 and 332 K.
According to Figure 4, at initial polymer concentration conditions, the NaBr and Na2MoO4 produced a reduction in viscosity that was very close to that of NaI and KI. Likewise, the rheological behavior of the polymer solution is affected by the addition of the dopants since more elevated amounts of polymer are required to achieve the solution viscosity at the same value as the base case. Using the equations derived from the regressions of Figure 4, the polymer concentrations at which the effect of the dopant is counteracted, and the target viscosity value is reached for each of them were estimated (horizontal blue line). These values are presented in Table 6.
Table 6 Results of the polymer concentration required to reach the target viscosity in the presence of different dopants.
| Dopant | Polymer concentration [ppm] |
|---|---|
| KI | 2,133.8 |
| NaI | 2,081.9 |
| NaBr | 3,435.9 |
| Na2MoO4 | 3,223.1 |
Table 6 shows that the addition of dopants leads to a significant increase in the required polymer concentration to attain the desired viscosity target. Therefore, it is worthwhile to conduct further investigations to analyze the influence of both polymer concentration and these types of salts on chemical adsorption and retention. Some studies have indicated that polymer adsorption tends to rise as salinity increases [28]. Furthermore, a high-salinity polymer solution may enlarge the hydrodynamic radius of polymer molecules, thereby promoting an increased retention of chemicals [29].
Dopant concentration correlation as a function of the density of the crude oil
Finally, the different oil samples were evaluated to establish the minimum dopant concentrations required for an appropriate contrast between the phases. The value of the oil CT number was used to calculate the polymer CT number required for reaching at least 300 CTs of differentiation among the fluids (Table 7).
Table 7 Density API of the six Colombian oils selected.
| Oil code | API | Density (lb/ft3) | Oil CT | Polymer CT |
|---|---|---|---|---|
| Oil 1 | 34 | 853.9 | -214.1 | 85.9 |
| Oil 2 | 29 | 881.2 | -154.4 | 145.6 |
| Oil 3 | 23 | 915.5 | -111.3 | 188.6 |
| Oil 4 | 22 | 921.4 | -96.9 | 203.0 |
| Oil 5 | 20 | 933.6 | -86.1 | 213.9 |
| Oil 6 | 17 | 952.4 | -48.0 | 252.0 |
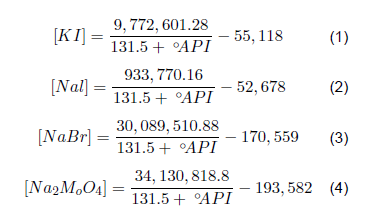
With the CT number required for polymer solution (Table 7), the minimum concentration of each dopant was estimated from the information depicted in Figure 3. This information was related to the oil API density, as illustrated in Figure 5. The correlations were acquired by linear regression and are shown in equations from 1 to 4. As a highlight, it is possible to observe that the coefficient of determination was roughly 0.944 in all cases. These values reflect the high precision degree of correlations for future applications at similar conditions.
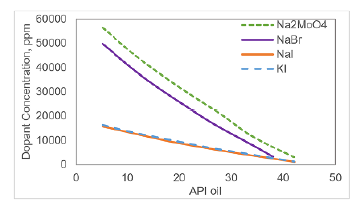
Figure 5 Relation between density API of Colombian oil and minimum concentration of dopants in aqueous phase for having a 300 CT number difference.
These correlations are handy for a broad type of experiments where the operating conditions are changed since, for instance, at low pressure and/ or high temperature the oil density decreases so it is required a lower concentration of dopants. However, the estimation of the minimum amount of dopant and concentration of additional polymer to achieve the target viscosity must be determined in each process if there are important variations in the composition of the water and the types of used polymers because these factors can impact the CT numbers behavior, subsequently, the specific contrast requirements.
Conclusions
The impact of the four dopants used in polymer flooding with computed tomography on solution viscosity behavior was evaluated. Through the outcomes, it has been demonstrated that it is feasible to counteract the adverse effects of dopants on viscosity by increasing the polymer concentration until the target viscosity is attained. This finding holds significant advantages, particularly in dynamic tests, where the properties of the polymer injected can be influenced by the presence of chemical agents. However, it is recommended in future research to analyze the effect that the addition of dopants on the interaction of the polymer with the rock through adsorption and trapping tests, since both the high salts and polymer concentration are characteristics with negative impact on the amount of polymer retained in the porous medium.
The results indicate the sodium iodide (NaI) and potassium iodide (KI) reached the target of contrast fluids with the lowest dopant concentration at 8,686 ppm and 9,125 ppm, respectively, which allowed the lowest increase in polymer concentration to get the viscosity of the base case. These outcomes position sodium iodide as the optimal choice for any prospective polymer injection displacement experiment conducted with the Flopaam (FP) 3,230. Otherwise, sodium bromide (NaBr), and sodium molybdate (Na2MoO4) demonstrated a less favorable profile, demanding higher dopant concentrations that led to a substantial increase in polymer amounts, 4.5 times more than the base case. While these findings present challenges, they underscore the importance of careful dopant selection and its potential impact on solution viscosity.
This work offers a guide for future evaluations involving polymer injection in computed tomography. However, the determination of the minimum amount of dopant and concentration of additional polymer to achieve the target viscosity must be estimated in each process if there are substantial changes in the composition of the water and the types of polymers, since these factors can influence the CT numbers of polymer solutions and, subsequently, in the specific contrast requirements.


