I. INTRODUCTION
Renewable energy is increasing and required in order to decrease dependence on fossil fuels, reduce environmental impact and help developing countries to provide more reliable and safer energy systems [1]. Energy consumed in Colombia that comes from renewable sources (common use of biomass and hydroelectric) is around 22 %, and in a lower percentage the energy that comes from the sun, wind, sea, or biomass for conversion into thermal/electric energy [1-2].
Microbial fuel cells (MFCs) are a green technology and a promising solution to meet future energy needs. On a large scale, this type of biotechnology can be incorporated into domestic and industrial wastewater treatment and electricity production from organic wastes, and to bioremediation of contaminated environments at low cost and efficiently [3]. Also, they can operate at room temperature, do not require gas treatment, and have a wide potential in areas not electrically interconnected [4].
The microorganisms in MFCs convert chemical energy to electrical energy, by oxidizing a substrate at the anode as part of their metabolism. Under anaerobic conditions CO2, protons and electrons are produced, and under aerobic conditions only CO2 and water are produced [5-6]. Power output from these systems are generally low due to their complex design, high internal resistance, and electrode losses [7].
Chemically stable, biocompatible, and conductive materials are used for the anode in the reactor solution, such as carbon products due to their high stability, electrical conductivity, and surface area. Carbon cloth, carbon or graphite felt, activated carbons, carbon paper, graphite fiber “brush”, carbon granules or spheres have been used as electrodes [8-11]. Some microorganisms have direct electron transfer properties from inside the cell to acceptors via highly conductive type-C cytochromes, biofilms, and nanowires. These microorganisms have high coulombic efficiency and can form biofilms on the anode surface, transferring the electrons directly to the anode and resulting in the production of more energy [12].
This work evaluates the production of electrical energy in a MFC on a laboratory scale. We will be using activated carbons as anodes in a chamber that contains a conventional medium suitable for Shewanella putrefaciens. This microorganism has previously been used as an electrogenic organism [13-15], given its versatility of growth, and anaerobic and aerobic powers. Furthermore, it is a Gram-negative bacterium and can transfer electrons directly to the electrodes to generate small electrical currents.
II. MATERIALS AND METHODS
The following section describes the anode chamber construction, morphological and superficial characterization of the activated carbons used as anodes, and the electrochemical measurements carried out in the MFC.
A. Microbial Strains, Medium and Cultivation
Bacterial strain S. putrefaciens ATCC 8071 was held in cryovials, cultivated aerobically in 50 mL of Luria Bertani (LB) medium (Bacto Tryptone, Yeast Extract, NaCl and supplemented with Lactate at pH 7.4). Bacterial cells were harvested by centrifugation (1500 rpm, 15 min, 4 ° C) and washed with buffer solution, after 36-48 hr of incubation at 160 rpm and 30 °C. Finally, the cells were suspended in 250 ml of LB broth at 1.5×10⁸ cells / ml.
B. Synthesis, Characterization and Surface Morphology of Activated Carbons
Material Q is an activated carbon (CA) obtained from coffee husk by using phosphoric acid (H3PO4) at 85% as an activating agent with mass ratio of husk/ H3PO4 of 2/1 at 500 °C for 1 hr 5 °C/min. Material A is a CA obtained from anthracite, using 6M potassium carbonate (K2CO3) as an activating agent with mass ratio of Anthracite/K2CO3 of 1/1 to 800 °C for 1 h at 5 °C/min. Finally, material P is a commercial CA from Protokimica S.A.S.
Carbonaceous materials were morphologically characterized by scanning electron microscopy (SEM) in a Jeol, JCM-6000plus, porous and superficial from the construction of N2 isotherms at -196 ° C in an ASAP 2020 Plus (Micromeritics). Specific surface area (ASE) was determined from the isotherm applying the BET model (SBET), size (Dmicro) and the volume of micropores (Vmicro) applying Dubinin-Radushkevich model, the volume of mesopores applying the Gurdtvich (Vmeso). Additionally, bacterial growth on the surface of the carbon electrodes was analyzed by SEM.
C. Microbial Fuel Cell
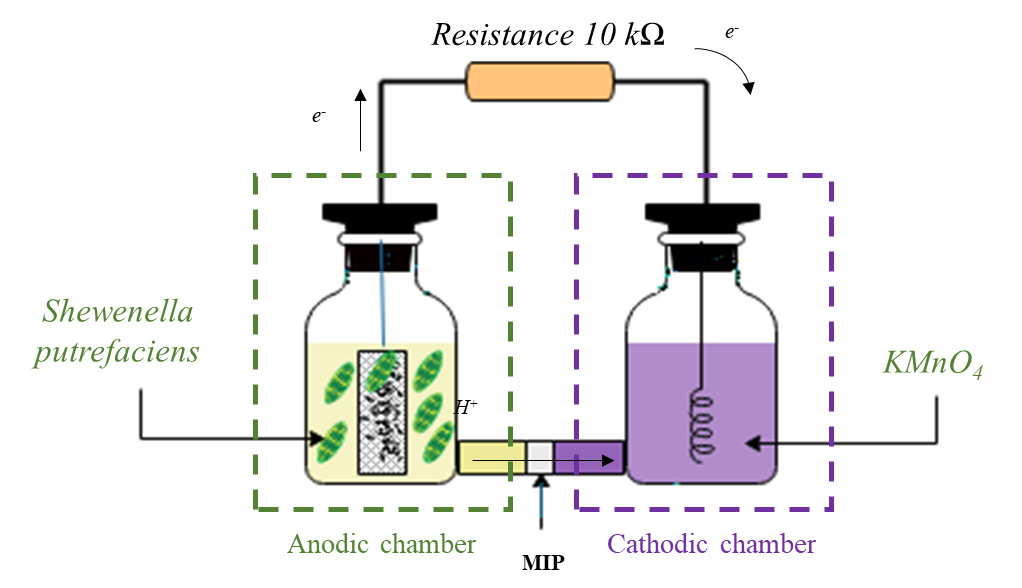
Figure 1 shows a microbial fuel cell diagram with two chambers, each one of 250 ml volume, separated by a membrane of 2 cm diameter. Culture medium was introduced into anode chamber with 1.6 g of CA deposited inside a rectangular mesh (2 cm × 3 cm) of stainless steel to allow continuous contact of the medium with the activated carbons.
Both chambers are separated by a conventional proton exchange membrane (MIP), Nafion® 117 [3]. Membranes were previously activated with 50 ml of a 1% saline solution at 40 °C for 3 hours. In the cathodic chamber, 0.5 mm diameter platinum wire with a length of 25 cm was used in a 0.1 M solution of potassium permanganate (KMnO4) as an acceptor electrode [16]. The electrons produced in the anode chamber flow through an external resistance of 10 kÙ before reaching the cathode.
Voltage and current of the electrochemical cell were measured by connecting a multimeter during 5 to 8 days. Total power of the cell (PRext, W) was determined by measuring cell voltage (Vcelda, V) and external resistance (Rext, Ù), according to Equation (1), and current (I, A) is calculated from Ohm's law according to Equation (2) [12].
Output power is usually normalized with respect to anode surface area (SA, m2), because this is where the biological reaction occurs. The power density (DPA, W/m2) was calculated based on Equation (3) [17].
III. RESULTS
In this section, the SEM microphotographs and nitrogen adsorption-desorption isotherms at -196 °C of the activated carbons are presented. Moreover, the activated carbons were used as electrodes in the anode chamber and their electrochemical performance in the MFC are presented.
A. Anodic Chamber Electrodes
The morphology of the materials used as electrodes in the anode chamber was determined by SEM micrographs that are presented in Figure 2. Coffee husk surface is rough, irregular and undulating [18], and shows a plate morphology with a low specific surface area. The morphology of activated carbon from coffee cisco with H3PO4 (Q) is observed in Figure 2a. The structure of sample Q is composed by “flakes” or dishes that form cavities and wide macropores, similar to the materials prepared by Maimulyanti et al. [19]. Its porous structure is made up of homogeneous pores (figure inserted in Figure 2) compared to the coffee husk activated with NaOH/CO2 by Ahmad et al. [18]. Also, sample Q shows deep pores compared with the coffee husk activated with ZnCl2 by Kosaiyakanon et al. [20], which surface has shallow and heterogeneous craters.
Figure 2b shows the morphology of activated carbon A, which appears to be a dense structure, with large, smooth, and cracked faces, with a slight presence of macropores (Figure 2b inserted). Finally, activated carbon P morphology (Figure 2c) shows large surfaces, with smooth sections and others with high roughness that promote the formation of a porous structure.

Fig. 2. SEM micrographs of the granular activated carbons a) Q and figure inserted at x1000, b) A and figure inserted at x800, and c) P.
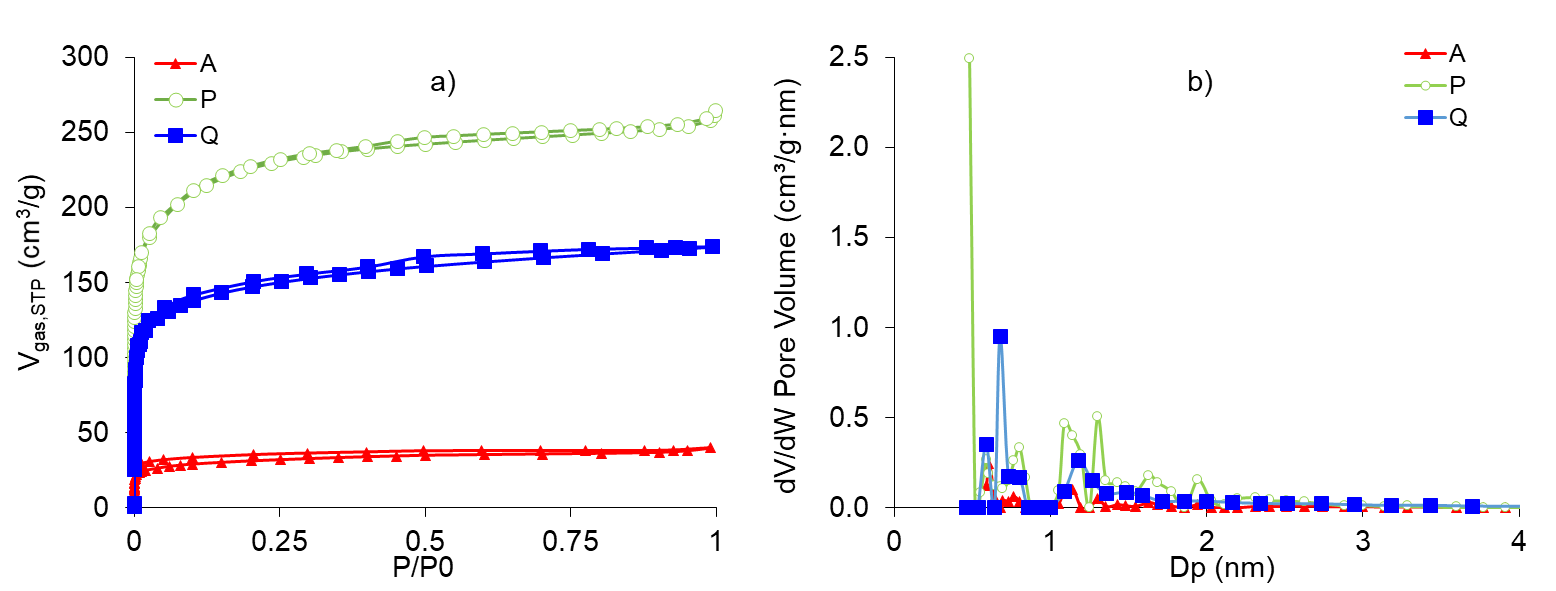
CAs presented mainly microporous characteristics, type I isotherms according to the IUPAC [21], with the presence of small mesopores in samples P and Q. Activated carbon P showed the highest value of SBET = 816 m2 / g, followed by Q = 541 m2/g and A = 114 m2/g. Micropores size was very similar for the three activated carbons, varying between 1.20 and 1.31 nm, while sample Q had a greater external surface area of 135 m2/g compared to samples P of 62 m2/g and A of 9.6 m2/g. Nitrogen adsorption-desorption isotherms at -196 °C are presented in Figure 3 and specific surface values and porous properties of the activated carbons are presented as supplementary material.
B. Electrochemical Cell Characterization
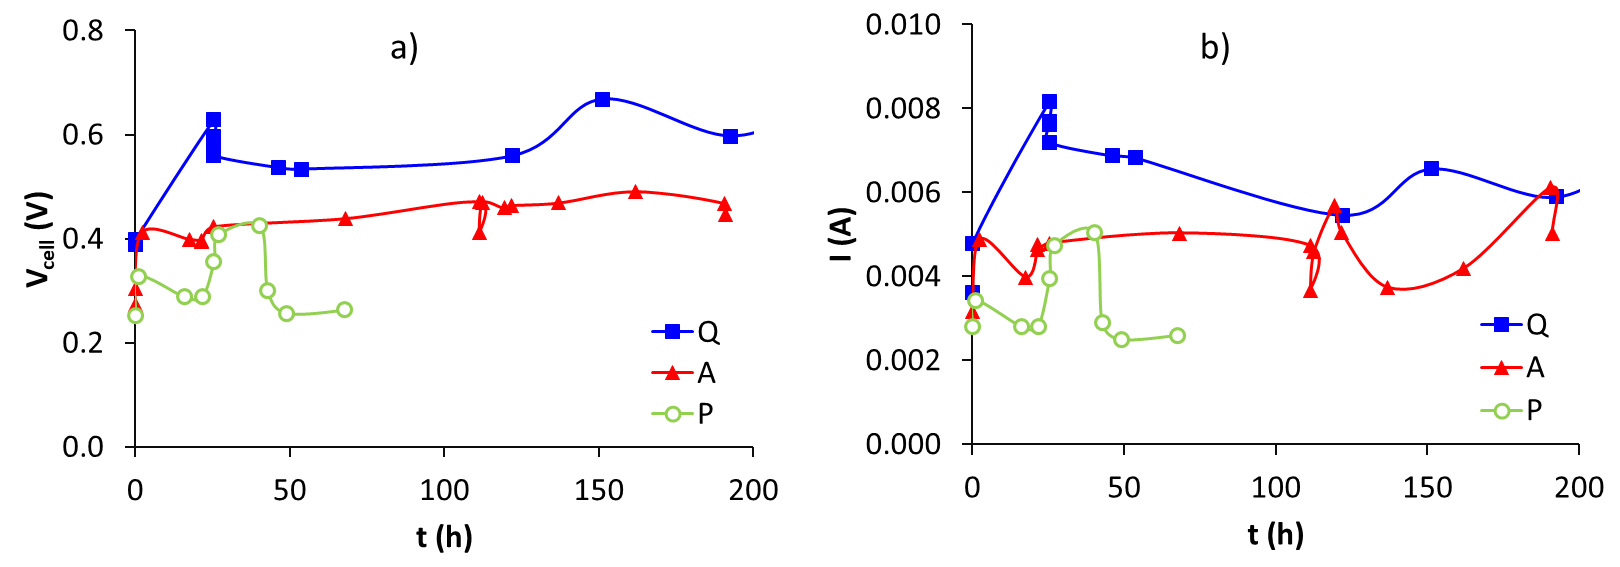
Figure 4a shows the voltage values as a function of time. Sample Q showed the highest values followed by sample A and finally by sample P. These results may be related to a greater capillary force that allows migration of the aqueous medium towards the macropores and later mesopores that improve the wettability of the surface [11]. Voltage values and trend obtained were similar to those presented by Kim et al. [12]. In this work graphite cloth was used as an electrode. Furthermore, it is observed that the output voltage reaches a stable behaviour after 50 h. Figure 4b shows an increase in current, followed by a decrease as time goes on. This behaviour is similar to the results presented by Schoen [9], who used carbon fibers as electrodes in the anode chamber.
IV. DISCUSSION
It can be seen, in Figure 5a, that carbon Q showed the highest values of power of the anode. Two maximums were observed, one of 0.039 mW at 25 h and another of 0.045 at 150 h. When using carbon Q, the highest activity of the microorganism occurs during the first 30 h of the microbial fuel cell performance. Subsequently, a decrease in current was observed, which may be related to the diminishing of the substrate in the medium. As the microbial population decreases, the electron transport decreases too. Substrate availability has a significant influence on bacterial population growth and the formation of the biofilm in the anode, and therefore in the performance of the power density and cell efficiency [6]. The increase in power after 120 h of cell operation may be related to the feeding of live microorganisms with the dead population.

Fig. 5. a) Power versus time, and b) Power density versus cell current density for granular activated carbons at the anode.
Otherwise, P and A carbons presented power values between 0.008 mW and 0.018 mW, and between 0.006 mW and 0.024 mW, respectively. The increase and decrease in power presented by Q are also observed in the performance of coals P and A. Although the carbon P showed the highest specific surface area it showed the worst electrochemical performance, which indicates that not all the area provided by the micropores was in contact with the microorganism, the formation of micro-beds was less and therefore the transfer of electrons decreases. Some researchers use a lower external resistance (1 kÙ) and larger external surface areas of the electrodes (25 - 50 cm2), to maximize cell performance. The power density (DPA) respect to the anode current density (DIA) is directly proportional. Carbon Q showed the highest values, followed by A, and finally, by carbon P. These values were similar to Zhang et al. [22] and Cui et al. [11].
Biofilm formation change according to the kind of microorganism, its growth occurs in three stages: microbes, glycocalyx (secreted polymer matrix that protects bacteria on the surface) and a surface [23-24]. According to Yang [25], S. putrefaciens is one of the most versatile bacteria regarding its respiration. Furthermore, once the electrode is covered with biofilm, the donation of the electrons could take place directly from the biofilm or it could act as a mediator between the electrode and the organic matter suspended in the medium.

Fig. 6. SEM microphotographs of activated carbons surface a) Q, b) A, and c) P after the electrochemical process.
It can be seen in Figure 6, those microorganism wastes remain on the surface of the three activated carbons, which can be associated with the biofilm. These wastes are not uniform and show a length between 1 µm and 3 µm (Measurements are presented in supplementary material). The S. putrefaciens microbeds are like to those presented by Cui et al. in composite materials from polyaniline, graphite cloth and carbon nanotubes [11]. Carbon Q (Figure 6a) showed a surface completely cover by rod-shaped microorganisms, and they have slightly adhered to the surface and some overlap on others, suggesting that this biofilm is made up of several communities of microbial cells [26]. The microorganisms adhered to surface of carbons A and P were spherical shape and in some parts of the surface were difficult to identify. The open structure or ““flakes” morphology of the carbon Q allowed a greater biofilm formation and adherence to the surface, which improved the electrochemical performance of the cell.
V. CONCLUSIONS
The anode material acts an important role in the production of electricity, since, depending on the nanostructure, the electron transfer and power density of the MFC can be improved. S. putrefaciens is an exoelectrogenic microorganism, that produces electricity that can use electrodes as electron acceptors. The macroporous morphology of activated carbon from coffee husk improved the microbeds attachment on the surface of the electrode. This improves the metabolism of this microorganism through the MFC anode and promotes the extracellular transfer of electrons.


