1. Introduction
Over the last few decades, drying alternatives have been proposed to take advantage of natural energy sources, such as solar drying. With this type of drying, it is possible to reduce the moisture content of foods and generate an antimicrobial effect due to ultraviolet radiation 1-4. In general, solar drying uses natural air convection for dehydration, and thus, it should be controlled according to the climatic conditions of the area5-8. This means that operation should be performed in time intervals where the dry bulb temperature and relative humidity within the dryer are high and low, respectively, compared to the environmental conditions to avoid reaching the dew temperature and, therefore, the air saturation, which can affect the drying efficacy of the material of interest9. On the one hand, the high surface area is a desired characteristic of the wet product (to be dried). In contrast, low hygroscopicity and low degradation of bioactive compounds are desired characteristics of the already dried product.10,11. In this sense, attributes such as porosity, phase transition temperatures (e.g., fusions, vitreous transitions, volatilizations), component degradation, specific surface area, and structural shape, among others, can provide information about the effect of solar drying on food, and allow rapid comparison with another drying12. According to previous studies, the effect of solar drying on the physicochemical, biological composition, and moisture of different plant food matrices has been analyzed, finding, in some cases, a slight decrease in compounds such as proteins, lipids, fiber, and carbohydrates10,13. Concerning biological composition, it is reported that there are decreases in aerobic mesophylls, Escherichia coli, fungi, and yeasts7,8. Regarding moisture, it reaches equilibrium values of 4-8 % (dry base) after six hours of drying at air temperatures between 40 °C and 42 °C but this applies to geographical regions where the temperature inside and outside the solar dryer is kept approximately constant during drying (also with an inside temperature higher than the outside temperature), and the vapor pressure in the air is lower than the vapor pressure due to the moisture held inside the product. Otherwise, the equilibrium moisture content in the product will change depending on these weather conditions14,15. Regarding antioxidant compounds, solar drying promotes the increase specifically in total phenols and flavonoids in plant food matrices16,17. The effects on the thermodynamic and morphological properties of plant matrices report mass losses of less than 10 % at nearly 100 °C associated with dehydration, mass losses of 60 % after 180 °C due to degradation and volatilization of compounds in addition to changes in morphological structure, density, and pore size distribution18,19.
Bee pollen is the agglomerate of gametes from flowers collected by worker bees and mixed with nectar, honey, and salivary fluids and then packaged in honeycomb cells in the hive. It is also collected by bees related to the Apis mellifera species, serving as the hive's nutritional source of protein and lipids. Bee pollen is constituted by fine microscopic particles of variable sizes and shapes (20 µm - 45 µm), agglomerated in the form of spherical pellets12,21,22. The nutritional composition is mainly determined by carbohydrates (40 %), proteins (23 %), lipids (6 %), vitamins (2 %), phenolic compounds, and other bioactive compounds (2 %) on a dry basis23,24, which makes it nutritious for the human diet and gives it possible beneficial health effects25,26. However, due to its high nutritional content and high moisture value at harvest time, it is a product highly susceptible to contamination and the growth of microorganisms, then it is necessary to apply processes such as drying to prevent its deterioration21,23. Conventionally, bee pollen is subjected to dehydration, preferably through forced convection drying with temperature control 17 instead of sun drying, mainly due to cultural factors and false beliefs that attribute adverse effects to bee pollen when exposed to the sun. On the contrary, solar drying represents a cost-cutting alternative instead of electricity8. Nevertheless, in the literature, there is little information available for this type of characterization in beekeeping products; consequently, this is one of the first works that focus on evaluating the true effects of heat treatment in a solar dryer on the physical structure of bee pollen. For this reason, the aim set out in this work was to analyze the effects of solar drying on the morphology, and the thermogravimetric and calorimetric properties of bee pollen compared to conventional cabin dehydration processes. The results are valuable to strengthen the industrial use of solar drying as an alternative to cabin drying due to its low operating cost, which benefits beekeepers given the reduction of energy consumption.
2. Material and Methods
2.1 Samples
Bee pollen samples were collected from Viracachá, Boyacá, Colombia (Coordinates: 5° 26’ 11"N 73° 17’ 46"O) between January and March 2019. After collection, the samples were sieved to remove the largest impurities (solid waste, animals, and vegetation) with a Tyler series mesh #6. Afterward, fresh bee pollen was hermetically packaged in 250 g opaque glass containers and stored in a dark room at 25 °C until testing.
2.2 Methods
2.2.1 Solar drying tests
The bee pollen was arranged in stainless steel metal trays with 2 mm perforations, with dimensions 1.5 m long and 1 m wide, adding a 1 cm layer of bee pollen for uniform dehydration over time. Available sunlight in the study area typically ranged from 8 am to 5 pm, and natural convection of the air inside the solar dryer was used. Samples of 250 g were taken every hour until nine hours of dehydration. In addition, dry bulb temperature and relative air humidity data were recorded inside the dryer with a digital thermohygrometer at three different points of the dryer and at the same height as the position of the trays (90 cm from the ground).
2.2.2 Cabin drying
The bee pollen was arranged in stainless steel metal trays with perforations of 2 mm, with dimensions of 1.2 m long and 0.8 m wide, adding a 1 cm layer of bee pollen in the tray to have uniform dehydration, using a forced convection oven. The dry bulb temperature was 55 °C ± 2 °C and drying lasted nine hours. Samples of 250 g of pollen were taken at the end of drying.
2.2.3.1 Scanning Electron Microscopy (SEM)
Ten g samples of dried and fresh pollen (<0.1 mm) were weighed and coated with a layer of 2 mm gold. The measurement was performed on a Quanta 200 (Thermo Fisher Scientific, Oregon) using a secondary electron collector and a working distance (collector) of 10.3 mm. The test was performed under vacuum and at a stable temperature of 18°C. The working voltage was 30 kV with a magnification of 6000x27,28.
2.2.3.2 Differential Scanning Calorimetry (DSC)
The test was performed on a 40 µL capsule where 5 to 7 mg of either dried or fresh pollen samples were added, with a dynamic temperature segment of 0 °C to 200. °C, with an increment rate of 12 °C/min. Additionally, the atmosphere of use was nitrogen with a flow of 50 µL/min. The measurement was performed on a DSC 1 - Star System calorimeter29.
2.2.3.3 Surface area analysis
Initially, the dried and fresh bee pollen was milled until it passed through a mesh of the Tyler series # 80. Subsequently, 10 mg of the sample was weighed and degassed in aluminum-coated ceramic chambers where a vacuum up to 76 mmHg was used for 50 hours to ensure the removal of gases on the surface. The sample was placed inside an adsorption chamber at 30°C, using nitrogen as a drag gas. The area of the BET monolayer (Brunauer-Emmett-Teller) was calculated, performing the same analysis for the entire bee pollen. The equipment used was a Gemini 2375 surface area analyzer30.
2.2.3.4 Thermogravimetric Analysis (TGA)
The test was conducted with a sample of 10 mg of dried and fresh bee pollen in an inert nitrogen atmosphere with a flow of 40 µL/min using a dynamic range of 10 °C/min and a controlled temperature between 0 °C and 200 °C for the determination of volatile compounds. A reactive oxygen atmosphere was used for combustion in a dynamic temperature range between 0 °C and 700 °C. A TGA-DSC 1 Star- System equipment was used29.
2.2.3.5 Environmental measures
Luminosity intensity (Lux), relative humidity (%), solar dryer temperature (°C) and room temperature (°C) were measured in triplicate on two different dates. Pyranometer UEI DLM2 light meter was used to measure luminosity intensity at the inlet and mid-height of the dryer. Digital thermometer EBCHQ (ref: 94196) was used to measure relative humidity and temperature inlet and outlet from the dryer and at mid-height of the dryer.
2.2.3.6 Statistical analysis
The data related to environmental measures, DSC, TGA, and surface area analysis were performed in triplicate. Statistical analysis was performed using a one-way ANOVA test complemented by The Tukey test with a significance level of 95 %. The analysis was carried out using Statistix® and Microsoft Excel®.
3. Results and Discussion
3.1 Effect of solar drying on pollen grain morphology
Figure 1 shows the effect of the solar drying process on the morphology of two characteristic palynomorphs of bee pollen used in this study, compared to the effect of a conventional drying process (cabin drying by forced air convection), evaluated through SEM. The pollinic structures (A) and (A') correspond to fresh bee pollen grains of spiculate and cross-linked palynomorphs, respectively. Palynomorph (A) belongs to the Asteraceae family, while (A') belongs to the Escallonia pendula family31. The structures (B) and (B') correspond to the same palynomorphs after solar drying, and the structures (C) and (C') correspond to the palynomorphs after cabin drying. Regarding spiculate palynomorphs (A, B, C), it can be seen they have a spherical shape with macropores and hairs that make up the typical pollinic structure of Asteraceae. Minor changes are observed in the form of the exine of fresh pollen grains (A), after solar drying (B), and in the cabin (C). In this fresh palynomorph (A), it is appreciated that macropores are deeper than in (B) and (C). It is important to mention that the exine corresponds to the outer layer of the bee pollen grain, which is composed mainly of sporopollenin, resistant to hydrolytic enzymes and some chemical solvents. This compound is not currently known in detail, but it is known that its conformation is mainly given by compounds similar to lignin, ethers, esters, cross-linked lipids, and cinnamic acid derivatives12. In previous studies of drying, microencapsulation, and fermentation, it has been observed some changes in exine occurred at high temperatures and/or radiation12,32-34, where at temperatures above 136 °C there is the formation of alkanes, alkylphenols, and alkenes, however, since drying processes occur at an average temperature close to 50 °C, and there is no greater effect on the exine. On the other hand, the hairs of the fresh spiculate palynomorph (A) are thicker and present in greater quantity than in structures (B) and (C). It can be said there are slight erosions on the surface (exine), where it is possible to observe that the number of hairs is reduced in size and quantity. In general, no noticeable damage or swelling is observed in the pollen structure, which could be assumed to indicate a visible change between drying treatments. For the second palynomorph, the characteristic ellipsoidal shape with a cross-linked surface can be observed both in fresh pollen (A'), dry pollen by solar drying (B'), and dry pollen by cabin (C'). Concerning the surface structure of these pollinic structures, some slight deformations were observed in the outer layer, but it is generally possible to state that, in this case, there was also no damage or swelling in the integral structure, verifying that there was no noticeable qualitative difference between drying treatments on the bee pollen structure. This is consistent with previous studies12,14.
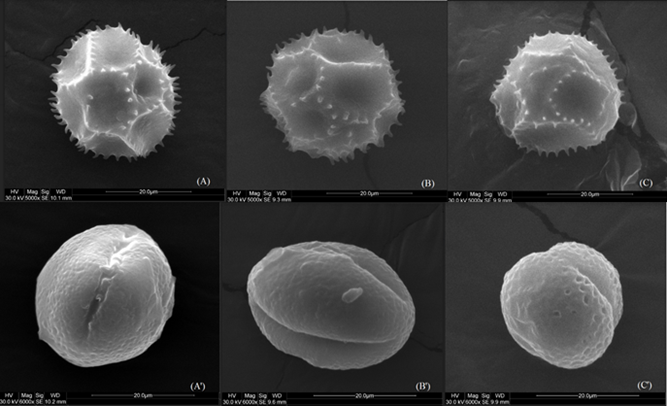
Figure 1 Bee pollen microphotographs A) Fresh, B) Solar-dried, C) Cabin-dried, A') Pollinic structure type "ellipsoidal cross-linked" for fresh bee pollen, B') Pollinic structure type "ellipsoidal cross-linked" after a process of nine hours of solar drying, C') Pollinic structure type "ellipsoidal cross-linked" in a cabin dryer.
In addition to the bee pollen effects of the solar drying, luminosity intensity (Lux), relative humidity (%), solar dryer temperature (°C) and room temperature (°C) were measured in triplicate on two different dates.
The solar radiation data in Figure 2 was measured with a solar radiation device, and the comparison between the radiation and humidity-temperature stability indoors and outdoors showed that radiation variance did not affect humidity and temperature stability. In addition, weather conditions did not affect samples, and humidity had changed only during the first three hours, which is consistent with the above on the preservation of the surface area structure of bee pollen.
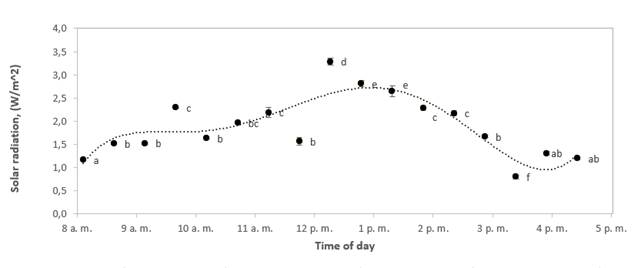
Figure 2 Variations of solar radiation with time of day for a typical experimental run during solar drying of bee pollen. Different letters mean significant differences (alpha< 0.05)
In Figures 3 and 4, while the solar dryer temperature reached stability at 10 am, humidity indoors the dryer kept on decreasing until 1 pm. This behavior shows that at a constant temperature, the relative humidity will reach equilibrium as expected, and possibly all solar radiation energy is not used to reduce the humidity in the air. Also, the maximum humidity absorption capacity of air changed from 3.0 g water/kg dry air to 5.7 g water/kg dry air. These values were calculated using the psychrometric chart by taking the dry bulb temperature, and relative humidity at 8 and 11 am using Figures 4 and 5 (where an approximately constant temperature begins inside and outside the solar dryer). Air to saturation with a relative humidity of 100 % was assumed for this calculation. These values were plotted on a psychrometric chart to find the humidity ratio (specific humidity) in g water/kg dry air. Then, the adiabatic cooling line was followed (wet bulb temperature), and the new humidity ratio (specific humidity) was found where the air was saturated. The differences were made between the initial and the final values, and the change was found, which is the maximum moisture carrying capacity at 8 am and 11 am reported above.
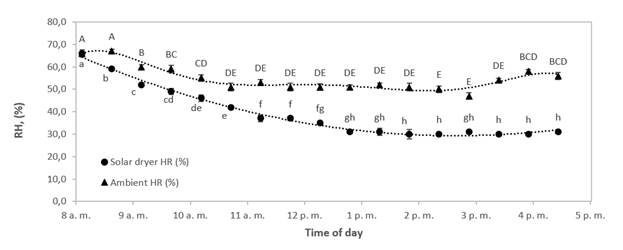
Figure 3 Variations of indoor relative humidity in solar dryer and ambient relative humidity with time of day for a typical experimental run during solar drying of bee pollen.
Different letters mean significant differences (alpha< 0.05) )
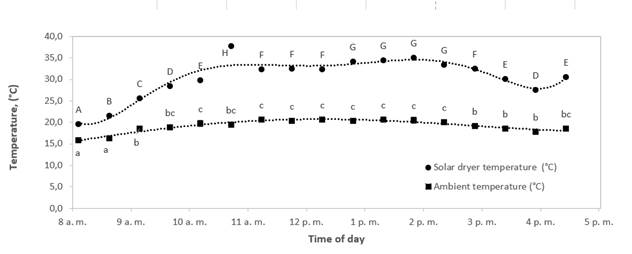
Figure 4 Variations of indoor temperature in solar dryer and ambient temperature with time of day for a typical experimental run during solar drying of bee pollen.
Different letters mean significant differences (alpha< 0.05)
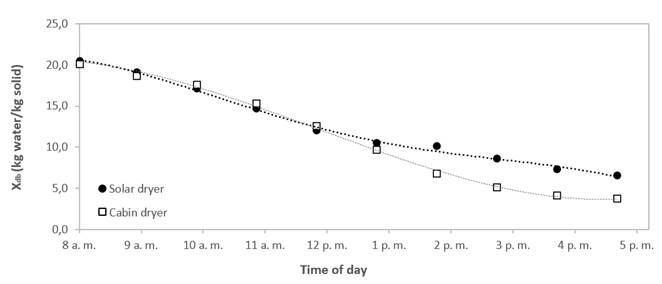
In addition, Figure 5 presents the drying curve. The moisture content in the solar dryer went from 21,03 % (d.b.) to 6,51 % (d. b.) for 9 hours, and in the cabin dryer, bee pollen went from 21,01 % (d.b.) to 3,74 % (d.b.) that is equilibrium moisture for the same period. The curve of the solar dryer showed that the moisture content remained similar to that of the cabin dryer during the first hour up to the fourth hour (in addition to the fact that in this section, the constant drying rate for solar drying was 0.031  and for cabin drying was 0.030
  ) (alpha< 0.05). After that, the drying rate in a cabin dryer was higher than solar dryer because the temperature and air conditions allowed better water removal.
This result is consistent with the information presented above because the final moisture content in bee pollen in a solar dryer was higher than cabin dryer. This could contribute to keep the surface structure undamaged because the exine was not completely exposed to radiation that might be hazardous for surface compounds of bee pollen. Besides, this moisture content protected the structure. This result was similar to those reported by Durán et al. 1 who studied the effect of solar drying on antioxidant compounds of bee pollen and showed solar radiation was not harmful to bee pollen compounds (carotenoids and phenols). This type of drying is an alternative to traditional dehydration. In addition, the average solar drying conditions are also reliable for bee pollen drying because capillarity and diffusion mass transfer are feasible according to the drying kinetics data.
Based on these results, employing a less invasive process in the product, such as solar and conventional drying, results in a milder alteration in grain morphology, and the characteristic geometry can be preserved after these treatments.
3.2 Effect of solar drying on the calorimetric profile of pollen
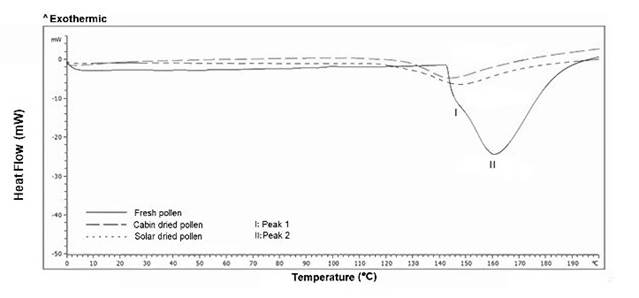
The results obtained for DSC and TGA are presented in Figures 6 and 7, respectively. The thermogram in Figure 6 shows that there were two endothermal phase transitions, one at 148 °C (I) and one at 160 °C (II), for fresh bee pollen. When analyzing this thermogram, it is possible to observe a first phase transition (148 °C) which represents a 10 % mass loss in fresh bee pollen; meanwhile, decreases of 5 % and 6 % were found for cabin and solar dried bee pollen, respectively. In addition, the second phase transition (160 °C) was not observable in dried samples. This indicates that the phase transition corresponding to peak I in Figure 6 was due to water loss. Zuluaga et al. 35 performed a DSC analysis on fermented pollen with Lactic acid bacteria, finding a slight change in thermal profiles below 140 °C, associated with the loss of evaporated free water; with this information, it can be validated that the results are consistent with other reports. The second phase transition (160 °C) could be associated with the loss of volatile compounds. Ahmed et al. 36 and Zuluaga et al. 12 reported that at temperatures close to 180 °C, the loss of volatile compounds could occur due to the weakening of the exine, and at higher temperatures begin formations of aliphatic compounds and hydrocarbons, therefore the results obtained are validated.
This would explain why this peak was not visible in dried bee pollen samples, where there can be a significant loss of volatile compounds. The energy required for each of the phase transitions was obtained through the integration of the area under the thermogram curve (Figure 6). Fresh bee pollen had a total value of 381 kJ/kg, while dried bee pollen had 93.4 kJ/kg pollen and 108.4 kJ/kg in both cabin and solar, respectively. The quotients between these energies and the mass fractions of water in the corresponding bee pollen samples, both fresh and dry (0.170 g/g and 0.047 g/g, respectively), had values between 2241 and 2309 kJ/kg of water. These values were very close to the enthalpy of water evaporation which is 2257 kJ/kg, according to Perry et al. 37.
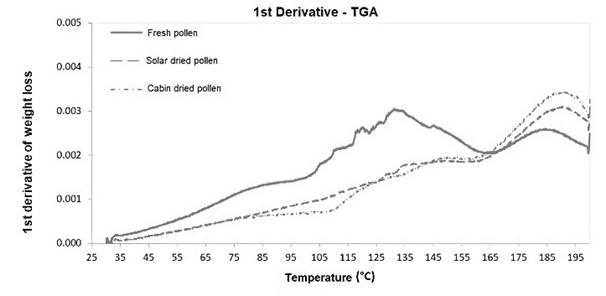
The difference in phase transition temperature for cabin-dried bee pollen (Figure 6) compared to fresh and solar-dried could be due to the above-mentioned exine degradations and/or structural changes, which could also indicate a possible change in exine38. On the other hand, Figure 7 shows the loss of mass for fresh, cabin-dried, and solar dried bee pollen with respect to temperature, occurring in two specific stages: the first stage is presented at 130 °C which corresponds mostly to the loss of free water, where the mass loss by the integration of the peaks were 13 %, 6 % and 7 % for fresh, cabin-dried, and solar dried bee pollen, respectively. The second stage is observed at 190 °C, corresponding to the loss of mass of volatile compounds 36 of about 14.5 %, 13.4 %, and 12.2 % for fresh, cabin-dried, and solar-dried, respectively. It is also possible to see in Figure 7 that at 200 °C, there was a cumulative loss of total mass of 29 % in fresh bee pollen, while this loss is 22 % and 21 % for cabin-dried and solar dried, respectively. Results found by Sebii et al. 39 and Zuluaga et al. 12 showed mass losses of 30 % for temperatures close to 170°C, which were distributed in two stages: the first between 50 °C and 60 °C, associated with water evaporation, and the second stage between 170 °C and 190 °C, associated with the liberation of volatile compounds.
When comparing these results with those obtained by SEM, it is possible to observe that slight changes in the surface layer of exine in dried bee pollen samples could be due to reduced moisture, but there was no damage or swellings in the morphological structure. Therefore, the behavior of solar drying is like cabin drying, which implies that the solar drying process is an adequate and reliable process for dehydrating bee pollen.
3.3. Surface area analysis
An important aspect of the morphological and textural characteristics of bee pollen is porosity, which represents a useful feature for fields such as microencapsulation, fermentation, and drying 14,40,41 since it can be useful to establish if the material suffers any structural change when undergoing different treatments and knowing if the material has porosity. For both cabin and solar dried pollen, it may indicate the differences or similarities between drying treatments; this, in turn, highlights the importance of morphological analysis in food because structural integrity may represent an indirect measure of the effects of different treatments on the surface structure that could impact nutritional and microbiological changes. This study is a pioneer in bee pollen porosity analysis before and after drying treatments due to the little information available on the subject.
The result of the surface area analysis is presented in Fig. 8. The absorption curves show the results of the volume absorbed for cabin-dried and solar-dried bee pollen. For values less than a relative pressure of 0.95, it can be observed that the volume absorbed is zero for bee pollen samples from both cabin and solar dryers, but for values greater than 0.95 in the relative pressure, it was obtained an increase in the absorbed volume that could not be considered as porosity. In this sense, bee pollen samples did not show pore size distribution, according to previous studies, which is obtained through treatments with zinc oxide and other materials40,42, but they did have deformations and concavities that allowed mass transfer by capillarity and diffusion. Studies made by Benavent et al. 43 on the evaluation of porosity in starch samples subjected to amylolytic enzymes showed a greater porosity and absorption of water or oils, indicating that morphology plays a fundamental role in conditioning processing. On the other hand, Sozer et al. 44 report that porosity depends on the cell shape and size, relative density, and composition-thickness of the cell wall. In addition, these characteristics establish the morphology and textural properties of different foods related to sensory properties.
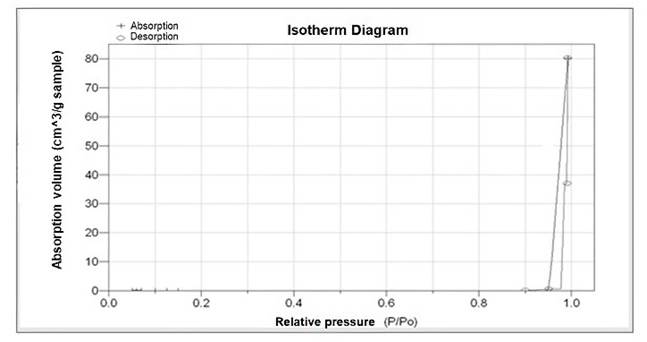
Figure 8 Measured adsorption isotherm for microscopical dried bee pollen (same isotherm for the two treatments) where a fixed surface area without porosity is observed.
Thakur et al. 45 reported that the different botanical origins of bee pollen affect its physical and textural properties, where porosity varies according to the origin and directly affects thermal stability, so the greater porosity, the less thermal stability. Knowing these reports, it is possible to understand the importance of morphology in bee pollen, necessary to include it as a determining factor of characterization. These results, together with those obtained in DSC, DTG, and SEM, make it possible to establish that there was no damage to the bee pollen structure when subjected to solar drying, and the comparison with cabin drying showed similar behavior and, therefore, strengthens the use of solar drying as a dehydration alternative for plant-origin foods.
Conclusion
The results obtained in SEM micrographs, DSC-DTG thermograms, and the adsorption diagram made it possible to consider that solar drying did not cause damage or swelling on the bee pollen structure, then solar drying can be considered appropriate for dehydration with a similar outcome to cabin drying because the final moisture content in the solar dryer was 6.51 % (d.b.) and in cabin dryer, bee pollen was 3.74 % (d.b.) for 9 hours of drying. This condition allows the establishment of another reliable alternative for drying bee pollen intended for beekeepers, contributing to reducing energy costs. The energy needed for the endothermal phase transition for solar-dried bee pollen was 108.4 kJ/kg with a mass loss of 22 % compared to cabin-dried bee pollen, which was 93.4 kJ/kg with a mass loss of 21 %, indicating that there was a similarity between the thermodynamic changes of the two types of drying. The above results were coherent with the results of SEM and surface area analysis, which showed that the decrease in the level of moisture in bee pollen generated slight surface changes in the exine without major modifications, although the change in the transition from an endothermic phase in dehydrated bee pollen in the cabin (144 °C) and dehydrated bee pollen in the solar dryer (148 °C) occurred due to structural changes associated with weakening of the exine and possible generation of new structures. In addition to these considerations, bee pollen did not show porosity (for characterized samples) because there was no increase in adsorbed volume during the applied adsorption treatment demonstrating that the material did not have structural damage as already seen in the SEM and DSC analyses. Future research should focus on monitoring the microbiological and bioactive behavior, which complement what is obtained in this research in a way that provides more judgmental tools that contribute to the use of this type of drying.


