INTRODUCTION
The global circulation belt is maintained thanks to the formation of deep-water masses in the northern Atlantic, one of whose drivers is the high salinity of the Atlantic Ocean, which, among other factors, is due to the transport of atmospheric moisture from the Atlantic towards the Pacific, mainly taking place by means of the Panama Isthmus (Zaucker et al., 1994; Benway and Mix, 2004). Thus, the Pacific Ocean receives moisture from the Atlantic Ocean through the atmosphere, which, by means of precipitation, maintains a salinity lower than that of the Atlantic, resulting in a salt gradient between these two oceans, which is fundamental for global circulation (Zaucker et al., 1994; Rahmstorf, 1996).
Variations in sea surface salinity originate in freshwater flows across the surface, with a balance between advection, vertical mixing, evaporation (E), and precipitation (P) (Martins and Stammer, 2015). Near the continents, river discharge (R) also plays a fundamental role. In the study region, towards the Pacific, the Eastern Pacific Freshwater Pool (EPFP) is the area of the eastern tropical Pacific that maintains salinities lower than 34, with a core of values lower than 33 at the corner of Central and South America in the Panama basin (Alory et al., 2012). According to Benway and Mix (2004), this low salinity is the product of an excess of precipitation over evaporation under the Intertropical Convergence Zone, together with freshwater flows from the Andes and the Caribbean region. The Caribbean side receives less precipitation and undergoes a higher evaporation than the eastern tropical Pacific, which explains its saltier waters (Amador et al., 2006). However, even though the southwestern corner of the Caribbean Sea is a region where evaporation prevails over precipitation under average conditions, the corner between Central and South America (Colombian basin) has a high seasonality, in which precipitation prevails over evaporation during a part of the year (June to November) (Beier et al., 2017).
The atmospheric transport of water between the Caribbean, the eastern tropical Pacific, and northern South America intensifies in several low-level atmospheric jets (Figure 1). The Caribbean low-level jet (CLLJ), with a predominant East-West direction, is associated with a great portion of the moisture transport from the tropical Atlantic to the Caribbean, taking it up to the Panama isthmus (Cook and Vizy, 2010). A part of this moisture goes onto the Pacific via the Panama isthmus through two topographic straits (the low plains of Nicaragua and Costa Rica and the Panama isthmus), transported by the Papagayo and Panama wind jets (Chelton et al., 2000a; Amador et al., 2006; Kessler, 2006). In the Panama basin (which corresponds to the Panama Cove eco-region), a jet with a direction contrary to the CLLJ (West-East), the Chocó jet (ChJ) (Poveda and Mesa, 2000), transports water towards the continent and feeds the basins of large rivers in Colombia, which mainly pour their waters into the Caribbean. The runoff arriving at the Colombian Caribbean greatly compensates the imbalance between evaporation and precipitation in the Colombian basin, generating a dilution zone south of 12° N (Beier et al., 2017). The seasonal and interannual behavior of the ocean-atmosphere system in the region is conditioned by the migration of the subtropical atmospheric pressure centers and the ITCZ, as well as the aforementioned low-level wind jets.
Moisture transport by advection is the movement of water masses in the form of vapor which is produced as a result of wind circulation. Together with precipitation and evaporation, it determines the local climatic conditions of a territory, such as the presence of droughts or intense precipitations (Schumacher et al., 2020). Mathematically, it is possible to quantify it by means of the product between the specific moisture of a territory and the wind velocity, integrated in a portion of the atmosphere. Thus, moisture transport by advection corresponds to a variable with a magnitude and a direction (Cuartas and Poveda, 2002).
The net moisture transport, which relates the entry and exit flows of an area, indicates whether there are gains or losses (Schumacher et al., 2020) in the atmosphere. In the balance of mass conservation, these compensate with exchange of surface liquid water in the ocean. When the net transport is positive, there is a freshwater contribution to the surface, but, if it is negative, the surface loses water by evaporation. In this way, atmospheric balances can be indicators of oceanic balance and explain salinity changes in oceanic basins.
Thus, water transport between the Caribbean, the eastern tropical Pacific, and the continent in northern South America constitutes a cycle with effects on the oceanography of these two corners of the Pacific and the Atlantic, as well as repercussions in global circulation. However, there is no information about how much water is recirculated in this cycle, how much is exchanged outside it, and how the water balances are coupled to seasonal and interannual conditions within the cycle. Therefore, the purpose of this research was to make a conceptual representation of the water cycle in the SW area of the Caribbean Sea, northern South America, and the eastern tropical Pacific. To this effect, the atmospheric water flows in the Caribbean and Pacific catchment areas (including the continent and the ocean) were quantified, and the balances between their inlets and outlets were calculated in different temporal scales (mean, quarterly, and interannual). Given that, in these balances, excess water is received by the ocean and a lack thereof is lost by it. The results are discussed in terms of the oceanography of the SW area of the Caribbean Sea and the eastern tropical Pacific, as well as of its implications in the climate system and its relationship with macroclimatic phenomena.
Quantifying the flows occurring in this cycle allows understanding the climatic interaction of these three regions in boundaries broader than the jets, which is important when it comes to interpreting the results of moisture distribution models in the area. The information regarding balances at different temporal scales is of interest in multiple fields, such as the forecasting of rainfall and river flows for the agriculture and energy generation sectors, policymaking for risk management with regard to rising waters and droughts, or the interpretation of surface salinity forcings in oceanic basins.
METHODOLOGY
In order to calculate the moisture transport between the Caribbean (Colombian basin) and the Pacific (Panama basin), two marine regions were defined along with their corresponding hydrological catchment areas, separated by the mountain range water divide, as shown in Figure 1.
The atmospheric moisture transport was calculated for the boundaries of each catchment area by integrating the flow of mass occurring within an area differential on the walls demarcating each region, according to the methodology of Cuartas and Poveda (2002). To this effect, the meridional and zonal moisture transports taking place at an established latitude and longitude (Equation 1) were calculated and integrated between two pressure levels in the atmosphere (Equation 2).
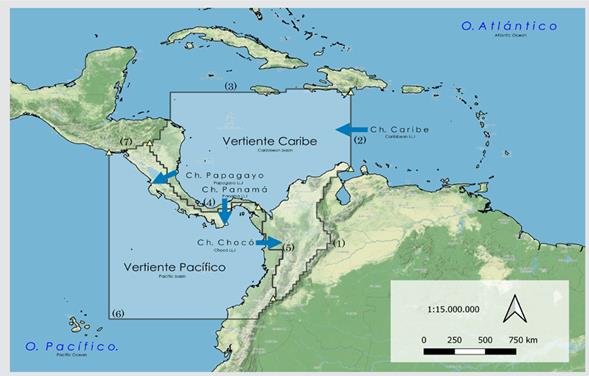
Figure 1 Demarcation of the flow calculation catchment areas and boundaries. Each edge of these boundaries is outlined with yellow triangles as follows: (1) Colombian Eastern Mountain Range, (2) Venezuela Basin, (3) Caimán Basin, (4) Central America, (5) Colombian Western Mountain Range, (6) Pacific Ocean, and (7) Northern Central America. The location of low-level atmospheric jets in the area (Caribbean, Papagayo, Panama, and Chocó) is shown.
In the above equations, q corresponds to the specific moisture, measured in kg of water by kg of air; u and v denote the magnitude of the zonal and meridional components of the wind; dp is an atmospheric pressure differential; g is the acceleration of gravity; pi is the lower limit of the portion of the atmosphere on which the integration is performed; and ps is the upper limit. The meridional moisture transport Q φ (zonal: Q λ ) is obtained from the original component of the wind v (zonal: u). I and J are unit vectors (0.1) and (1.0) representing the direction of the components in space and decomposing the total moisture transport in a pixel.
The data regarding hydroclimatic variables were taken from monthly averages of the ERA-5 reanalysis (Hersbach et al., 2020) for an altitude between 300 HPa and 1000 HPa, which encompasses the vertical magnitude of the Central American jets. The data recording period goes from January 1979 to February 2019, and the spatial resolution is 0.25° × 0.25°. The moisture transport at the boundaries and the balances of each catchment area were calculated for a mean value, the hydrometeorological quarters of Colombia (December-February, DEF; March-May, MAM; June-August, JJA; September-November, SON), and ENSO conditions (Niño, Niña, and Neutral). The ENSO conditions were based on the ONI (Oceanic Niño Index), averaging the transports of all months for each condition. The ONI was selected because it is the most widely used to define El Niño and La Niña events and their duration. Thus, canonic El Niño events were included (1979-1980, 1982-1983, 1986-1988, 1991-1992, 1994-1995, 2002-2003, 2004-2005, 2014-2016, 2018-2019), as well as El Niño Modoki events (1997-1998, 2006-2007, 2009-2010) and La Niña events (1983-1984, 1984-1985, 1988-1989, 1995-1996, 1998-2001, 2005-2006, 2007-2008, 2008-2009, 2010-2012, 2016, 2017-2018). The mean and seasonal salinities, as well as those for each ENSO condition, were taken from the GODAS system (Behringer and Xue, 2004), with data from the 1980-2019 period and a 0.33° N x 1.0° W spatial resolution.
RESULTS
Wind speeds and moisture transport in the low-level jets included in the study area are depicted in Figure 2. Table 1 summarizes the maximum speeds and moisture transports (90 %) for each jet. The maximum moisture advection in the Caribbean and Papagayo jets is offset from the maximum wind speed core. The CLLJ has the highest speed and moisture transport among the jets.
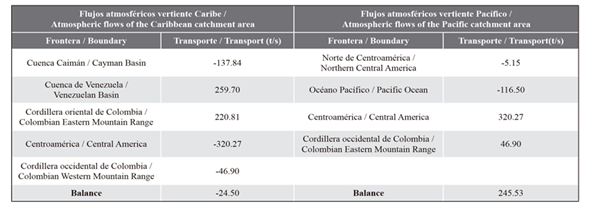
The moisture entry to the Caribbean catchment area (480.5 t/s) is higher than that of the Pacific catchment area (367 t/s), but, in the Caribbean, the moisture exit is higher than the entry (Table 2). Thus, the net atmospheric moisture flow in the Caribbean catchment area is negative, indicating that, in average conditions, the Colombian basin loses water (i.e., the salinity increases). The net flow of the Pacific catchment area is positive, indicating that the Panama basin gains water (i.e., the salinity decreases). Nevertheless, atmospheric moisture losses in the Caribbean catchment area are a tenth of the atmospheric moisture gains in the Pacific catchment area. The net integrated transport values at the boundaries of Central America and the Venezuela Basin are lower than the transport at the core of the Central American and Caribbean jets. The integrated transport of the Western Mountain Range has a resultant in the opposite direction to the ChJ. These results are explained by the high-atmospheric flows in the opposite direction to the low-level jets (Figure 2).
The seasonal balances (Table 3) indicate significant differences in the two atmospheric catchment areas. While the balance is negative in the Caribbean catchment area during the first semester of the year and positive during the second, the balances are positive in the Pacific catchment area in all quarters. The seasonal variability of the Caribbean is higher, with differences between stations of up to 233 t/s in the Caribbean and 92 t/s in the Pacific. The season in which the Caribbean loses the most moisture is DEF, and it gains the most moisture in SON. The station in which the Pacific gains the most moisture is JJA, and it gains the least moisture during SON.
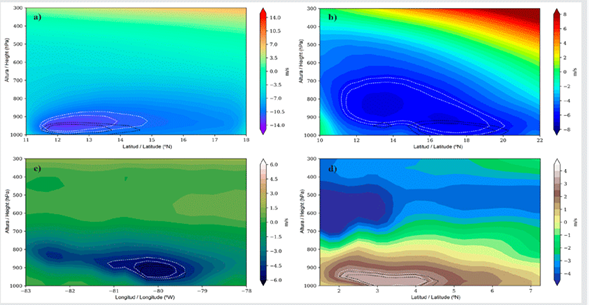
Figure 2 Average wind speed (colors and contours with white dotted lines) and average moisture advection (contours with black dotted lines) in a) the Caribbean jet (71° W, 11° N, and 18° N), b) the Papagayo jet (83,75° W, 10° N, and 22° N), c) the Panama jet (8° N, 78° W, and 83° W), and d) the Chocó jet (78° W, 1,5° N, and 7,25° N). Contours represent the wind maximum speed cores (white) and the maximum moisture transport via advection (black). For both cases, the inner contour represents 95 % of the maximum value found in the profile, whereas the outer contour represents 90 %. Note that the color scales of the wind speed are different for each jet.
Table 1 Wind speed and moisture advection in the cores (90% of moisture advection) for each jet in the area.

Therefore, it does not happen that, when the Caribbean loses more moisture, the Pacific gains more, or vice versa. Given that, in DEF, the highest moisture exit of the Caribbean catchment area heads towards that of the Pacific. The fact that the latter gains more moisture during JJA than in DEF is due to the fact that, during DEF, the Pacific catchment area exports more moisture to the ocean than in JJA. In SON, when the ChJ intensifies, the lowest net transport values are reported from the Caribbean to the Pacific catchment area through the Western Mountain Range.
The responses to the moisture deficits or gains by the atmospheric boundaries are reflected on the salinity conditions of the Colombian and Panama basins. Figures 3 to 5 represent the mean surface salinity and the quarterly and interannual salinity anomalies in these basins. Among the average conditions, the higher salinity of the Caribbean (35.7 - 36.6) with respect to the Pacific (34.4 - 35.2) stands out. In the Colombian basin, the lowest salinities occur at the entrance of the Caribbean current from the Atlantic (waters influenced by the Amazon and the Orinoco) and at the corner of central America. In the Panama basin, the formation of a low-salinity water tongue which corresponds to the EPFP.
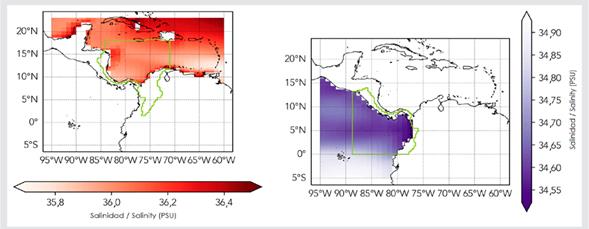
Figure 3 Mean salinity in the SW Caribbean and the Eastern Tropical Pacific. Discontinuous lines indicate the catchment areas’ oceanic boundaries.
Seasonally, and both the Colombian and the Panama basin, higher and lower salinities are observed in MAM and SON, respectively. During SON in the Caribbean and MAM in the Pacific, there is coherence with the net atmospheric flows. Thus, the maximum negative anomaly in the Caribbean occurs during the months with the maximum positive net atmospheric flow, and the maximum positive anomaly in the Pacific occurs during a quarter with low gains. On the other hand, during MAM in the Caribbean and SON in the Pacific, salinity seems to respond to the balance of the previous quarter.
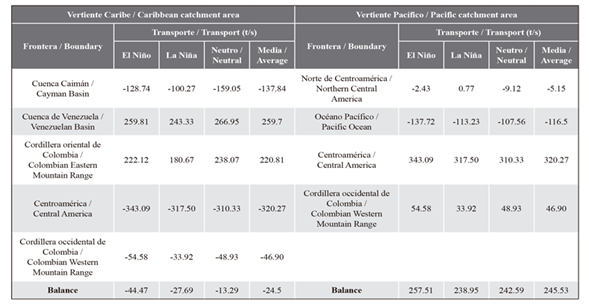
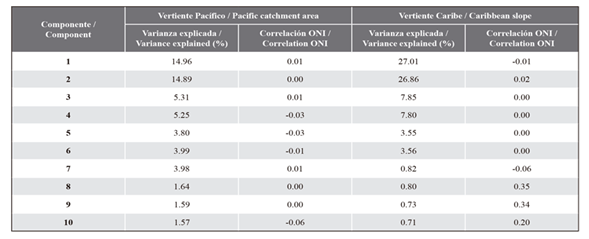
For their part, the moisture transport balances of the catchment areas for different ENSO conditions are presented in Table 4. The differences in the net atmospheric transports between the ENSO conditions are not very high in any of the two basins: 31 t/s for the Caribbean catchment area and 18.5 t/s for the Pacific catchment area. In fact, the correlation between the balances of the two catchment areas with the ONI is very low (0.35 for the Caribbean catchment area and 0.34 for the Pacific catchment area). An orthogonal empirical functions analysis regarding the time series with the balances of the catchment areas indicated that the variability modes that are better related to the ENSO explain very little of the variance, as shown in Table 5 for the first ten principal components of each catchment area.
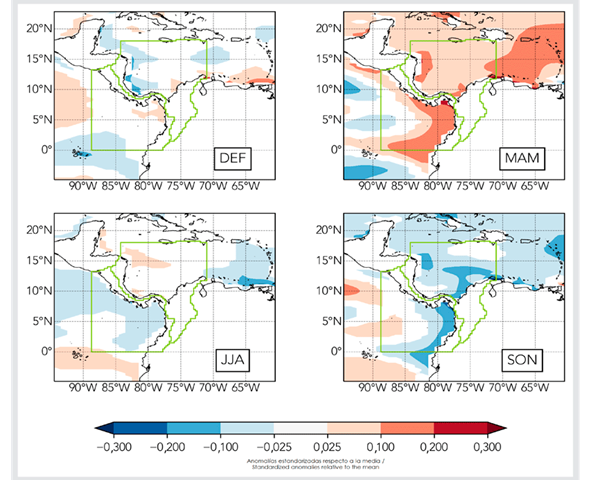
Figure 4 Seasonal salinity anomalies standardized with respect to the mean in the SW Caribbean and the Eastern Tropical Pacific
Table 5 Variance explained and correlation with the ONI for the first ten principal components of the time series for the balances in the Caribbean and Pacific catchment areas.
However, in the balances separated by ENSO conditions, the Caribbean catchment area loses more moisture under El Niño conditions and less under neutral conditions. The Pacific catchment area gains more moisture under El Niño conditions and less during La Niña. During La Niña, when the Chocó jet is more intense, the net moisture transport from the Caribbean catchment area to that of the Pacific through the Western Mountain Range decreases. The most negative value for the balance in the Caribbean catchment area under neutral conditions is due to a greater moisture transport from the Venezuelan basin and South America, as well as to a lower exit through Central America.
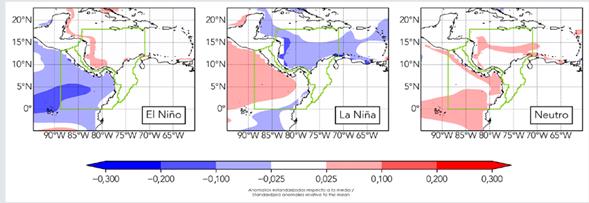
The atmospheric balances under ENSO conditions are coherent with the salinity anomalies in the Pacific, but not so in the Caribbean. In the Pacific, during El Niño, when the balance is more positive, the salinity anomaly is negative, and, during La Niña, when the balance is less positive, the salinity anomaly is positive. In the Caribbean, the negative salinity anomalies are very pronounced during La Niña, but the atmospheric balance is less negative under neutral conditions. Moreover, during El Niño, when the balance indicates a higher water deficit, the positive salinity anomalies are only evident on the Central American coast.
DISCUSSION
The low-level jets in the region funnel the moisture transport between the Caribbean, the Pacific, and Northern South America. The importance of the CLLJ and the ChJ as transporters of moisture towards Central America and Northern South America, as well as their influence on precipitation, has been recognized by several authors (Poveda et al., 2006, 2014; Sakamoto et al., 2012; Durán-Quesada et al., 2017; Hoyos et al., 2018). For their part, the Papagayo and Panama jets are related to the variations in the trade winds of the Caribbean that are funneled towards the Pacific (Chelton et al., 2000a, 2000b). The results obtained in this study regarding the moisture transport balances showed that the cores of the jets are places with a high concentration in the moisture transport at the boundaries, but the maximum moisture advection may be offset from the maximum wind speed core (as in the Caribbean and Papagayo jets, Figure 2). The calculated moisture transport is a function of two variables: wind speed and specific moisture (Cuartas and Poveda, 2002). Even though the wind speed is always maximal in the jets, there may be zones with higher moisture outside the core. This would explain why the wind speed and moisture advection cores are sometimes offset. Similar results have been found in other jets (Eiras-Barca et al., 2017; Algarra et al., 2019).
The absolute values for moisture transport in the jets were higher than those of the whole boundary. The moisture transports at the cores of the jets with respect to the total boundaries are presented in Table 6. In all cases, there are sectors of the boundaries where the moisture transport goes in the opposite direction to the dominant jets, especially in the higher regions of the atmosphere. This is especially pronounced in the ChJ, where, above 700 HPa, the wind speeds are opposite to the jet, with similar magnitudes, in the form of a jet at a higher level. This explains why, despite the fact that the direction of the subject indicates moisture transport towards the continent, the net value of the calculated boundary heads towards the ocean.
Table 6 Moisture transport values at the cores of the jets in comparison with the boundaries in which they are (the negative value for the ChJ indicates an opposite direction to the mean value of the boundary).

According to Table 6.91 % of the moisture transported by the CLLJ is taken towards the Pacific by means of the Central American jets (Papagayo and Panama). Furthermore, the Chocó jet takes one third of the CLLJ’s moisture towards the Caribbean catchment area. It has been recognized that the CLLJ is not only a moisture-bearing structure, but also a mechanism capable of increasing evaporation and the moisture gradient (Amador, 2008; Durán-Quesada et al., 2017), and that the Papagayo and Panama jets funnel the moisture transport from the Caribbean (Chelton et al., 2000a, 2000b; Amador et al., 2006). The ChJ, in turn, is controlled by pressure gradients and the Coriolis force (Amador et al., 2006), and it receives moisture from the Northern and Southern Tropical Pacific, as well as from the eastern flank of the tropical Andes and the Amazon basin (Hoyos et al., 2018).
The resulting balances depend on the altitude of the boundaries in order to calculate the moisture advection. In this case, the selected altitude (between 300 and 1000 hPa) contains all the low-level jets occurring in the area. Even though the cores of the Caribbean, Panama, and Chocó jets are at 950 hPa, they exert an influence down to 800 hPa. The Papagayo jet has a core at 800 hPa, with an influence reaching 400 hPa (Figure 2). Another important characteristic of the selected altitude is that it comprises most of the troposphere, which is the layer where all meteorological and climatic processes take place, hence including the entirety of the water transport in the atmosphere. Thus, even though the ChJ transports moisture below 800 hPa towards the interior of Colombia, the Pacific catchment area’s net effect down to 300 hPa on the whole boundary west of Colombia shows that it dominates the transport from the Caribbean catchment area. That is to say that the moisture transport in the upper troposphere from this boundary towards the ocean is higher than the transport towards the continent below 800 hPa (Figure 2d).
Several studies have compared the seasonality of the Caribbean and Chocó Jets, indicating that, when one is reinforced, the other one weakens (Cook and Vizy, 2010; Morales et al., 2017; Hoyos et al., 2018). Although the moisture transported by the ChJ is relatively low when compared to that of the CLLJ, its seasonality is a key forcing of the annual precipitation cycle in Central America (Durán-Quesada et al., 2017) and Northern South America (Poveda and Mesa, 1999). The annual variation in the net moisture balance shows that the Caribbean catchment area loses (gains) more moisture in DEF (SON), whereas, in the Pacific catchment area, the maximum and minimum moisture gains occur in JJA and SON, respectively. Thus, it does not happen that, when the Caribbean loses more moisture, the Pacific gains more, and vice versa. In DEF, the higher exit of water from the Caribbean catchment area heads towards the Pacific catchment area, but the latter exports more moisture towards the open Pacific Ocean. In JJA, the Pacific catchment area gains more moisture than in other quarters, while the Caribbean catchment area also gains moisture. During this time, the Caribbean catchment area receives important water contributions from the Venezuelan basin and South America. In SON, when the ITCZ is in its northernmost position, the ChJ is maximal and the CLLJ minimal (Morales et al., 2021), the Caribbean catchment area gains more moisture, and the Pacific catchment area gains less. This is explained by the fact that there is a lower moisture transport from the Caribbean to the Pacific, and the Pacific is transporting more moisture towards the continent at the level of the ChJ.
The works on moisture transport in the region have considered altitudes close to the cores of the jets, which is why the weather conditions exhibited by them are not fully comparable to the results presented herein. For example, Cook and Vizy (2010) state that, between May and September, the moisture of the Caribbean is taken towards Central America and the Pacific, while, between October and April, it is transported towards the north (Caimán B.). In the balances presented herein, the Caribbean catchment area’s highest moisture transport towards Central America and the Pacific takes place in DEF, and that towards the Caimán basin occurs in JJA. On the other hand, Hoyos et al. (2018) indicate that, in JJA, the Andean region shows moisture divergence, as well as convergence in SON, due to the higher and lower moisture gains from the Pacific Ocean in the lower atmosphere, which coincides with the results for the Western Mountain Range, showing a higher moisture passing through this boundary towards the Pacific in JJA when compared to SON.
As for the calculated balances, the net result for the Caribbean catchment area is negative, whereas that of the Pacific catchment area is positive. This indicates that, under average conditions, the Colombian basin increases the sea surface salinity, which decreases in the Panama basin in the Pacific. Salinity is a good indicator of the precipitation and evaporation conditions of an oceanic basin (Delcroix and Hénin, 1999). Indeed, the average salinity conditions in these basins (Figure 3) are higher for the Caribbean than for the Pacific. In the annual cycle, while the Caribbean catchment area’s net moisture transport balance is negative during the first part of the year and positive during the second one, in the Pacific catchment area, the net balance is always positive. In terms of the sea surface salinity, these results would indicate that the Colombian basin alternates between freshwater gains (losses) during the first (second) part of the year, while the Pacific catchment area gains freshwater throughout the year. The results found in this work regarding the seasonal salinity anomalies are comparable to those presented by Beier et al., (2017) for the Caribbean and by Fiedler and Talley (2008) and Alory et al., (2012) for the Pacific. However, it is clear that the seasonal salinity of these two basins does not always follow the atmospheric moisture transport balances. This is due to the fact that the basins are not closed and the surface salinity is influenced by the atmosphere, as well as by the advection of water during circulation.
For the case of the Caribbean, the lowest salinity anomalies occur in SON, when the atmospheric balance reaches its maximum positive balance, showing coherence with the atmosphere. However, the highest salinity anomalies take place in MAM, while the most negative atmospheric moisture transport balance occurs in DEF. In the salinity anomalies map for MAM, it is observed that the highest anomaly stems from the eastern Caribbean. Thus, what likely appears in the results is the effect of higher-salinity water brought in the Caribbean current. According to Yoo and Carton (1990) and Hu et al. (2004), the water mass influenced by the Amazon and the Orinoco Rivers which penetrates the Caribbean basin reports less freshwater contributions between November and April.
In the case of the Pacific, the most positive salinity anomalies occur in MAM, when the atmospheric balance shows values close to the positive minimum. However, it is in SON, precisely when the positive minimum occurs, that the most negative salinity anomalies take place. Both in MAM and SON, the strongest salinity anomalies occur near the coast. Nevertheless, in JJA, when the atmospheric moisture gains are higher, a negative salinity anomaly is observed in the whole basin, which indicates a coherent response by the ocean to the atmosphere. The strong negative salinity anomalies that occur near the coast in SON must be a product of the strong local rains in the western flank of the Western Mountain Range, with a more intense ChJ.
The hydrometeorological variables involved in the balances are highly correlated with the ENSO. The intensification of the CLLJ during El Niño events has been widely recognized (e.g., Amador et al., 2006; Hoyos et al., 2019; Morales et al., 2020). According to Durán-Quesada et al. (2017), the intensification of the CLLJ under El Niño conditions increases the moisture transport and contributes to an increment in atmospheric instability. Additionally, under La Niña conditions, the moisture transport in the ChJ increases (e.g., Amador et al., 2006; Sakamoto et al., 2011; Morales et al., 2020). Given this relationship, this work was based on the hypothesis that the atmospheric balances in the two catchment areas are also highly correlated with the ENSO. However, the results showed the opposite. In both catchment areas, the balances and their principal components showed a low correlation with the ONI. This could be first explained by the effect of spatial-temporal aggregation, where different, localized manifestations may counter each other during the analyzed period of time. Nevertheless, the physical explanation warrants a more detailed study.
Salinity in the Caribbean under El Niño conditions shows positive salinity anomalies near the Central American coast. Under La Niña conditions, there are very strong negative anomalies across the basin. In the Pacific, there are positive salinity anomalies under El Niño conditions and negative anomalies during La Niña, when positive anomalies occur far from the coast while negative anomalies are observed close to it. Despite the fact that the atmospheric balances were not found to be correlated with ENSO, clear responses are observed on the part of salinity, especially in the Pacific. This would indicate that the role of salinity advection through the currents is very important.
Thus, the fact that a positive salinity anomaly occurs far from the coast in the Pacific during La Niña may be explained by saltier waters in the Central pacific, due to evaporation and upwellings. The negative anomalies near the coast under the same conditions would be explained by the retention of moisture in the ChJ by the Western Mountain Range and the high precipitation in its western flank towards the coast. In turn, the negative salinity anomaly during El Niño in the Pacific basin would stem from less salty water in the Central Pacific. In the case of the Caribbean, the negative salinity anomalies during La Niña may be increased by freshwater flows from the Orinoco and the Amazon Rivers.
Hoyos et al. (2019) state that the ENSO has asymmetrical effects on the hydroclimatology of Northern South America. That is to say that the effects of El Niño are not necessarily opposite to those of La Niña, and that this difference increases when considering the types of ENSO: Canonical and Modoki. In this regard, Serna et al. (2018) indicate that the impact during Modoki El Niño events is lower than that during Canonical El Niño events. This work did not calculate the balance differences between Canonical and Modoki El Niño events and their relation to salinity anomalies, since, in the period analyzed, there were not enough cases for a representative sample. A future work in this regard would be the estimation of the moisture flows between the three regions, considering the different types of ENSO events.
CONCLUSIONS
The results obtained in this study regarding the moisture transport balances confirm that the cores of the jets are places with high moisture transports at the boundaries. Nevertheless, the maximum moisture advection may be offset from the maximum wind speed core, as in the Caribbean and Papagayo jets, as a result of variations in the concentration of moisture in the atmosphere.
The transport of moisture within the cores of the jets does not represent a fraction of the moisture transport over the vertical wall in the entire atmosphere. Moreover, the net transport over it may occur opposite to the jet, as is the case of the ChJ. This is due to the fact that there is a moisture transport opposite to the jets in high regions of the atmosphere.
The analysis performed on the moisture transport at the cores of the jet currents shows that most of the moisture transported by the CLLJ is taken towards the Pacific via the Central American jets (Papagayo and Panama), and that the ChJ takes a third of the CLLJ’s moisture towards the Caribbean catchment area. The passage of moisture from the Caribbean catchment area to the Pacific is not limited to the Central American low-level jets, as there is a significant transport through the Colombian Western Mountain Range boundary in the high atmosphere.
The altitude selected in this case (between 300 and 1000 hPa) contains all the low-level jets that occur in the area. Nevertheless, each current exerts an influence on the moisture transport at different altitudes: the Caribbean, Panama, and Chocó jets have cores at 950 hPa and their influence reaches 800 hPa, while the Papagayo jet’s core is at 800 hPa, with an influence reaching 400 hPa.
The annual variation in the net moisture balance shows that the Caribbean catchment area loses (gains) more moisture in DEF (SON). Meanwhile, in the Pacific catchment area, the maximum and minimum moisture gains occur in JJA and SON, respectively. It does not happen that, when the Caribbean loses more moisture, the Pacific gains more, and vice versa, given the interactions with other boundaries. These results are sensitive to the selected altitude of the boundaries delimiting the region. Hence, they are not comparable to the results of other authors who have only worked with the lower atmosphere.
In the calculated balances, the net result for the Caribbean catchment area is negative, whereas that of the Pacific catchment area is positive. This indicates that, under average conditions, the Colombian basin increases the sea surface salinity, which decreases in the Panama basin in the Pacific. This is reflected in the mean salinity conditions of both oceanic basins in the analyzed region.
The seasonal salinity of the Colombian (Caribbean) and Panama (Pacific) basins does not always directly respond to the seasonal atmospheric moisture transport balances. In the Caribbean, during SON, the lower surface salinities agree with the more positive atmospheric balances. However, during MAM, the higher surface salinities do not agree with the more negative balances. In the Pacific, the maximum salinities in MAM coincide with the lowest positive balance value, but the minimum salinities in SON do not coincide the highest positive balance value. In the case of the Caribbean, the response in MAM is explained by the advection of saltier waters from the Atlantic. The case of the Pacific during SON is due to the rains in the western flank of the Western Mountain Range.
Even though it has been recognized that the hydroclimatological variables of the region are highly related to the ENSO, the moisture transport balances in the two catchment areas and their two principal components showed low correlations with the ONI. This could be explained by a spatial-temporal aggregation effect, but it requires a more detailed study. Thus, the relationship between salinity in the two Colombian oceanic basins and the ENSO seems to be better explained by the advection of surface waters than by atmospheric balances.


 text in


