


 English (pdf)
 Article in xml format
 Article references
 Send this article by e-mail
 Cited by SciELO
  Cited by Google
  Similars in
SciELO
Similars in
SciELO  Similars in Google
 Permalink
1. Introducción
The acid whey results from the coagulation of acid milk 1,2. In Latin-American countries like Colombia, it is obtained mainly during the elaboration of stretched-curd cheese. According to the United States Department of Agriculture (USDA) 3,4, the worldwide production of cheese in 2020 and 2021 was approximately 21.203 million tons and 22.071 million tons, respectively, and the cheese world production is estimated to be around 22.159 million tons in 2022. The production of 1kg of cheese generates 9 kg of whey, showing the cheese elaboration yield is very low (up to 10%), with a worldwide whey production of approximately 400 million tons 5. This quantity of whey is not completely valued, being used largely for the fattening of animals 6, and it is even poured into soils and water currents without any treatment 2,7,8. This causes, on one hand, environmental problems due to the presence of high content of organic matter 9,10, and on the other hand, losses of raw material, because most solid contents presented in milk remain in whey (about 55%) 11, which is discarded during cheese production.
The present research is focused on the acid whey because of its large production in Latin-American countries such as Colombia. The acidic character turns the whey into a more pollutant agent, thereby, the treatment of this by-product would have a large positive impact on the environment, considering its acidity limits the proliferation of microorganisms, favoring its conservation 12; the information that exists in the state of art research for this type of whey is limited.
Micro- and Ultrafiltration membranes, MF and UF, were used to obtain permeates with a low protein content but containing salts, lactose, and components of low molecular weight 13-15. The interest of this research was the analysis of the filtration process focusing on the permeate due to the large volumes capacity with respect to the retentate 16, reducing, even more, the environmental impact. Among the studies published related with whey filtration using ceramic membranes, some of them reported using either MF and UF or both, under temperature conditions between 20-50°C and transmembrane pressures (ΔTMP) of 1-3 bar, obtaining permeate flux between 30-120 L/m2.h with protein retention percentages of 14 - 98% (2,8,17-19). It is necessary to mention that many of these studies were for sweet whey and the approach was mainly focused on protein concentration (membrane retentate). However, the characteristics of permeates were not analyzed completely and the process productivity because of the operation mode was not studied. Therefore, this research focused on the evaluation of the effect of temperature and membrane cut-off in the clarification of acid whey using UF and MF ceramic membranes. In addition, the effect of scaled-up and the operation mode on the clarification process were studied.
2. Methodology
2.1 Materials and inputs
The acid whey was obtained by the production of stretched-curd cheese. This whey was deproteinized (heated up to 100°C for 15 min), skimmed and pre-filtered with canvas, the native pH was between pH 4.5 - 5. The filtrations were completed using tubular mono-channel ceramic membranes TAMI® (Nyons, France), cut-off 0.2 µm, 300 kDa, 150 kDa, and 50 kDa; 0.14 m (0.00307 m2) and 1 m length (6 membranes, 0.132 m2). Kjeldahl tablets Merck®, H2SO4 98% w/w, and HNO3 65% w/w J.T. Baker, NaOCl 5.25% w/v, and NaOH flakes for washing membranes.
2.2 Filtration procedure
Micro and ultrafiltration experiments were carried out in a laboratory filtration pilot reported by Díaz-Arenas et al. 20. These filtrations were developed in two phases, the first phase was performed with membranes of cut-off 0.2 µm, 0.14 m length and Vfeed of 5 L. The effect of temperature and cut-off was evaluated in this phase. Temperature was studied at 50°C and 70°C, ΔPTM 2 bar and 120 min of filtration, conditions that were already reported by other authors 17,21; except for 70°C which was defined considering that this temperature had not been evaluated in the literature and it is close to pasteurization temperature. On the second phase, membrane cut-off, 50, 150 and 300 kDa, were evaluated with the previous phase conditions and the temperature that reported the best results. The retentate and permeate were recirculated in all filtrations (total recirculation).
Two different approaches were evaluated separately. The first one was the fouling and productivity as a function of temperature (using a membrane cut-off of 0.2 µm), and the second one was the retention capacity using different membranes cut-off (300, 150, and 50 kDa) at the same temperature tests. Statistical analysis was carried out to identify significant differences through ANOVA and Tukey test using the Minitab Statistical Software trial version.
The temperature and membrane cut-off conditions that gave the best results with respect to permeability and yield were selected to scale-up the process in the next stage. In this part of the study, ceramic membranes of 1 m length, filtration area 0.13195 m2 (6 membranes) were used. Experiments were carried out considering three operations modes: total recirculation, batch, and fed-batch. The first one was about filtrations with 10 L of whey-fed, at total recirculation to keep concentration constant, during 120 min; with the aim to filter higher volumes and evaluate the process scaled-up. For the second one, whey was filtered at volume and concentration variables (batch); in this case, the aim was to study the permeability and the characteristics of permeate variation as a function of the solids concentration in the retentate. The fed volume was 28 L without permeate recirculation until achieving a volume reduction factor (VRF) of 5 13,17,19. Finally, the filtration in fed-batch mode was carried out to assess the influence of solids concentration on the membrane permeability. To achieve this, the permeate obtained by filtration was not recirculated and new whey was fed to the process, keeping constant the volume (10 L), filtering approximately 50 L. Each filtration was performed in duplicate.
2.3 Quantification methods
The retentates and permeates obtained during filtrations were characterized by: % dry matter (A.O.A.C 990.19); % proteins (A.O.A.C 991.20), % ashes (A.O.A.C 923.03), % fat (A.O.A.C 2000.18), % Ca (A.O.A.C 927.02), % P (A.O.A.C 965.17), acidity (A.O.A.C 16.023), °Brix (portable refractometer Fisher No. 13 964 74C, 0-90%) and turbidity (turbidimeter HI 98703 Hanna®). The permeate flux was determined with the volume recovered at the time. The retention percentage was determined in the Ec. (1) with the ratio:
Where 𝐶0,i is the initial concentration of component i and 𝐶p,i is the concentration of component i in permeate
3. Results and discussion
3.1 Composition whey
Table 1 shows the initial composition of untreated whey which presents an acidic character (pH=4.86); similar to Souza et al. 8 and Lakstina et al.6, who reported values between pH 4.5 - 5.1.
Table 1 Initial characteristics of whey used in this research work. Data in % w/w and dry basis. *Average deviation
| Ph | °Brix | Dry Matter | Ashes | Proteins | Fat | Lactose | Lactic Acid | Calcium | Phosphor | Turbidity [NTU] |
|---|---|---|---|---|---|---|---|---|---|---|
| 4.86 | 5.5 | 5.83±0.1 | 8.92±0.14 | 7.72±0.12 | <1.7 | 70.1±1.1 | 5.16±0.1 | 0.86±0.01 | 0.69±0.01 | 1710±30 |
Measurement uncertainty: pH ± 0.05; °Brix ± 1; Dry matter ± 0.01; Ashes ± 0.04; Proteins ± 0.04; Fat ± 0.58; Turbidity ± 10 NTU.
Source: own elaboration
The protein and ashes content showed in Table 1 are lower than Souza et al.8 and Lakstina et al.6, who reported 13.1 and 14.8% w/w of protein, respectively, and for ashes 8.8 and 13.0% w/w, respectively. For dry matter content, the value reported is similar to Lakstina et al.6 with 5.4% w/w but is lower than Souza et al.8 who reported 6.5% w/w. This difference might be due to several factors such as kind of milk, the type of cheese elaborated and the skimmed process.
In addition, this whey comes from a ricotta elaboration process which promotes the precipitation of remaining protein by heating (between 90 - 100°C) to reduce the solids content, which is composed of mostly proteins, and minerals associated with these 22. The initial whey was skimmed to remove fat and reduce the membrane fouling, which accounts for the low content of fat. However, Souza et al. 8 and Lakstina et al. 6 also showed a low-fat content at 7.4 and 1.85% w/w, respectively. According to Table 1, the potential of this sub-product in the food industry can be seen because of its components. Sport-drinks may possibly way to value acid whey because of the presence of components like sugar and mineral salts that are necessary to recover energy and electrolytes wasted during exercise 11,23. In addition, these kinds of drinks have an acidity similar to whey (pH of 3, approximately). However, this by-product has high turbidity values, therefore, a clarification step is necessary
3.2 Analysis of the effect of the temperature on the filtration with membranes
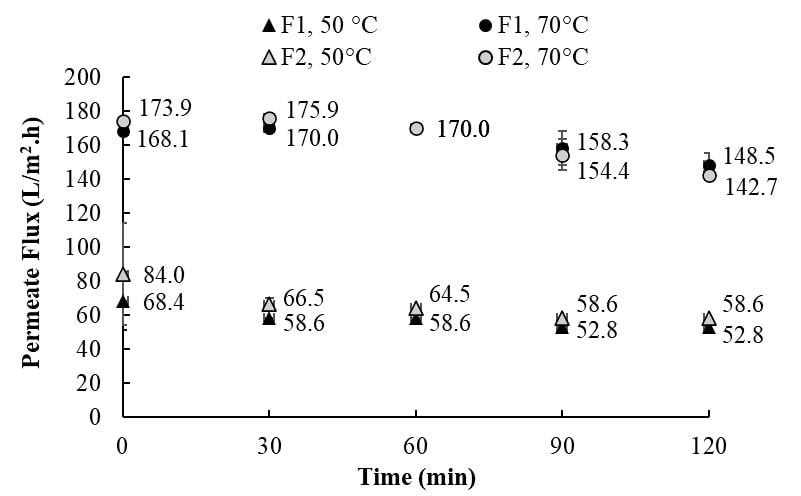
Figure 1 shows the permeate flux values obtained during the filtrations at 50°C and 70°C and ΔTMP of 2 bar. It shows that for both temperatures evaluated, the permeability decreases with time due to the fouling of the membrane (formation of deposits, adsorption, and pores blocking by proteins), because of work pressure and heat treatment 24-26. However, for both temperatures the permeate flux stabilized before 2 h of filtration (55.7±3.4 L/m2.h) at 50ºC and 70ºC (151.0±6.8 L/m2.h) similar to Acosta and Ríos 27 and Díaz-Arenas et al. 20 for the same filtration pilot and membranes (cut-off of 0.2µm), but with different feedstock (raw bovine blood and cassava starch hydrolysates, respectively).
Source: own elaboration
Figure 1 Acid whey permeability using 0.2 µm membranes cut-off at 50°C and 70°C, ΔPTM = 2 bar, Re= 82958 and Qfeed= 0.3 L/s. F1= Filtration 1, F2= Filtration 2. *Standard deviation.
That indicates that after some filtration time (90-120 min), a stabilization phenomenon is presented in the membrane 28. This behavior is confirmed statistically with no significant differences for each permeate flux from 90 min to 120 min (p>0.05).
For permeability at 70 °C, there are no values reported in the literature, however, it was larger than the reported at 50 ºC in more than 160%, and regard for Souza et al. 8 also at 50 °C in more than 40%. This indicates that at higher temperatures, the permeability increases 8,19. Making a statistical comparison between temperatures (Tukey test) confirms statistical differences between both flux. Likewise, the recovery of membrane water permeability, using the same protocol, was better for membranes used at 70°C (64%, water permeability recovered) than the membranes used at 50°C (38%).
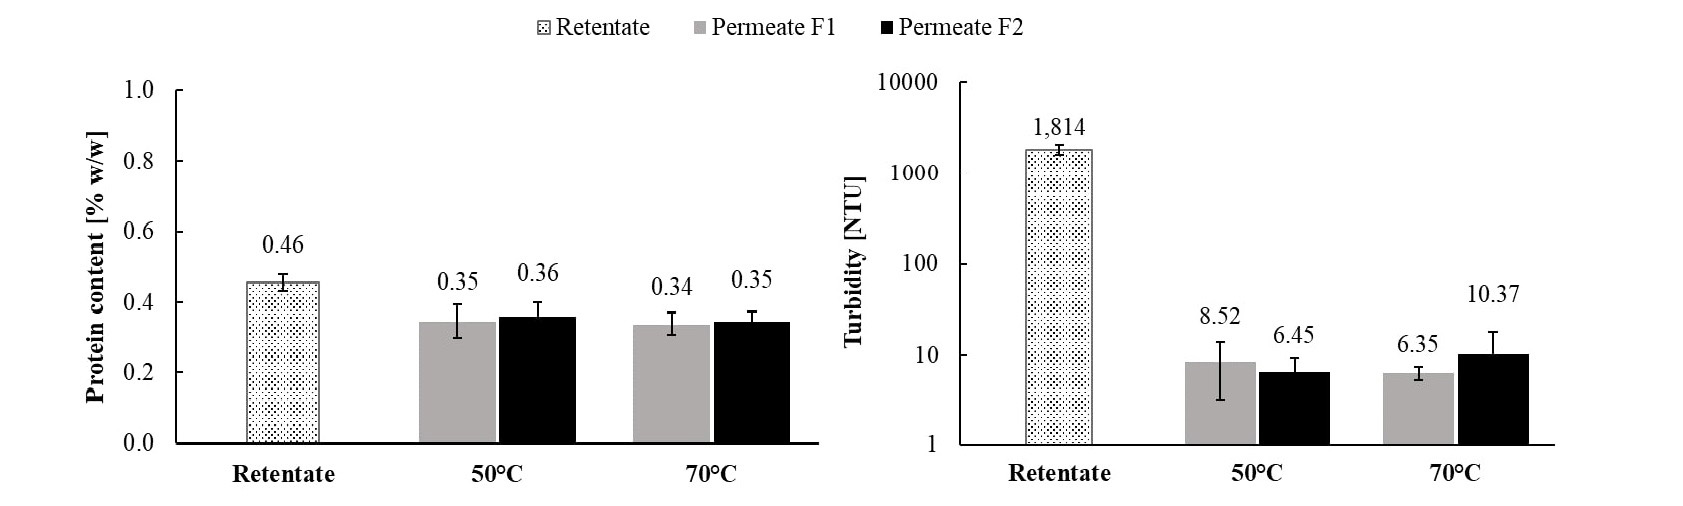
Figure 2 shows the average values obtained for protein and turbidity, during 2 h of filtration, with the respective standard deviation. Figure 2a shows the content of proteins in the retentates and the permeates for the filtrations at 50 and 70 °C, where the protein content decrease in permeates can be seen (significant decrease according to statistical analysis - Tukey test), achieving protein retention of 24 and 26%, respectively. Similar to this study, Camacho (2) reported retention of 25% for whey (pH between 5.55 and 5.9) using ceramic membranes cut-off of 0.2 µm, at 30 °C and ∆PTM of 2 bar. This decrease in protein content (permeate) corresponds to the retention of caseins still present in whey, and serum proteins that precipitate due to the effect of temperature 29.
Figure 2b, corresponding to turbidity, shows similar behavior for permeates and retentates in both temperatures. However, the data between retentates and permeates presents notable differences (according to statistical analysis - Tukey test), with turbidity reduction above 99%. This is associated with the retention of insoluble proteins (caseins and serum proteins denatured) as was mentioned previously. González and Molina 22 affirm in their research that for filtrations of semi-skimmed milk that caseins are responsible for high turbidity values. The °Brix reading for retentates and permeates did not show important differences between them, both values were between 5 and 6 °Brix (instrument deviation reading, 1 °Brix). For ashes content values (related to mineral salts) for both retentates and permeates were close.
Source: own elaboration
Figure 2 Content of a) Proteins and b) Turbidity for retentate and permeate with 0.2 µm membrane cut-off at 50°C and 70°C, Re= 82958 and Qfeed=0,30 L/s during 2 h of filtration. F1= Filtration 1, F2= Filtration 2. *Standard deviation. Means that do not share the same letter are significantly different.
The retentate was 0.53±0.02% w/w and the permeate 0.49±0.03% w/w, with a retention of 8%. Barukčić et al. 30 reported calcium salts retention of 7% for sweet whey (pH of 6.5), using membranes cut-off of 0.1, 0.5, and 0.8 μm, due to minerals associated with proteins 29. Even though protein and turbidity were very similar at both 50 and 70 ºC in permeates (no significant difference, Tukey test), permeability at 70 ºC was superior. Therefore, the temperature chosen to evaluate the influence of membrane cut-off in acid whey filtrations was 70°C.
3.3 Influence of membranes cut-off on permeate characteristics
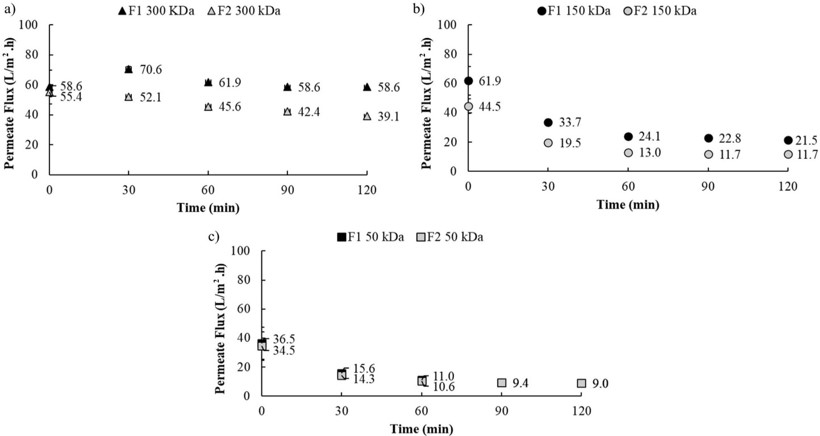
Figure 3 shows the permeate flux behavior at 70°C for molecular weight cut-off of (a) 300 kDa, b) 150 kDa, and c) 50 kDa. As well as in the previous section, permeability became stable before 2 h of filtration (there were no significant differences for each permeate flux from 90 min to 120 min, p>0.05). The average permeate flux values were 49.7±10.4 L/m².h for 300 kDa; 16.9±6.0 L/m².h for 150 kDa and 9.2±0.2 L/m².h, for 50 kDa), a similar trend to 0.2 µm membrane.
According to Figure 3, permeate flux decreased with filtration time and molecular weight cut-off. The reduction of permeability can be justified with the same reasons used for the membrane cut-off of 0.2 µm. However, the permeability losses in these membranes were larger than 0.2 µm cut-off, due to the closeness between the membrane’s cut-off and serum proteins’ molecular weight (β-Lactoglobulin, 18 kDa; α-Lactalbumin, 14 kDa; BSA, 69 kDa; Lactoferrin, 78 kDa and Immunoglobulin, 150-1000 kDa and Immunoglobulin, 150-1000 kDa 31).
Considering the statistical analysis for the average permeate flux for all membranes cut-off (Tukey test), where the means showed a significant difference between 0.2 µm regarding 300, 150, and 50 kDa, it is possible to affirm that the membrane with the best permeability was 0.2 µm (163.2±11.4 L/m².h), being superior to the average permeate flux of 300, 150, and 50 kDa, in 200, 500 and 900%, respectively (values at 70°C).
Some authors also reported permeate flux for 300, 150 and 50 kDa molecular weight cut-offs at 30°C and ΔPTM of 1-3 bar 2,18,31. Almécija et al. 31 reported a lower permeate flux for 300 kDa membrane cut-off (25 L/m².h) than this study (54.3±9.6 L/m².h).
Source: own elaboration
Figure 3 Permeability of acid whey using ceramic membranes for molecular weight cut-offs of a) 300 kDa, b) 150 kDa, c) 50 kDa, at 70°C, ΔPTM = 2 bar, Re = 78216 and Qfeed = 0.27 L/s, during 2 h of filtration. F1= Filtration 1, F2= Filtration 2. *Standard deviation.
Source: own elaboration
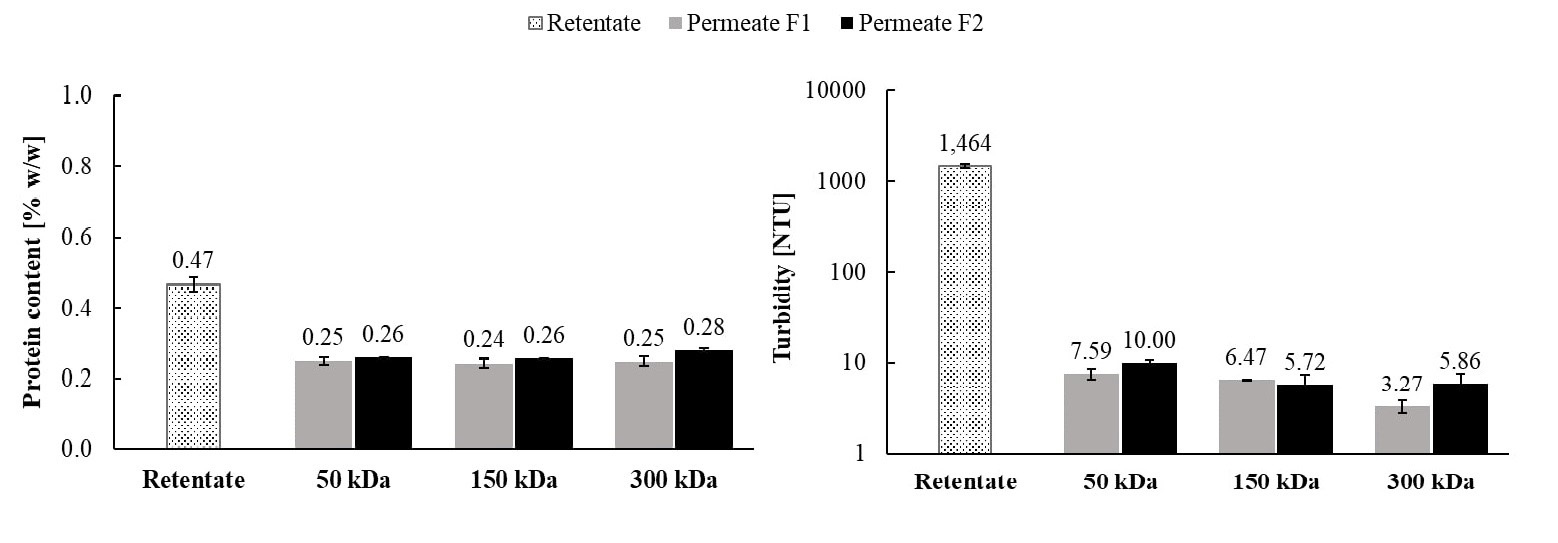
Figure 4 a) Protein content and b) Turbidity in retentate and permeate, obtained at 70°C, ΔPTM = 2 bar, Re = 78216 and Qfeed = 0.27 L/s, during 2 h of filtration. F1=Filtration 1, F2=Filtration 2. *Standard deviation. Means that do not share the same letter are significantly different.
This is because of the differences in the filtration temperature used. Muro-Urista et al. 18 and Camacho 2 obtained higher permeate flux for 150 and 50 kDa, (37.7 and 38.5 L/m2.h, respectively) than that obtained in this study (26.5±16.1 and 15.9±10.6 L/m².h for 150 and 50 kDa, respectively), as a result of the precipitation of proteins at high temperatures 29 which are deposited on the membrane surface causing the flux reduction.
Figure 4 presents protein and turbidity results obtained at 70°C for different membrane cut-off . For protein content (Figure 4a), all permeates presented similar characteristics (no significant difference according to Tukey test). Therefore, the retention percentage was similar in all membranes (300, 150 and 50 kDa), with values between 40-49% (protein values between retentate and permeate were statistically different, Tukey test); unlike the 0.2 µm membrane that presented protein retention between 24-26%. In these membranes, protein retention was almost double, due to the molecular weight cut-off of the membranes that can retain a portion of serum proteins, mainly the larger ones like immunoglobulins (146 - 163 kDa) 32.
Despite the increase in protein retention for membranes cut-off of 300, 150 and 50 kDa with respect to 0.2 µm, several proteins are still able to pass through it, possibly serum proteins like β-Lactoglobulin and α-Lactalbumin, which are smaller than the membrane cut-off. Almécija et al.31 report molecular weight for these two proteins to be 18 and 14 kDa, respectively. For protein retention, Steinhauer et al. 17 obtained retention values near to 60%, using ceramic membranes with a 0.1 µm cut-off (similar to those found for 300 kDa cut-off membranes) at 50°C, retention values that are higher than those obtained in this work. This may be for several reasons, the first one is related to differences in the physical characteristics of the membranes used. Additionally, the temperature (higher for this study), which affects the spatial structure of proteins, can facilitate the passage of proteins through the membrane 18,33. For ceramic membranes of 150 and 15 kDa, Muro-Urista et al. 18 obtained protein retentions of 55.98% and 63.06%, respectively (at 35°C and ΔPTM = 2 bar). As can be seen, this also occurred in this study where the retention for 150 and 50 kDa was similar.
According to Figure 4b, the turbidity reduction in permeates was above 99% in all cases (significant difference between permeate and retentate, Tukey test), as well as the 0.2 µm cut-off membrane. As mentioned previously, caseins and denatured proteins are responsible for high turbidity values.
In all filtrations, the retentate and permeate were between 5 and 6 °Brix. As mentioned above, this increase is not conclusive because of the instrument deviation. The ashes content for retentate was 0.56±0.02% w/w and 0.54±0.04% w/w for permeate, which shows that their passage through the membranes is not being affected, like with the 0.2 µm membrane.
According to these results, scaling-up the filtration process with a 0.2 µm membrane is the best option because the permeability was higher (more productivity) compared with 300, 150 and 50 kDa membranes. Although the retention of proteins for 0.2 µm was 50% lower, this is not relevant because this whey is low in proteins in addition to the turbidity reduction being above 99% for all membranes.
3.4 Evaluation of scaled-up filtration process and operation mode on membrane filtration characteristics
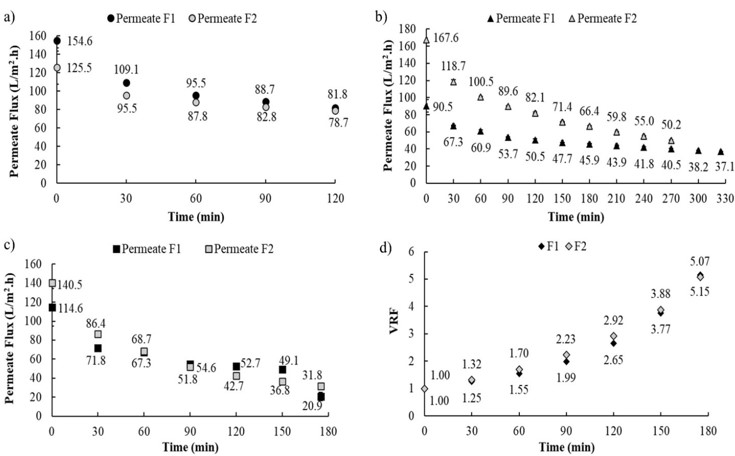
Figure 5 presents the permeate flux behavior for the scaled-up filtration system using 0.2 µm membranes cut-off. The operation modes evaluated were: Total recirculation (Figure 5a),
Source: Own elaboration
Figure 5 Permeability of acid whey for different operating modes a) Total recirculation, b) Fed-batch and c) Batch d) Volumen reduction factor (VRF) during Batch operation, using ceramic membrane of 1 m length and cut-off of 0.2 µm at 70°C, ΔPTM= 2 bar, Re= 25942 and Qfeed= 0.78 L/s. F1=Filtration 1, F2=Filtration 2.
Fed-Batch (Figure 5b), and Batch (Figure 5c,d). The characteristics of permeates and retentates obtained from each operation mode are shown in Table 2.
For Total recirculation (Figure 5a), the loss of permeate flux was 43% higher than that presented in section 3.2 for a minor scale (15%) at 70°C, and the same membrane cut-off. This is due to turbulence regime changes in the filtration system. The Reynolds for the scaled-up system was 3.2 times lower than the non-scaled-up (Re2=25942 and Re1=82958). A minor Reynolds number causes a reduction of the dragging forces, making more difficult the passage of whey components through the membranes. In other words, the membrane fouling increases and the retention of protein with it 22. That is the reason why the retention of protein for the scaled-up system was higher than the non-scaled-up (41 and 26%, respectively).
In Batch mode operation (Figure 5c) an average volume reduction factor (VRF) of 5 (Figure 5d) was achieved. The average permeate flux was 56.9±22.5L/m2.h, with a reduction in its value of 70% in 3 h. The reduction in the permeate flux is related to viscosity (increase) and solute accumulation (proteins) on the membrane surface. This increases the fouling resistance and the reduction of the permeate flux 13,19. Atra et al. 19 and Steinhauer et al. 17 obtained lower productivity (20-30 L/m2.h) for the same VRF, because of the smaller cut-off membrane and feed flow rate used (8-10 kDa; 0.05-0.11 L/s, respectively).
Despite the retention of protein achieved by Atra et al. 19 was considerable higher (93-100%), the protein content in retentate was between 8 and 10% w/w. In the present research work, a 68% protein retention was obtained, but a lower protein content too (1.09±0.32% w/w, Table 2). This shows the impact of the pretreatment applied in this study in the protein reduction content.
In Fed-Batch mode operation (Figure 5b), the permeabilities decreased 59-70%, and it was possible to filter 50 L of acid whey in approximately 5 h (67.2±31.3L/m².h). In Batch mode operation, it was possible to treat 28 L in 3h (56.9±22.5L/m2.h) with a permeability reduction of 70%. These results indicate that more acid whey could be filtered in Fed-Batch mode, because of the whey solution that is constantly fed to the process, avoiding a fast increase in solids concentration in the feed tank. Protein retention in Fed-Batch mode operation was 61%, close to Batch mode (statistically, there was no difference, p>0,05). In all cases, the membrane permeability was recovered using the washing membranes protocols established by the research group.
A linear adjustment of the data (from 90 min) was made for all operation modes and the slope value was determined (related to the loss of permeability per unit time - m2.L/h2). To compare the slope value between each operation mode, a Tukey test was carried out and it was found that the rate of change in the permeability of Total Recirculation and Fed-Batch mode (-0.182±0.032 and -0.144±0.053, respectively) did not present significant differences between them, but they were different to the Batch mode (-0.396±0.058). It confirms that exists a significant permeability loss in the Batch mode, and the Fed-Batch mode was more productive due to the slow increase of solids concentration in the retentate, avoiding membranes fouling quickly, as mentioned above.
Table 2 shows the characteristics of permeates and retentates obtained from each operation mode. The protein content in permeates remained stable during the experiments for the three operating modes evaluated (there were no statistical differences between initial and final permeate values, p>0.05). Similar results were obtained for °Brix and the ashes content, indicating that the related compounds were not retained on the membranes.
Regarding the retentate, protein content, dry matter, and turbidity increased with respect to permeate due to protein retention, as was mentioned previously; however, the final protein content in retentate was different between operation modes. In Total Recirculation mode, there was no concentration in retentate, thus, the protein content did not change. But in Batch and Fed-Batch mode occurred a concentration process, which explains why the final protein content increased in the retentate.
Concerning turbidity, the reduction was above 99% for Total recirculation, 88-99% for Batch and 97-99% for Fed-Batch mode operation. The differences in values for Batch and Fed-Batch were due to the large quantities of whey fed, that forced to feed different whey batches during the experiments. However, permeate characteristics were not affected by the turbidity variation in the whey fed (there were no statistical differences in permeates, p>0.05).
Table 2 Retentate and permeate composition for different operation modes: Total recirculation, Batch and Feed-batch, using ceramic membrane of 1 m length and cut-off of 0.2 µm at 70°C, ΔPTM = 2 bar, Re = 25942 and Qfeed= 0.78 L/s. F1 and F2 corresponded to Filtration 1 and 2.
| Total Recirculation | Protein (%w/w) | Dry matter (%w/w) | °Brix | Ashes (%w/w) | Turbidity (NTU) | ||||||
|---|---|---|---|---|---|---|---|---|---|---|---|
| F1 | F2 | F1 | F2 | F1 | F2 | F1 | F2 | F1 | F2 | ||
| Permeate | Initial | 0.24 | 0.23 | 5.21 | 5.02 | 5 | 5 | 0.43 | 0.44 | 3.43 | 3.26 |
| Final | 0.27 | 0.26 | 5.44 | 5.26 | 5 | 5 | 0.51 | 0.54 | 6.05 | 4.88 | |
| Retentate | Initial | 0.43 | 0.40 | 5.49 | 5.28 | 5 | 5 | 0.47 | 0.51 | 1,515 | 1,500 |
| Final | 0.44 | 0.44 | 5.99 | 5.79 | 6 | 6 | 0.51 | 0.54 | 1,855 | 2,015 | |
| Batch | Protein (%w/w) | Dry matter (%w/w) | °Brix | Ashes (%w/w) | Turbidity (NTU) | ||||||
| F1 | F2 | F1 | F2 | F1 | F2 | F1 | F2 | F1 | F2 | ||
| Permeate | Initial | 0.30 | 0.29 | 5.26 | 5.27 | 5 | 5 | 0.49 | 0.54 | 7.7 | 5.84 |
| Final | 0.34 | 0.37 | 6.29 | 6.02 | 6 | 6 | 0.50 | 0.53 | 11.3 | 6.46 | |
| Retentate | Initial | 0.41 | 0.41 | 5.82 | 5.5 | 6 | 5 | 0.57 | 0.47 | 66 | 1,150 |
| Final | 1.05 | 1.12 | 7.28 | 7.09 | 7 | 7 | 0.60 | 0.55 | 560 | 12,550 | |
| Fed-Batch | Protein (%w/w) | Dry matter (%w/w) | °Brix | Ashes (%w/w) | Turbidity (NTU) | ||||||
| F1 | F2 | F1 | F2 | F1 | F2 | F1 | F2 | F1 | F2 | ||
| Permeate | Initial | 0.36 | 0.31 | 5.38 | 5.62 | 5 | 5 | 0.52 | 0.55 | 2.8 | 4.3 |
| Final | 0.37 | 0.39 | 5.98 | 5.88 | 6 | 5 | 0.58 | 0.54 | 8.2 | 5.5 | |
| Retentate | Initial | 0.46 | 0.42 | 5.77 | 5.73 | 5 | 5 | 0.57 | 0.58 | 107 | 598 |
| Final | 0.97 | 0.98 | 6.96 | 6.76 | 6 | 7 | 0.64 | 0.58 | 1,480 | 10,025 | |
Source: own elaboration
4. Conclusions
This research work evaluates the effect of temperature, membrane cut-off, and operation mode in the clarification process of acid whey using UF and MF ceramic membranes. Three operations modes were studied: total recirculation, batch, and fed-batch. Based on the obtained results about acid whey, it was found that the permeability at 70 °C was higher at 50°C, approximately 3 times for the same membrane cut-off (0.2 µm), without affecting the recovery of water permeability for the membranes used in the filtration. The permeability presented a stable behavior during the filtration at the studied temperatures. It is necessary to emphasize that the literature does not report studies about acid-whey membrane filtration at 70°C. Protein retention using membranes with 0.2 µm membrane cut-off was lower (the half), compared to the other membranes cut-off studied. However, the turbidity reduction was above 99% and achieved higher productivity by more than 40%.
The Fed-Batch operation mode presented a better performance allowing the processing of higher volumes of acid whey. This is due to less fouling of the membranes in comparison to the Batch operation mode. It shows that the Fed-Batch mode is an alternative for acid whey filtration. It should be noted that permeates also showed low turbidity values during the whole study (<12 NTU), despite the fluctuating turbidity values in the feed, which in some cases were higher than 12,000 NTU. The permeate characteristics obtained in terms of turbidity, lactose, and salt content would allow use in products such as sports drinks, bakery products, and acid lactic production, extending the possibilities for exploiting this by-product.

