Introduction
Biomass is one of the most promising options to substitute fossil fuels and reduce greenhouse gas emissions. It has the advantages of CO2 neutrality, worldwide availability and the possibility of production on demand of power and heat 1. Combustion is the most popular technology for biomass conversion to energy 2; however, the emission of harmful gases from biomass combustion furnaces is still a significant problem that requires further research 1. Computational Fluid Dynamics (CFD) modeling is a cost-effective tool to study and optimize the process; which is not a trivial task since successful modeling of solid combustion furnaces requires appropriate sub-models to simulate the relevant combustion, flow and transfer processes, and their interactions, whose complexity affects the accuracy of the results and computational time 3. Due to that, it is a topic that is still under investigation; a full review is given in the papers of Karim and Naser 4, Dernbecher et al. 5, Bhuiyan et al. 6, Khodaei et al. 7 and García et al. 8,9. Moving grate furnaces have been the most studied systems because they are widely used in industry 8; however, fixed bed systems of low power have gained popularity in recent years due to their low operating cost, simplicity and low requirements in terms of fuel preparation and transportation 7,10,11. Traditional panela furnace is a kind of fixed-bed device of great relevance for Colombia, which is the second producer of panela (jaggery) in the world after India . Most of the panela production activities continue to be carried out in small-scale units with low efficiency and low quality standards 12-19, which has meant that in many cases the product is not suitable for export and is destined almost entirely for domestic consumption 16,20. Few studies have been published on CFD modeling of traditional panela furnaces, some examples are the works of Mendieta and Sanchez 21, Guevara 22 and Quispe 23, who simulated the sugarcane bagasse combustion in Ward-Cimpa chambers by 1D, 2D and 3D models.
OpenFOAM (Open Field Operation and Manipulation) is a powerful engineering tool developed at Zagreb University that is often used in industrial applications 24. It has significant advantages such as being a free open-source constantly under development with a continuous growing community and including solvers for several applications 25. However, there are relatively few OpenFOAM-based models reported in the literature to study the combustion of solid biomass. Most of the studies of this subject are performed using the software ANSYS®8,9. In order to contribute to the study of the combustion in panela furnaces, in the current work, a comprehensive two-dimensional numerical model was developed in OpenFOAM. An eulerian-lagrangian approach was used to simulate the gas and solid particles behavior in a Ward-Cimpa chamber fueled with sugarcane bagasse. The model includes the sub-models: Partially Stirred Reactor (PaSR), k-epsilon and P1 for gas combustion, turbulence and radiation, respectively. The calculated values of CO and temperature at the chamber's exit were compared data taken from literature, showing good agreement between them. The model was used to test the influence of the air-flow rate in the temperature and the emissions of CO, CO2 and CH4 at the exit of the chamber.
Methodology
Computational domain
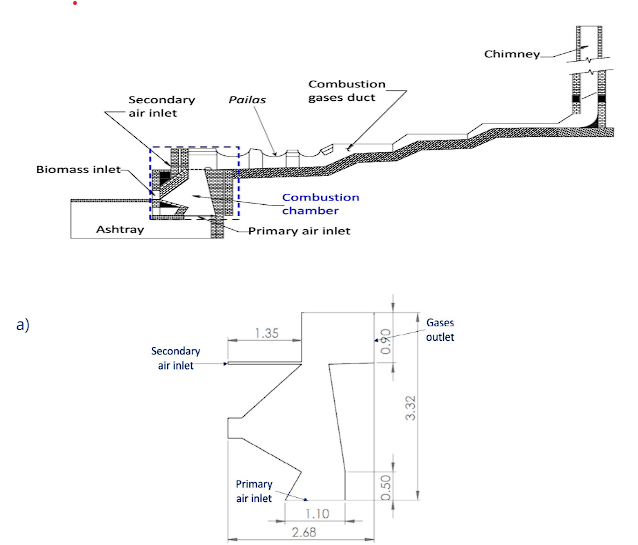
The computational domain is a 2D representation of the combustion chamber within a Ward-Cimpa furnace, as illustrated in Figure 1. In Figure 1a, the entire system 22, is depicted, wherein sugarcane bagasse undergoes combustion within the chamber. The resultant combustion gases flow towards the pailas, where the sugarcane juice is boiled to produce panela. Subsequently, the gases exit through the chimney. The specifically modeled portion of the system (the combustion chamber) is detailed in Figure 1b. The dimensions of this chamber were adopted from Guevara's research 22. The domain was discretized using a structural mesh generated through the tool blockMesh. A mesh convergence analysis was conducted by testing various mesh refinements to find a mesh whose results are independent of the size.
Fuel and operating conditions
The main properties of the fuel (sugarcane bagasse) were taken from the literature 22,26, they are presented in Table 1. Those values were obtained from experimental tests such as the elemental and proximate analyses.
Table 1 Fuel properties
| Property Type | Property | Value |
|---|---|---|
| Physical | Particle density | 317.5 kg/m3 |
| Apparent density | 127 kg/m3 | |
| Diameter | 4.01 mm | |
| Chemical | Chemical formula | CH2.0526O0.6658 |
| Moisture | 50% | |
| Volatile fraction | 41.25% | |
| Fixed carbon | 8.05% | |
| Ashes | 0.70% | |
| pyrolysis kinetics parameters | A = 5x10²² s-1 | |
| Ea = 2.67x10⁸ | ||
| J/kmol | ||
| f(α)) = (1-α) | ||
| Thermal | Specific heat | 2460 J/kg.K |
| Emissivity | 1 | |
| Pyrolysis Temperature | 500 K |
The furnace walls are made of firebrick, therefore, adiabatic conditions were assumed at the boundary walls. It is a batch reactor, the biomass fuel fills part of the furnace from the bottom to 1.1 m above, forming the fuel bed. The solid fuel reacts with the primary air from the bottom and the gases released mixture with the secondary air to complete combustion. Three mass flow rates were studied, which are presented in cases A, B and C of Table 2. Case B was used to validate the model by comparing predicted results with design data at these conditions. In cases A and C, the air flow is 30% less and 30% more that in the case B, respectively, with which the effect of the air in the process was analyzed.
Model description
The model uses an Eulerian-Lagrangian approach for modeling the gas (freeboard) and solid (fuel bed) phases. The governing equations are solved in the gas phase, for which its source terms are determined from the submodels of combustion (c), radiation and particles (p). The latter is decomposed according to the phenomenon that is represented, i.e., the stage of the process (evaporation - ev or pyrolysis - dv), the particle drag force (dr) and thermal convection (cv). Equations 1 to 8 presents the mentioned governing equations and the decomposition of its respective source terms.
Mass:
Energy:
Momentum:
Chemical Species:
The solver coalChemistryFoam of OpenFOAM was used to solve this system. Table 3 shows the submodels considered to determine the terms of equations 2, 4, 6 and 8. There
Table 3 Submodels used
| Terms | Submodel | Expressions of the submodels | References |
|---|---|---|---|
| 𝑆𝑑𝑣 𝑝,𝑚, 𝑆𝑑𝑣 𝑝,ℎ , 𝑆𝑑𝑣 𝑝,𝑢 and 𝑆𝑑𝑣 𝑝,𝑦 | One-component single reaction mechanism |
|
27 |
| 𝑆𝑒𝑣 𝑝,𝑚, 𝑆𝑒𝑣 𝑝,ℎ, 𝑆𝑒𝑣 𝑝,𝑢, and 𝑆𝑒𝑣 𝑝,𝑦 | Equilibrium approach | (10) (11) (12) | 28 |
| 𝑆𝑐𝑣 𝑝,ℎ | Ranz Marshall |
|
29,30 |
| 𝑆𝑐,ℎ and 𝑆𝑐,𝑦 | Partially Stirred Reactor model |
|
31 |
| 𝑆𝑟,ℎ | P-1 |
|
32 |
| 𝑆𝑑𝑟 𝑝,𝑢 | Drag Force |
|
32 |
Results
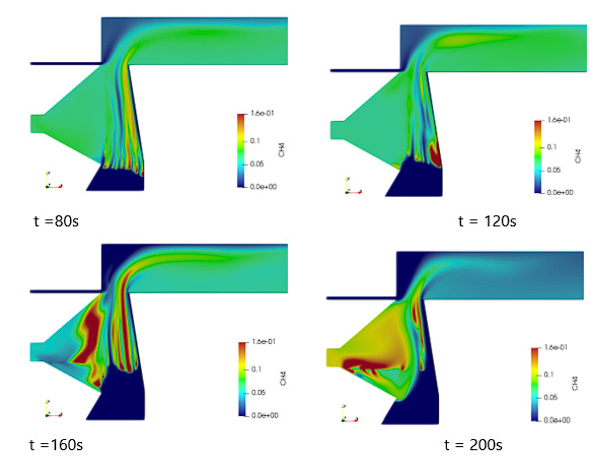
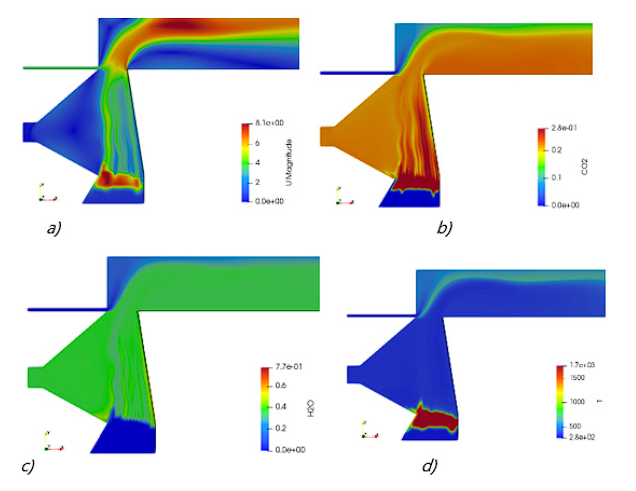
Firstly, case B was simulated; Figures 2 and 3 present results for that operating condition. Figure 2 shows the CH4 profile at four instants of the simulation and figure 3 presents the velocity, CO2, H2O and temperature profiles in the furnace at 100 seconds. Biomass contains a large amount of volatile matter, which is released at the pyrolysis stage, it usually comprises CO, CO2, H2, CH4 and tar 7. The zone of volatiles production (such as CH4 and CO2) is the zone where the pyrolysis stage is taking place and its movement indicates the progress of the ignition front, which can be seen in figure 2. The three combustion stages (drying, pyrolysis and char combustion) occur from the bottom to the top of the bed. At the bottom, the char combustion occurs by the primary air and above it pyrolysis and drying occur due to the heat received by conduction and radiation from below. The maximum solid temperature is encountered at the lower part of the bed where the moisture has been driven out and more oxygen is available for the char oxidation reaction. The maximum gas temperature is presented near the secondary air inlet, where secondary air reaches the volatiles and completes the combustion. These maximum temperature values are similar to the ones reported in the literature 22,23.
Table 4 shows the comparison between the average values of temperature and CO at the furnace outlet obtained in this study and presented in the work of Guevara 22. The outlet temperature and CO mass fraction, taken from the work of Guevara, are design values used to represent the real performance of those devices during its development. The relative error (RE) presented in the table is slightly lower than that reported in other studies about combustion modeling of similar panela furnaces 21,22, which indicates that the model is suitable for the analysis of the device. Many factors affect the solid combustion process; therefore, it is not easy to explain the difference between values in the table; the most significant factor may be the simple combustion model used for the fuel bed. The three stages of the process transfer mass from the particle to the gas phase and are dependent on the particle geometry and complex coal chemistry reactions that break down the solid structure to release gases 32. The present model does not take into account this level of detail; instead, spherical particles are assumed and the user specifies the fraction of mass lost by the particles at the beginning of the simulation. The assumption that fuel particles are spherical introduces a variation in the heat transfer area, affecting radiation and convection within the chamber. Additionally, the fractions of volatile gases included prior to simulation are derived from biomass proximate analysis, conducted under conditions that may differ from those within the combustion chamber. Besides, the thermally thin assumption for fuel particles neglect temperature gradients inside the particle, which affect the surface temperature, that means a less drastic variation of the bed temperature 33,34. However, the mentioned simplifications are justified by the reduction in the computational cost of the simulation. More accurate results could be obtained by employing a more detailed reaction mechanism for the three combustion stages and using a finer mesh that enables the consideration of internal gradients and the original shape of the particles. Nevertheless, incorporating these changes would significantly increase the complexity of the model and necessitate higher computational time.
Table 4 Comparison of literature and simulated data
| Parameter | Present Work | Literature | Difference | RE [%] |
|---|---|---|---|---|
| Temperature [K] | 1352.33 | 1205 | 147.33 | 12.23 |
| CO [%] | 2.99 | 2.63 | 0.36 | 13.72 |
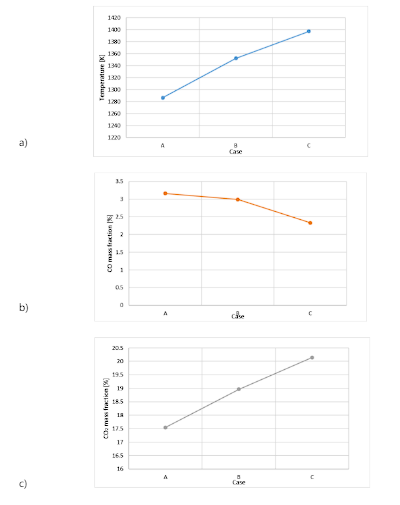
The temperature and emissions are two key performance indices of fixed bed combustion, the former is an index of the thermal conversion efficiency and the latter is an index of the pollution caused by the device. The combustion air is the main control parameter of biomass furnaces, if the air is less than the stoichiometric amount required, the combustion will be incomplete and only part of the fuel energy will be converted into thermal energy, and if there is too much excess air, there will be a chilling effect on the furnace that decreases combustion efficiency 27. Under low air-flow conditions, there is not enough oxygen to complete the homogeneous reactions and there is a large amount of unburned species. If the air-flow rate increases, fuel conversion increases linearly, followed by a stage of slow increase until it reaches a peak and starts decreasing significantly due to the intensification of the convective cooling effect 7. This trend is reflected in the emissions a temperature values.
Using the presented model, we calculated the temperature and the average CO and CO2 emissions at the furnace outlet for the air-flow rates described in table 2 (Cases A, B and C). Those results are presented in Figure 4. As can be seen, an increase in air-flow rate demonstrates an almost linear elevation in temperature and CO2 emissions, accompanied by a decrease in CO emissions. This is due to the oxygen content, CO is an intermediate product of combustion, more oxygen leads to a more complete process and therefore CO reacts to form CO2. It indicates that in common operational conditions the combustion is limited by oxygen, i.e, the furnace operates under deficient air conditions. According to the literature 7,35, if the airflow was to increase further, the cooling effect would become more significant, potentially causing a plateau and subsequent decline in CO2 emissions due to a less complete reaction. We suggest using higher air flow rates to improve combustion, further studies are required to identify the optimum operational point of the furnace.
Conclusions
A comprehensive two-dimensional CFD modeling of solid biomass combustion and associated emission in a Ward-Cimpa panela furnace has been performed. The model was implemented in the open-source software OpenFOAM, using an eulerian-lagrangian approach for the freeboard and the fuel bed. It was tested by comparing the predicted temperature and CO values at the furnace outlet with those obtained from the literature. The relative error percentages for the mentioned values were 12.23 % and 13.72 %, respectively; which are values slightly lower than those reported in other studies about the subject. These predictions could be improved by considering a more detailed model for the fuel bed, especially for the char combustion stage; however, it would increase the complexity and the computational cost.
The model was used to analyze the influence of the air-flow rate in the furnace performance. It was found that there is an increase in the combustion activity with the increase in air-flow rate, which can be seen by the increase in temperature and CO2 emissions, and the decrease of CO emissions. These results indicate that higher air-flow rates could improve the furnace's performance. Further studies are required to identify the optimal operating point of the analyzed furnace.
Nomenclature
h enthalpy
Kkinetic energy
S source term
Ɛrate of dissipation of turbulent kinetic energy
σ Stefan-Boltzmann constant
α conversion degree
aoverall absorption coefficient
Girradiation
τ residence time in the reactive structure
cspecies concentration
Apre-exponential factor
D eff effective mass diffusivity
α eff effective thermal diffusivity
RgReynolds stress term
U p particle velocity
m p particle mass
T p particle temperature
A p particle superficial area
h c convective heat transfer coefficient
h m convective mass transfer coefficient
T ∞ ambient temperatura
C m moisture concentration
E a activation energy
R u universal gases constant
E p emission contribution of particles
Nu Nusselt number
Re Reynolds number
Pr Prandlt number
fmreaction rate


