Introduction
Air pollution has a high environmental impact 1 and severe consequences for ecosystems 1 and human health 1. It can cause cerebrovascular diseases, respiratory infections, allergies, and lung cancer 1. Many diseases can cause premature death due to exposure to this pollution, even at low concentrations 1.
The sources of pollution that cause these problems are diverse. One of the main ones is the burning of fossil fuels that are used as a source of energy for the industrial, transportation, and construction sectors 1. All this has led to increased emissions, a major problem that demands society's attention 1. Globally, it has caused around 7 million deaths each year 2. In addition, according to the National Planning Department (DNP), the costs of deaths and diseases related to air quality amounted to 12.3 billion pesos, representing 1.5% of the Gross Domestic Product (GDP) in 2015, associated with about 8,000 deaths 2.
Among the primary air pollutants are gases such as sulfur dioxide (SO2), nitrogen oxides (NOx), ozone (O3), and carbon monoxide, in addition to particulate matter (PM2.5, PM10, and PST) 3. These pollutants are transported 4 and carried by winds over long distances 5, mainly due to atmospheric stability, which depends on the radiative balance and wind speed in the area 4. Several studies have considered the relationship between increased immission levels and the incidence of respiratory diseases 6.
In Colombia, Resolution 2254 of 2017 establishes air quality standards to ensure the population's well-being and reduce the risk to human health due to the degree of exposure present 7.
Colombia's highest air pollution levels occur in urban areas and major industrial sectors, where approximately 74% of the population lives. These pollutants come mainly from fossil fuels used by mobile, stationary, or area sources. Forty-one percent of Colombia's total emissions are located in Bogotá, Medellín, and Cali 8.
Santiago de Cali is one of the main cities in the country and has several industries that contribute to generating atmospheric emissions. Some of the fuels commonly used in these industries emit sulfur dioxide (SO2), which reacts with photochemical oxidants in the atmosphere to form sulfur trioxide, which combines with water to form sulfuric acid and sulfate particles that contribute to the process of generating acid rain. 9.
The present study focuses on the city of Santiago de Cali, considering four receptors to model the concentrations of the pollutant sulfur dioxide (SO2) emitted by two industrial boilers. It compares the variation in concentrations due to the substitution of liquid fuels (Fuel Oil and Diesel) for natural gas. Boiler 1 belongs to an industry dedicated to manufacturing and dyeing textile garments, while boiler two is located in an industry that performs waste incineration processes 10.
Methodology
The study area, the scenarios considered, the location of the receptors, and the parameters used for modeling the dispersion of the pollutant are detailed below.
Study area
Cali, the capital of the Valle del Cauca department, is in the country's southwestern corner. It comprises 22 municipalities and 15 districts, has an average altitude of 1,000 meters above sea level, and covers an area of 619 km2 (11. The air quality monitoring system of Santiago de Cali has nine fixed monitoring stations that measure criteria pollutants, three fixed stations, and one mobile unit for measuring environmental noise 12.
Resolution 2254 of 2017 establishes the maximum permissible values for the concentration of criteria pollutants, as detailed in Table 1.
Table 1 Maximum allowable criteria pollutants.
| Pollutant | Maximum permissible level µg.m3 | Exposure time |
|---|---|---|
| rowspan="2"PM10 | 50 | Annual |
| 75 | 24 hours | |
| PM2.5 | 25 | Annual |
| 37 | 24 hours | |
| SO2 | 50 | 24 hours |
| 100 | 1 hour | |
| NO2 | 60 | Annual |
| 200 | 1 hour |
Source: Adapted from 7.
Table 2 describes the three fuels of interest: Fuel Oil, Diesel, and Natural Gas.
Table 2 Characteristics of the different fuels.
| Fuel | Description | Calorific Power | Sulfur Content (S) |
|---|---|---|---|
| Fuel Oil | It is produced in the fractionated refining of petroleum. This fuel is very dark and black. It is mainly used in power plants, furnaces, and boilers; it can be refined to produce asphalt and lubricants 13. | 150204 BTU/Gal | 1.8% |
| Diesel | A hydrocarbon is composed of paraffins and is mainly used in diesel engines and as boiler fuel 13. It generates high heat temperatures; this fuel cannot be exposed to low temperatures because the paraffins could solidify 13. | 140000 BTU/Gal | 0.0015% |
| Natural Gas | Natural gas is a gaseous mixture of light hydrocarbons whose main components are methane, ethane, and, to a lesser extent, propane, butane, pentane, and various heavy hydrocarbons 14. | 136.35 BTU/Gal | 1.4364E-6 Lb/ft3 |
Source: Adapted from 14.
Annex 1 Modeling domain, receiver locations, and modeling sources details.
Scenarios
This study has two scenarios. Scenario 1 considers the two industrial boilers of interest with their respective fuels: fuel oil in boiler 1 and diesel in boiler 2. In scenario 2, the fuel is changed to Natural Gas.
Table 3 shows the chimney characteristics of each selected stationary point source. If the sources exist, these parameters are obtained through isokinetic sampling; if they are projected, they are established in the design of the stacks.
Table 3 Characteristics of the two fixed point sources.
| Parameters | Boiler 1 | Boiler 2 |
|---|---|---|
| Fuel | Fuel Oil | Diesel |
| Location | Carrera 1 No. 39 - 55 Comuna 4 | Av. 4N #7N-81 Comuna2 |
| UTM Location | X: 331909.52 m Y: 383386.48 m | X: 329243.78 m Y: 381987.57 m |
| Chimney diameter | 0.60 m | 0.30 m |
| Chimney height | 15.0 m | 44.8 m |
| Exit area | 3.043 ft2 | 0.761 ft2 |
| Boiler Power | 350 BHP | 150 psi |
| Boiler Capacity | 17.700 lb/hr | ---------- |
| Average gas velocity in the chimney | 19.06 ft/S | 8.77 ft/S |
| Exhaust gas temperature | 387.594 K | 313.15 K |
Source: Adapted from 15.
Location of the receptors
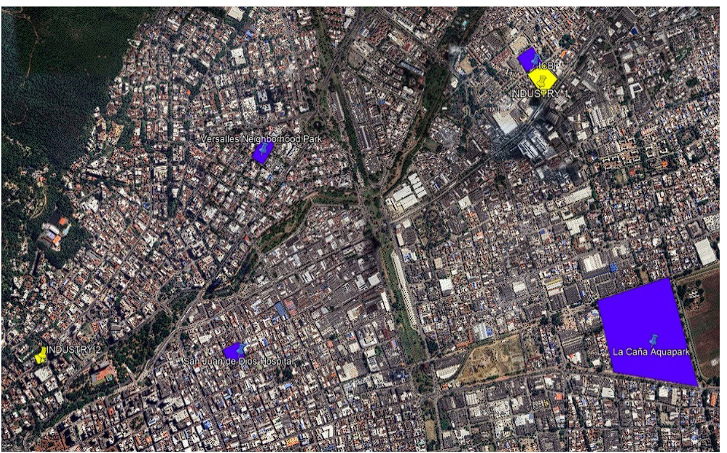
Four receptors were selected in the city of Santiago de Cali, considering the main factors: the points with a high influx of people or if there is a vulnerable population that is more likely to present health effects due to exposure to SO2 pollutant emissions. Figure 1 shows the location of the two fixed point sources and the receptors.
Table 4 shows the selected receptors with their respective geographic coordinates.
Table 4 Location of the receptors in UTM Zone 18N.
| Points | Receptors | X (m) | Y (m) |
|---|---|---|---|
| 1 | San Juan de Dios Hospital | 330288.84 | 381999.86 |
| 2 | Versalles Neighborhood Park | 330411.83 | 383040.39 |
| 3 | La Caña Aquapark | 332512.31 | 382040.27 |
| 4 | ICBF Northeastern Zonal Center | 331876.62 | 383500.37 |
Source: Google Earth.
Annex 1 shows the grid of receptors to estimate the field of concentrations.
Modeling using Aermod View
The AERMOD VIEW software is a stationary Gaussian plume model 16 used to determine the dispersion of pollutants from existing emission sources or to model the dispersion of pollutants 17.
The following must be taken into account for modeling:
Atmospheric emissions
The sulfur dioxide (SO2) emissions inventory is carried out using the emission factors of the United States Environmental Protection Agency (AP-42) Chapter 1 for the different fuels of interest, such as fuel oil, diesel, and natural gas. Table 3 shows the parameters for the design of the stacks.
The SO2 emission calculation uses the formula E = Emission, FE = Emission factor, and P = Boiler power.
E = FE x P (1)
The emission calculations for each of the scenarios are made.
Scenario 1
The following is a detailed description of the calculations made to obtain the emission of each of the industrial boilers.
Boiler 1
Considering the SO2 Emission Factor, according to AP-42 Fuel Oil Combustion Boilers <100 million BTU/h N°6. The calorific value is 150204 BTU/Gal, and Sulfur (S) is 1.8%.
𝑃: 3433.33 𝐾𝑤
The SO2 emission is calculated.
In this way, each of the corresponding calculations for boiler 2 is performed, considering that the calorific value is 140000 BTU/Gal and the sulfur percentage is 0.0015% 18.
Scenario 2
In scenario 2, a mass balance is performed to determine the emission factor for the two industrial boilers operating with Natural Gas, considering that this fuel has a calorific value of 136.35 BTU/Gal and a sulfur content of 1.4364 x 10⁻⁶ Lb/ft3.
Mass Balance
𝐹𝐸: 𝑆𝑢𝑙𝑓𝑢𝑟 𝐶𝑜𝑛𝑡𝑒𝑛𝑡 x 2
As mentioned above, using equation 1, the SO2 emission is calculated from the emission factor and the activity. Table 5 specifies the emission factors (g/KW-s), activity (kW), and SO2 emission (g/s) for the boilers in the two scenarios.
Meteorology
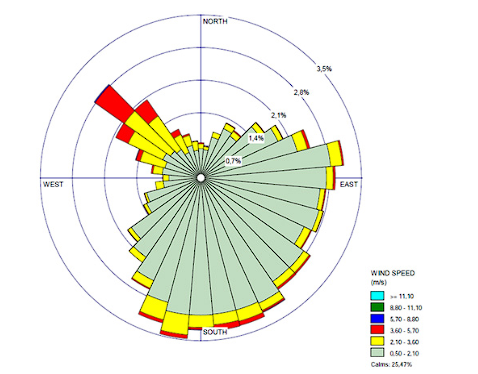
For the present study, meteorology for the year 2022, obtained from WRF 18, is used from January 1 to December 31. Figure 2 shows the wind rose of the city of Santiago de Cali, where it is possible to observe winds with predominant directions towards the southeast, mainly due to the winds coming from the country's interior, with a speed between 0.50 to 2.10 m/s. Likewise, winds predominate towards the northwest due to the winds coming from the Pacific, with speeds of 3.60 to 5.70 m/s. Therefore, the wind direction is essential to estimate the dispersion of pollutants. Annex 2 shows the surface and height (profile) meteorological data for 2022 used in the modeling.
Topography
The Digital Elevation Model (DEM) dataset known as GTOPO30/ SRTM30, which was obtained by collecting information during the Shuttle Radar Topography Mission (SRTM) developed in February 2000 with the GTOPO30 dataset provided by the U.S. Geological Survey, is used. 19.
Results and discusión
Below are the modeling results for the two scenarios, for one hour and 24 hours, according to the Colombian air quality standard.
Scenario 1
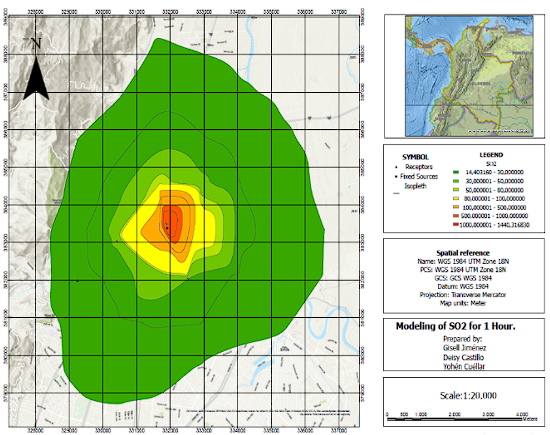
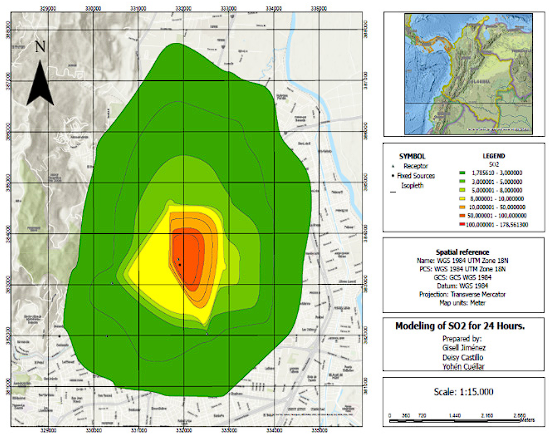
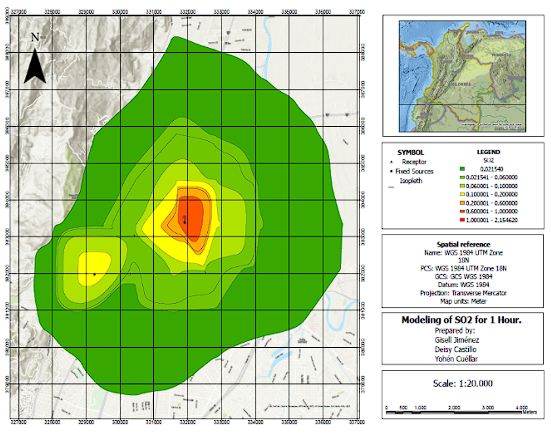
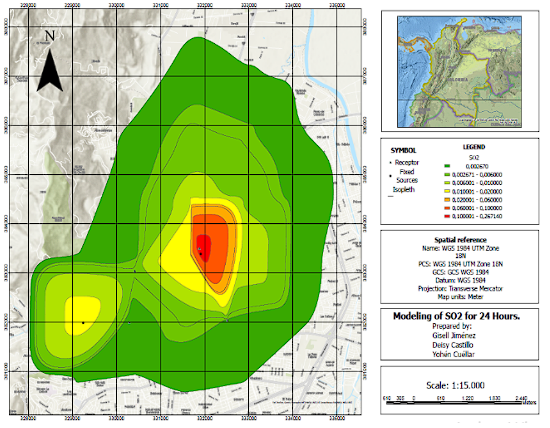
Figure 3 shows the results of the one-hour modeling; its highest concentration is 495.09 µg/m3, which does not comply with the maximum permissible limit values established in resolution 2254 of 2017, given that for 1 hour the maximum permissible value is 100 µg/m3. In Figure 4, the 24-hour modeling can reach a maximum concentration of 26.92 µg/m3, complying with the current regulations establishing for 24 hours a maximum permissible value of 50 µg/m3. For both models, the point of highest concentration is the residential areas of commune 4 (coordinates 383344.56N; 331663.4E). It should be noted that boiler 2 uses diesel as fuel; its SO2 concentration is within the permissible values, mainly due to the lower percentage of sulfur compared to fuel oil. It should be mentioned that in the case of diesel, the reduction is 99.67% between 1999 and 2023 20, contributing to the reduction of SO2 emissions.
Scenario 2
Figure 5 shows that the one-hour modeling reaches its highest concentration of 0.74 µg/m3, and Figure 6 shows the 24-hour modeling, with a maximum concentration of 0.04 µg/m3; this scenario complies with current regulations. For both modeling scenarios, the point of highest concentration is the residential areas of commune 4 (coordinates 383344.56N; 331663.4E).
Comparison of the Receptors
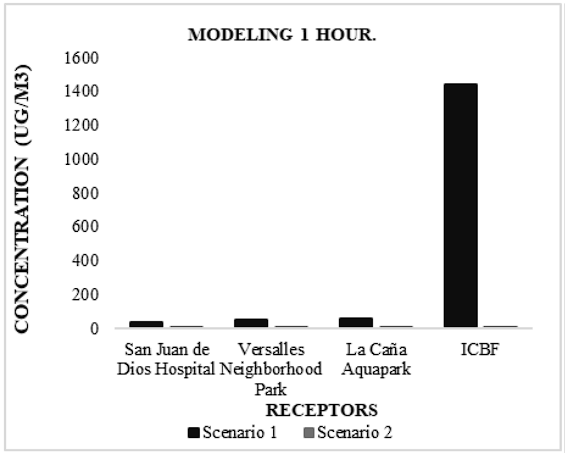
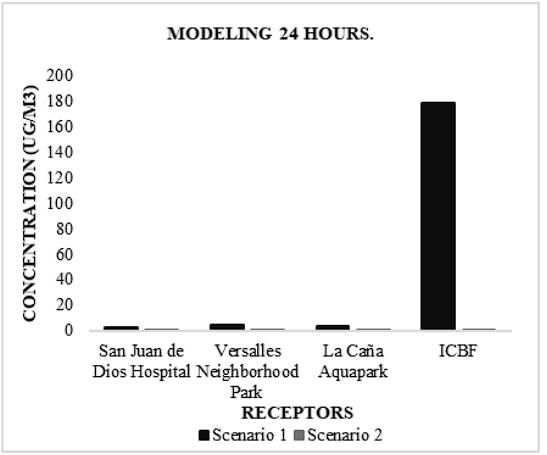
Figures 7 and 8 compare the scenarios depending on the exposure time according to the receptors.
The receptor that presents the most significant impact due to SO2 emissions is the Colombian Institute for Family Welfare (ICBF). In scenario 1, the maximum permissible limits are not met according to current regulations for both models; for 1 hour, it reaches a concentration of 1440.32 µg/m3, and for 24 hours, it reaches a concentration of 178.56 µg/m3. This result affects the sector's population because they are mainly children and are more affected by the harmful effects of exposure to high concentrations of SO2 with certain respiratory diseases for the health of everyone. Scenario 2 complies with the maximum permissible limit values according to current regulations; for both models, for 1 hour, it reaches a concentration of 2.15 µg/m3, and for 24 hours, it reaches a concentration of 0.27 µg/m3. Therefore, industries must implement a fuel that generates lower emissions, such as natural gas, which reduces the concentration of SO2 emissions, positively impacting the environment and the population's health.
Several studies indicate that natural gas is an ideal fuel for boilers and furnaces, among other uses. It contributes to efficient production processes compared to other types of fuels, varying according to the industrial sector. An example is the textile sector, in which energy consumption decreases, thus reducing production costs 21.
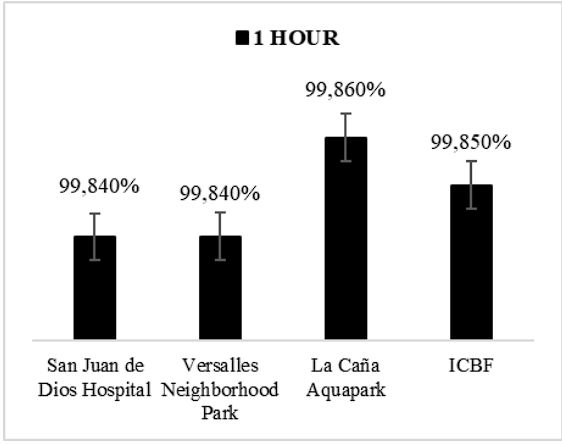
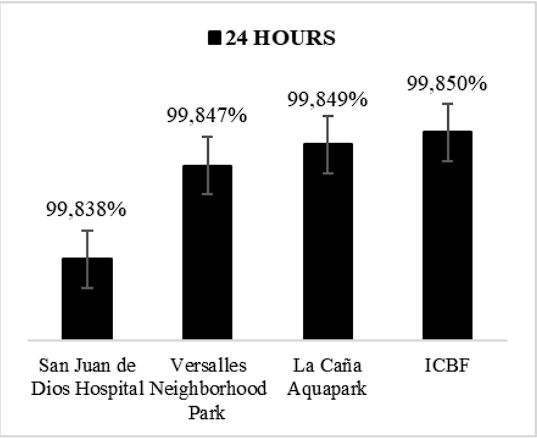
Figures 9 and 10 show the percentage difference between the two scenarios according to the SO2 modeling for 1 hour and 24 hours.
Validation of the modeling results is essential for comparison with the data measured by the monitoring stations. In this case, due to the scope of the study, such validation was not carried out; however, the need to perform this analysis is emphasized.
Conclusions
In this work, the evaluation and modeling of SO2 concentration was performed for two industries that use (Fuel Oil and Diesel) as boiler fuels. It was found that the fuel oil generates higher concentrations of SO2, which are outside the maximum permissible values established by resolution 2254 of 2017. Therefore, a comparison was made through modeling with the change of fuel to natural gas for the two industries, where it was evidenced that this generates lower concentrations of SO2, one of the options that positively impacts the environment. Therefore, it is recommended that this fuel change be made and thus contribute to improving urban air quality.
The Aermod View software identifies the areas with the highest concentration of SO2, not only in the receptors selected for this study but also in other points. For example, the residential area of Comuna 4 in the city has a concentration of 495.09 µg/m3, which does not comply with resolution 2254 of 2017.
It is crucial that industries use liquid fuels with low sulfur content and implement programs to protect air quality, thus contributing to reducing atmospheric emission concentrations.
The validation of the modeling is crucial for the effective comparison with the data obtained by the monitoring stations; this study did not perform such validation due to the scope's limitations, which are of great importance to perform in future research.


