Introduction
Peristaltic pumps are hydraulic. They pump fluids by displacement through flexible tubes or hoses located inside the pump housing. These pumps are used for transporting biological fluids, pumping substances such as acids, creams, emulsions, in laboratories and processes with small flow rates 1. There have been several studies on this subject. López 2, for example, developed a peristaltic pump based on stepper motors. Díaz 3 characterized two peristaltic pumps controlled by a DC motor and a stepper motor, as well as a diaphragm pump, and Moraes 4 developed flow control for peristaltic pumps using an Arduino platform and a flow sensor. Several investigations have been carried out in the mathematical modeling of peristaltic pumps 5-8. Several investigations have been carried out in the mathematical modeling of peristaltic pumps 5-8. Peristaltic pumps require sterile tubing in most cases due to the fluids being transported. Therefore, characterization of peristaltic pumps using nonlinear regression 9, a least squares curve fitting method, is presented as an alternative. The application of this mathematical modeling has yielded excellent results in several studies. Velasquez 10, for example, used three nonlinear regressions to predict Mackey-Glass time series. Cobos et al. 11 compared the results of heuristic techniques ABC Artificial Bee Colony and PSO Particle Swarm Optimization used for parameter estimation of nonlinear regression models. Galeano and Cerón 12 modeled of Lohmann LSL chicken growth using neural networks and nonlinear regression models. Vera et al, 13 used nonlinear regression in modeling a solar panel. Finally, it is important to note that it was one of the mathematical methods used to study the pandemic caused by Covid-19 14-18.
Materials and methods
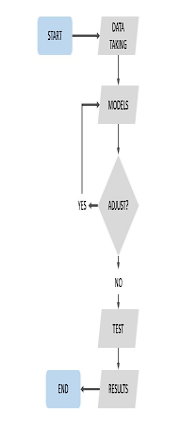
A descriptive and applied methodology was used to develop the research, as shown in Figure 1.
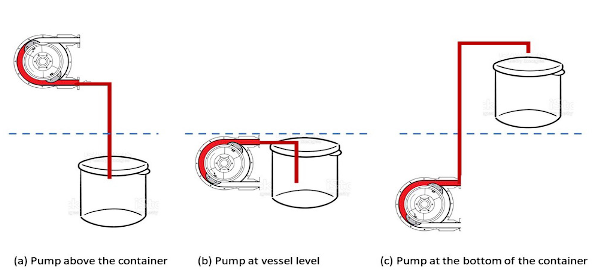
Peristaltic pumps are used that have potentiometers for voltage variation which modifies the flow intensity. Data collection begins with a precision test that varies the vertical position of the pump with respect to the fill tank, as shown in Figure 2.
The purpose of this test is to analyze the effect of this variation in fluid velocity to determine if this changes the performance of the pumps and if so, to include this variable in the mathematical analysis.
The pump is placed above the level of the vessel as shown in Figure 2(a), then at the same level as shown in Figure 2(b), and finally, the pump is placed at a lower level than the vessel, as shown in Figure 2(c).
Data were collected for filling 300 ml of water with the two pumps by changing the voltage and recording the time in seconds. With this data, we proceed with mathematical modeling using nonlinear regression. Curve fitting is performed and the modeling is repeated until the best results are found. Exponential, polynomial, potential, and Gaussian models were developed, with the exponential model being the most successful. Filling tests are performed with the obtained models and the model times are compared with the real times.
Results and discussion
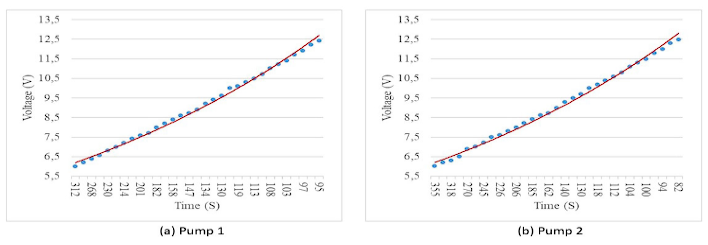
The accuracy test shown in Figure 2 indicated that the height of the pump with respect to the container did not change the behavior of the liquid. We then plotted the data for 300 ml by plotting the voltage against time, as shown in Figure 3
With the above data, a nonlinear regression model is developed using academic software. Exponential, Gaussian and quadratic modeling is performed, with the exponential model yielding the best results. Figure 4 shows the model developed for each pump.
The purpose of the study is to determine the time required for each pump to fill a certain amount of volume according to the applied voltage. After performing a dimensional analysis 19, the dependent variable is time (t) and the independent variable is voltage (v).
The applied exponential model obtained a coefficient of determination of 0.9875 for pump 1 and 0.9956 for pump 2. The model for pump 1 is described by Eq (1).
The model of the second pump is described by Eq (2).
Finally, for each model, a simple rule of three was used to find an Eq (3) for each desired filling volume, as follows:
𝑡(𝑣) is the time for any volume v, and t(300ml) is the filling time of 300 ml found with the developed exponential models. Applying Eq (1) and Eq (2) in Eq (3), we have Eq (4) and Eq (5), for each pump respectively.
Considering that the peristaltic pumps used have variable voltage, the flow rate will be variable and is defined by Eq (6).
Applying Eq (4) and Eq (5) to Eq (6), we have Eq (7) and Eq (8) for the flow rate of each pump as a function of applied voltage.
By performing fill tests for different volumes and comparing the time required with the model time, the errors in each test were calculated. The average errors for all tests were then calculated and the results shown in Table 1 were obtained.
Table 1 Average errors in all tests
| Volume Pump 1(v) | Average error (%) | Volume Pump 2(v) | Average error (%) |
|---|---|---|---|
| 200ml | 0,52 | 200ml | 0,79 |
| 400ml | 0,43 | 400ml | 0,59 |
| 800ml | 0,64 | 800ml | 0,38 |
| 1000ml | 0,63 | 1000ml | 0,78 |
| 1200ml | 0,74 | 1200ml | 0,29 |
| 1400ml | 0,53 | 1400ml | 0,67 |
| 1600ml | 0,72 | 1600ml | 0,34 |
| 1800ml | 0,82 | 1800ml | 0,52 |
| 2000ml | 0,99 | 2000ml | 0,41 |
Average errors of less than 1% are evident in all tests.
Conclusions
The accuracy test showed that varying the pump head with respect to the container does not change the fluid velocity. This facilitates modeling by not having to include another variable in the analysis. The measures of determination showed accurate modeling for the two peristaltic pumps, with the exponential model being the most accurate. The models had an assertiveness greater than 99%, as the average errors were less than 1% in all tests. Nonlinear regression is an effective mathematical model for characterizing peristaltic pumps whose use does not require sterile flow sensors, which can be expensive. Clarification of the formula using the simple rule of three to determine the filling time of any volume, with modeling performed only for 300 ml, shows that the filling volume is a variable that varies linearly and proportionally to the models developed. It is proposed to expand research on the use of nonlinear regression as an alternative for the control of biological fluids when the use of sterile instruments is required.


