1. INTRODUCTION
In the last fifty years, maritime transport has gained great importance [1] because it is the most energy efficient way to move goods compared to air and land transport. It currently accounts for 95% of world trade transit [2]. This means of transport is considered environmentally hazardous, due to the pollution of the marine sector as a consequence of ongoing operations, accidents [3], [4], and gases emitted from burning fuel (generally heavy fuel oil (HFO)) [5], which is composed of: carbon dioxide (CO2), sulfur oxides (SOx), nitrogen oxides (NOx), carbon oxide (CO), hydrocarbons (HC) and particulate matter [1], [6]. This has been maintained for many years due to the absence of innovation in environmentally friendly fuels and the low implementation of renewable energy sources in this sector [5].
The International Maritime Organization (IMO) estimates that CO2 emissions from international shipping grew to 1056 million tons in 2018 (an increase of 9.3% over 2012), and an increase of between 90% and 130% of emissions is projected by 2050, taking 2008 data as a baseline [5]. For this reason, the IMO has sought to implement climate mitigation measures and targets to encourage shipping companies to implement emission reduction measures. For example, in 2013, it was established that all new ships must comply with the Energy Efficiency Design Index (EEDI) [5].
As a solution to this problem, the use of solar energy on ships is proposed to reduce fuel consumption and greenhouse emissions [7]. Green propulsion systems are destined to grow, it is expected that by 2040 cargo ships will reduce their carbon dioxide emissions by 40% [1]. In [1], the use of solar energy on ships is indicated as a way to meet the greenhouse gas emission requirements proposed by IMO. According to the EEDI regulation for new ships, they must meet the minimum energy efficiency standard, being 10% more efficient (equivalent to CO2 emissions reduction) from 2015, 20% more efficient by 2020, and 30% more efficient from 2025. Consequently, it is imperative to innovate and improve new vessel technologies to achieve energy savings and compliance with higher energy efficiency standards in the future.
The use of these new energy technologies for boats implies that the propulsion system also changes [8], [9], [10], for this reason, the technology of rotary electric machines has been implemented, which produces fewer polluting emissions than internal combustion engines. These machines can be classified into three main groups: direct current (DC) motors, alternating current (AC) motors and universal motors (allowing AC and DC power supply). DC motors are classified according to the type of excitation: series, parallel, or compound. On the other hand, AC motors can be classified according to the way they rotate synchronous (they can be divided into synchronized asynchronous, three-phase or permanent magnet rotor) and asynchronous motors, also AC motors can be classified according to the number of power supply phases into single-phase, two-phase and three-phase [11], [12].
In the literature, some investigations compare DC motors and AC motors for different research fields. In [13] an experimental analysis is presented for a universal motor when powered by a DC source and an AC source, then the response is compared under the following parameters: voltage, current, power, torque, and revolutions per minute (rpm) and power factor. Finally, the article concludes that for the application of a drill the efficiency of the motor is directly related to the type of power supply, establishing that the motor with DC current injection is more efficient in a percentage of 5.63% compared to the motor when AC current is injected.
Similarly, in [14] the dynamic characteristics of hydraulic, pneumatic, and AC and DC electric motors for servo applications are compared, as comparison indices were selected: power density, torque-inertia ratio, power and power rate density. The study concludes that the power density of hydraulic motors is ten times higher than that of electric and pneumatic motors for the presented application.
In [15] 2 brushless motors are compared, one DC and the other AC, with the aim of discovering which is the most efficient taking into account criteria such as: loss of PWM carrier frequency by means of circuit simulation, finally the study concludes that the Dc brushless motor has better efficiency than AC brushless motor according to studies. Additionally, this document highlights motor controllers like a piece in the propulsion system of a boat that allow the speed of the machine to be regulated. The control of AC motors is different from the control of DC motors, because in the control of AC motors it is done from the variation of frequency while in DC motors it is done with the variation of speed, one The disadvantage of AC motor control is that harmonics are induced in the network, which is reflected in losses [15], [16].
Regarding the comparisons made for electric motors with AC and DC in transportation applications, [17] presents the study for urban ecological electric cars with two types of motors, the DC permanent magnet motor, and the AC induction motor, as evaluation criteria, efficiency and transmission ratio are taken into account. For efficiency, copper losses, iron losses, constant losses, friction, and windage are evaluated. The results determined that the induction motor presents better performance than the permanent magnet motor.
In the context of marine applications, [18] compares the performance of an induction motor and a permanent magnet synchronous motor for a propulsion system. Finally, the article presents that the induction motor is the most suitable to be used in POD propulsion systems (propulsion with outboard motors), due to its better tolerance to short circuit failure, mechanical and thermal robustness, and low cost.
The selection of the right engine for the propulsion of marine vessels is a fundamental decision because a poor choice can negatively affect the performance of the vessel, costs can be increased, safety and reliability can be decreased, generating overheating, and causing the propeller to lose efficiency [14], [19]. In [20], the author proposes a model to determine the energy efficiency of the propulsion system of a diesel hybrid vessel with different system configurations, energy efficiency is assessed taking into account the vessel's fuel consumption, finally, it is concluded that the implementation of the hybrid system with a DC source can improve the efficiency of the entire power train of the ship due to the variable speed operation in the motors.
Some studies show that running the engine in marine applications with a speed independent of frequency saves fuel consumption compared to fixed speed systems because the engine speed can decrease when the vessel load is low. Additionally, when AC power systems are replaced by DC power systems, the number of converters and dead weight are reduced, and efficiency is increased [21]. Similarly, in [22] it is mentioned that DC power systems are better than AC power systems in terms of power quality, reliability, energy losses and economy. Additionally, it is stated that with DC systems marine engines can work at the optimum point and reduce fuel consumption and emissions [22]. in the same way in [23] It is concluded that based on the weight of an integrated electric propulsion system, the DC is between 31 and 41% lighter than the AC propulsion system and regarding consumption, the DC propulsion system consumes between 20-25% less fuel. in one year than the AC propulsion system. Relative to energy efficiency between AC and DC power systems for various marine vessels is not well represented in the literature [20] and there has not been much literature discussing the application of integrated electric propulsion-based DC power system in small vessels [23].
The objective of the article is to make a comparison between a three-phase asynchronous motor and a DC motor with independent excitation in the propulsion of a maritime fishing vessel using computational tools. For this, changes in the hydrodynamic behavior are modeled in the Maxsurf software in different wave and swell conditions, with roll, pitch, and yaw movements. To select the propeller, it is taken into account that a vessel for fishing applications has distinctive characteristics in speed, maneuvering, construction, and storage [24]. The propulsion system assembly must have a large pulling capacity, for this reason, a 3-bladed propeller is selected as done in [24], [25].
2. METHODOLOGICAL ASPECTS
The displacement operations of a vessel in the water induce movements of 6 degrees of freedom [19], 3 translationally (vertical translation, lateral translation, longitudinal translation) and, 3 rotationally (pitch, roll, yaw) on the x, y, z axes of a boat; which are important to evaluate to know the behavior of a motor boat.
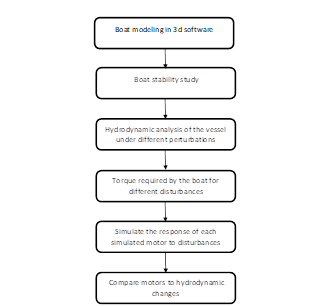
Figure 1 presents each of the stages proposed to make the comparison between 2 electric motors to propel fishing boats.
2.1 Vessel design
The comparison between DC and AC motors will be evaluated for an application in the propulsion system of a fishing vessel. For this, it is necessary to know the dynamic behavior of the vessel, which is affected by the weight of the vessel, the speed, the disturbances due to the change in the sea waves, and variations in wind speed. In this way, the engine must respond to different boat conditions.
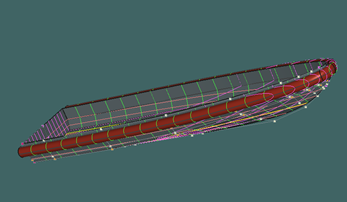
To carry out studies of dynamic behavior it is essential to develop a three-dimensional model of the boat. The model of the fishing vessel was taken from [26], where Maxsurf software was used, which is a design program for naval applications that allows simulating studies of dimensioning, strength, stability, and dynamic behavior of maritime vessels. For the modeling of the fishing vessel, the following dimensions were used: length 12 m, beam 2.4 m and strut 1.6 m, using the Maxsurf modeler component. Figure 2 shows the model of the vessel in the Maxsurf Modeler Advanced component.
2.2 Boat stability study
With the three-dimensional model of the vessel, a stability study or equilibrium test was carried out, where parameters such as the " thread ship", which is the weight of the hull or actual weight of the vessel when it is finished, were considered, as well as the "dead weight", which refers to the vessel's load or capacity to carry. To identify the stability behavior of the vessel, the Maxsurf stability component was used, where the previously obtained model and the mass distribution shown in Table 1 were added.
Table 1 Mass distribution in fishing vessels
| Name | Weight - mass (kg) | Longitudinal center of gravity (m) | Vertical center of gravity (m) |
| Boat hull | 440 | 6 | 0.8 |
| People | 150 | 5 | 1.8 |
| Fishing | 40 | 1.5 | 1.5 |
| Total Load | 670 | ||
| Center of Gravity | 5.507 | 1.066 |
Source: Created by the authors.
The Maxsurf stability component provided the vessel's center of gravity (1,066m) in the face of an added mass distribution, considering the weight of the boat and its components, as well as the location in length and height of the vessel. These dimensions were taken into account for the specific case study with the data presented in Table 1, for other types of vessels with other dimensions and different applications, this center of gravity may change. Subsequently, Maxsurf Motions Advanced (modeler Advanced and stability components) was used, which allows a hydrodynamic analysis of the vessel under different perturbations and mass distribution.
2.3 Hydrodynamic analysis of the vessel under different perturbations
As a first step, the design of the boat is established in the hydrodynamic analysis program, then the center of gravity value obtained in the stability analysis is added to consider the weight of both the boat and its components, then we proceed to create the locations to which the boat will be exposed; conditions such as boat speed, angles, and spectra or disturbances due to sea waves and wind speed are considered.
For this analysis a bridge location was considered where the vessel is steered or handled and it was located at the rear due to the characteristics of a fishing boat, the analysis was executed for an average speed of 8 knots with the center of gravity of 1. 066m, heading angles of 135°,165°,180° and a Pierson-Moskowitz spectrum that defines the wave energy distribution of a fully developed irregular sea surface about wave frequency and wind disturbance [27], [28]. There are several idealized spectra that model the behavior of the sea depending on the geographical area in which the vessel will sail, such as Pierson-Moskowitz, Jonswap, the one proposed by Torres and Lonnin, among others [29]; the Pierson spectrum was used in this study because it simulates the behavior of the fully developed sea in which the waves are in equilibrium with the wind [29]. This spectrum is used to simulate the state and behavior of the sea and to identify the dynamic changes of the vessel due to disturbances such as waves and wind. The conditions used from the Pierson-Moskowitz spectrum are: wave height = 0.534 m; wave period = 3.652 s, average wave period = 2.822 s and wind speed = 9.7 kn.
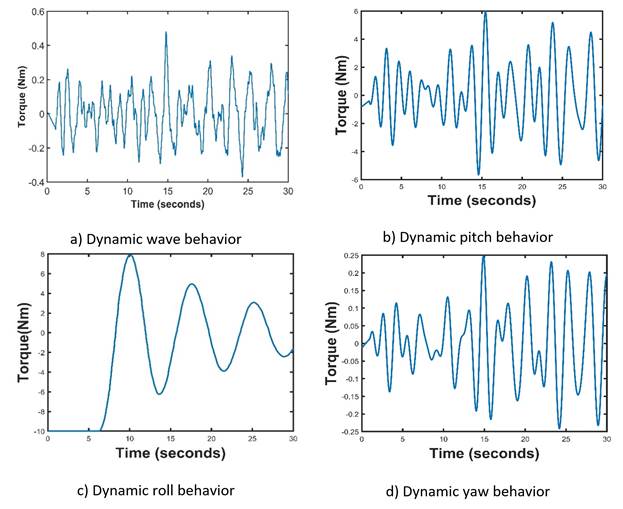
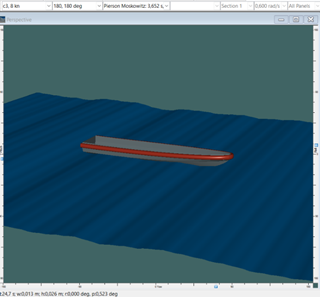
Once the parameters to which the vessel will be exposed have been defined, an irregular wave surface is calculated with the aid of the Motions program, and the dynamic behavior is simulated for wave, roll, pitch, and yaw motions (see Figure 3).
Source: Created by the authors.
Figure 3 Dynamic behavior under wave and wind disturbances for a speed of 8kn, 180° and Pierson Moskowitz spectrum
The simulation was performed for a time of 30 seconds in the Maxsurf Motions component. The data provided by the program are presented in units of distance (m) to expose the displacement exerted by the vessel under the different disturbances, with a full load.
2.4 Torque required by the boat for different disturbances
Taking into account the motion model provided by the Maxsurf software, this study proposes the demand dynamics in units of load torque (Nm) demanded in torque by the vessel, which is the resistance that opposes the movement and is established as the load torque to evaluate the force that each motor must exert to respond to the different dynamic changes. The proposed dynamics inputs in the form of torque to the motor are mapped in Figure 4 with Matlab software. For the study, a load torque behavior is proposed about to the wave motions figure 4 a), for pitching figure 4 b), for roll 4 c) and for yaw 4 d). To excite the motors and analyze their behavior.
2.5 Case study motor response to load torque changes
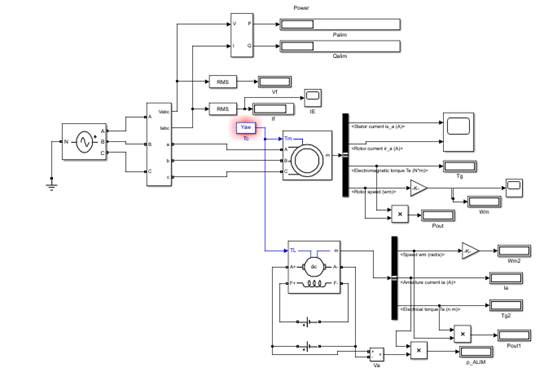
To determine the necessary capacity of the electric motor required to move the vessel at an average speed of 8 knots, use was made of the Maxsurf resistance component, where the methods of Holtrop and Savitsky [30], [31] were selected to calculate the estimated power of the motor from the vessel speed and the resistance that opposes the motion. This method was selected because it is used in a wide range of vessels such as general cargo ships, tugboats, fishing boats, oil tankers and frigates, additionally these vessels are classified as displacement and planning vessels. For other types of boats, methods such as the Delft Systematic Yacht Hull Series (DSYHS) are used, which was developed at the Delft University of Technology and has been evaluated in more than 50 sailboat models with different geometries. This method is considered to be of high precision and quality [32]. The motor capacity given by the computer program is 8HP, so to make the electromechanical comparison between AC and DC motors, a three-phase squirrel cage motor and a permanent magnet DC motor is selected, which are designed in the Simulink-Matlab software. The DC motor has the following parameters:
On the other hand, the alternating current motor has the following parameters:
The torque input to the engine are the disturbances of the hydrodynamic behaviors presented in figure 5. The comparison indexes were: torque, speed, current, and power supply this outputs that the simulation produced, these were selected taking into account the literature search [13], [14], [33]; because this study focuses only on an electromechanical analysis of the rotating machine called the motor. If you want to make a more advanced comparison that includes all the components of the propulsion system, you must add more elements to evaluate, such as the inverter, regulator, frequency converter, propeller shaft, propeller, gearbox, and evaluate additional parameters. The motors used for the case study have already been validated in different applications such as in industrial and transport sectors as shown in citations [34], [35].
3. RESULTS AND DISCUSSION
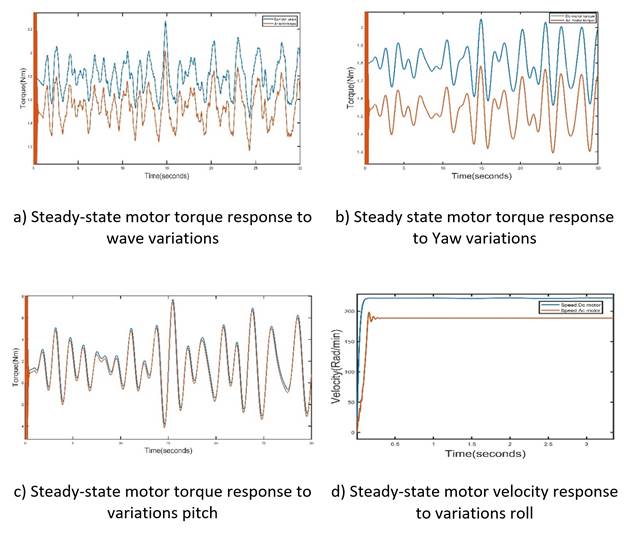
When analyzing the behavior of the boat in relation to changes in wave, yaw, roll and pitch, the curves shown in Figure 6 are obtained, where it is possible to analyze the behavior of torque, current and speed for the two motors studied.
Source: Created by the authors.
Figure 6 Behavior of torque to AC and DC motors to changes in waves, pitch, roll and yaw of the vessel
For the torque behavior with respect to the wave Figure 6a), yaw Figure 6b), pitch Figure 6c) and roll Figure 6d), it is observed that the torque of the DC motor is higher than the torque of the AC motor, evidencing that the DC motor generates greater force and greater acceleration. In addition, it is identified that in all cases the two motors respond to the dynamic behavior following the input torque reference. In the surge the torque oscillates between 1.4 Nm and 2.3 Nm, for yaw between 1.4 Nm and 2.1 Nm, in the case of pitch between -4 Nm to 7.8 Nm and in roll between -3.5 Nm and 6 Nm. Referring to the frequency of oscillation that delivers the torque of the two motors, it is evident that in the roll Figure 6d) the wave frequency is low while in the heave Figure 6a) the frequency is high in comparison to the other cases of study.
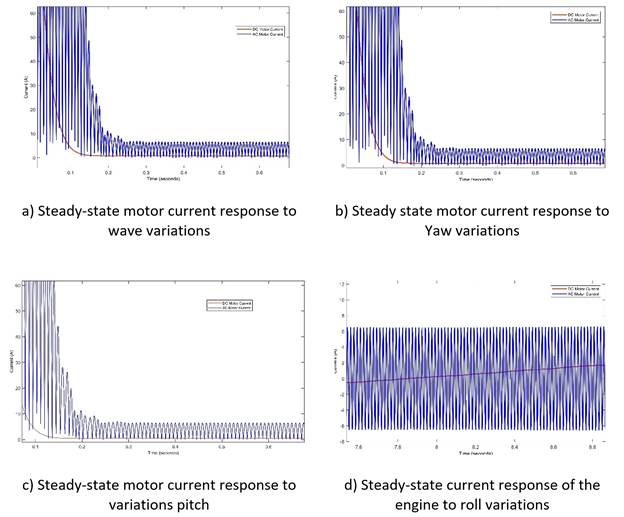
The current curves presented in figures 7a), 7b), 7c) and 7d) correspond to the output of the motors before the torque input required for the surge, yaw, pitch and roll behaviors respectively, from which it is possible to conclude that in steady state the AC motor presents greater oscillations than the DC motor for all the cases of study, where it is reflected that the response of the DC motor is smoother; on the other hand the AC motor needs to deliver more current to perform the same work in comparison to the DC motor. The behavior of the current in the squirrel cage motor oscillates between 0.1 A and 6.512 A and in the permanent magnet motor it is approximately 0.87 A.
Source: Created by the authors.
Figure 7 Behavior of current to AC and DC motors to changes in waves, pitch, roll and yaw of the vessel
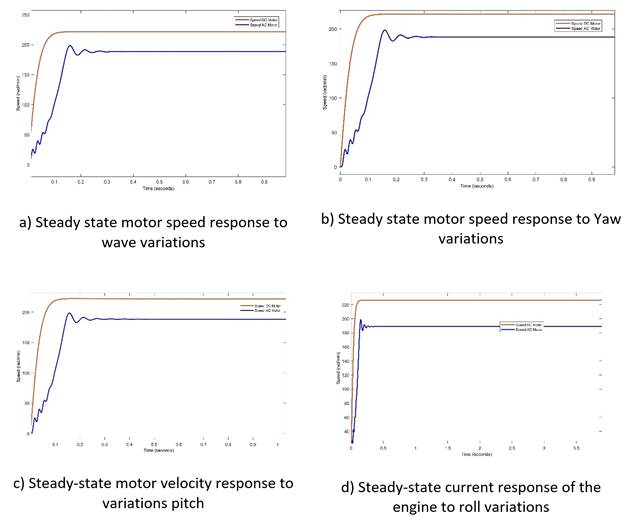
Concerning speed of the motors in the transient state, it is evident that the AC motor presents oscillations before stabilizing for all the required torque inputs as shown in Figures 8a), 8b), 8c) 8d). Similarly in the steady state, it is observed that the speed of the DC motor is higher than that of the AC motor for all the study cases. It is also analyzed that the magnitude of the speed remains constant in a steady state due to its electrical characteristics because the speed in AC motors can only be controlled by an electronic frequency inverter and in DC motors by changing the input voltage.
Source: Created by the authors.
Figure 8 Behavior of velocity to AC and DC motors to changes in waves, pitch, roll and yaw of the vessel
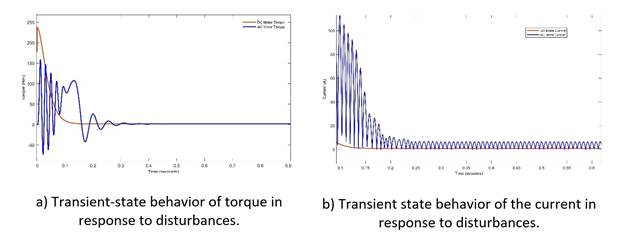
Regarding the transient state in Figure 9a) it is concluded that the DC motor generates a larger value in the starting torque before stabilizing, on the other hand, the torque of the AC motor presents oscillations, which are undesirable disturbances because they produce instability in the electrical system. Now, the current consumption required to perform the same work in the behaviors of the surge, roll, pitch and yaw in the transient state is higher in the AC motor compared to the DC motor, also in the roll and pitch the oscillations are more frequent.
Source: Created by the authors.
Figure 9 Behavior of AC and DC motors to transient state of the vessel
To support the electrical and mechanical analysis presented in the curves, a mathematical analysis of the behavior of the motors is performed, presenting an average of each of the variables to be studied, which are shown in Tables 2-5, to consider all the behavior in steady state for 30 seconds of simulation.
Table 2 Results of engines under dynamic wave behavior
| Motor | Voltage (V) | Current (A) | Power supply (W) | Output power (W) | Efficiency (%) | Torque (Nm) | Speed (rad/min) |
| Motor AC | 265.6 | 6.5100 | 332.9460 | 288.8519 | 86.75 | 1.5325 | 188.3727 |
| Motor DC | 500.0 | 0.8023 | 401.4348 | 398.2553 | 99.20 | 1.7986 | 221.3618 |
Source: Created by the authors.
Table 3 Results Engines in dynamic yaw behavior
| Motor | Voltage (V) | Current (A) | Power supply (W) | Output power (W) | Efficiency (%) | Torque (Nm) | Speed (rad/min) |
| Motor AC | 265.6 | 6.5100 | 332.9585 | 288.9380 | 87.77 | 1.5338 | 188.3726 |
| Motor DC | 500.0 | 0.8300 | 401.4979 | 398.4493 | 99.24 | 1.8001 | 221.3603 |
Source: Created by the authors.
Table 4 Results Engines under dynamic pitching behavior
| Motor | Voltage (V) | Current (A) | Power supply (W) | Output power (W) | Efficiency (%) | Torque (Nm) | Speed (rad/min) |
| Motor AC | 265.6 | 6.5170 | 325.6404 | 279.5022 | 85.80 | 1.4912 | 188.3766 |
| Motor DC | 500.0 | 0.7817 | 390.8369 | 384.1156 | 98.00 | 1.7589 | 221.3994 |
Source: Created by the authors.
Table 5 Results Engines under dynamic balancing behavior
| Motor | Voltage (V) | Current (A) | Power supply (W) | Output power (W) | Efficiency (%) | Torque (Nm) | Speed (rad/min) |
| Motor AC | 265.6 | 6.5210 | 323.5128 | 278.9860 | 86.00 | 1.7192 | 188.3682 |
| Motor DC | 500.0 | 0.7192 | 414.7990 | 405.6069 | 97.70 | 1.8422 | 221.4214 |
Source: Created by the authors.
The results shown in the tables confirm that the DC motor presents higher torque and higher speed with a lower current consumption compared to the AC motor. In addition, the variation of each of the variables for the dynamic behavior is observed.
Finally, from the input and output power calculations, the efficiency of the motors presented in Tables 2-5 is obtained, where it is concluded that the DC motor is more efficient than the AC motor in all the cases of study.
The main contribution of this investigation is the comparison of two electric motors to the different behavior variations of maritime and fluvial vessels, due to the fact that changes in the behavior of the environment in which a vessel is located can affect the efficiency of the motor, speed, torque, and energy consumption. Additionally, it is sought that people interested in the subject of maritime vessels with electric motors can take this study to consider if the DC motor or the AC motor is the best option, taking into account the technical bases studied in this article to determine the advantages of an engine or another before the same work. In addition, the contribution of this article is very timely because the world is in the process of energy transition where it seeks to replace conventional fuel sources with unconventional energy sources such as clean energy to help reduce the harmful effects generated into the environment by fossil fuels [36].
4. CONCLUSIONS
It is concluded that for different torques required for the changes or dynamic movements of the boat, the DC motor offers a better performance using less energy to perform the same work, this is evidenced in the efficiency of the motor calculated for the different torque inputs established. In addition, it is observed that the two motors require more torque for the dynamic rolling behavior, this is because the motor needs to make more effort to overcome the resistance that opposes this movement.
For the selection of a motor, it is important to consider the energy sources, because a DC powered motor would provide greater controllability of the vessel given its operating characteristics, which, although it may have high active power losses, it does not dissipate reactive power. On the contrary, motors fed with alternating current require DC/AC converters to adjust their parameters, which generates injection of harmonics that deteriorate performance and decrease efficiency due to the presence of reactive power. Additionally, DC motors do not generate reagents and allow for simpler control, on the contrary, they show considerable copper losses that affect energy efficiency.
As future work, it is proposed that the simulation structure proposed in this article be implemented with prototypes of boats similar to the one established, in laboratories where naval applications with electric motors are studied. In a similar way, it is suggested to carry out tests with prototypes of boats with different characteristics to the proposal that use electric motors where it is possible to change the behavior of the input source.
Additionally, it is proposed to implement this case study in research projects financed by government entities or educational institutions based on research, such as the sustainable rural energization projects (PERS) that exist in Colombia. The results can also be validated in a real prototype that will be developed in Guapi Cauca through the Pacific Econavipesca project: ecosystem for sustainable fishing navigation in the municipality of Guapi, Cauca, where a fishing boat will be built which will be powered by renewable energy sources.
Finally, it is proposed to explore the calculation of the energy demand consumed by the electric motor through other software such as Labvolt and to investigate new strategies that allow optimization of simulation times in different computer programs.


