In the current environment, the execution of any industrial operation sans the application of machine learning is nearly implausible (Chhajer et al. 2022; Chang et al. 2022; Liao et al. 2023). Artificial Neural Networks (ANNs) are one of the most widely used machine learning techniques for modeling, regression analysis, and classifying agricultural products (Çetin and Sağlam 2022). The capacity to develop prediction models utilizing ANNs has been a significant contribution of artificial intelligence and machine learning (Rodríguez-Hernández et al. 2021; Soumyabrata et al. 2022).
Due to the complex relationship between molecular structure and activity, linear models often fall short in capturing all sources of variation. Artificial Neural Networks (ANNs) are particularly effective for modeling non-linear interactions. Among these, the multi-layer perceptron (MLP), a type of ANN, offers near-perfect estimates compared to linear models (Çetin and Sağlam 2022; Vidra and Németh 2022).
ANN is an algorithm meant to grasp complex difficulties that basic machine learning algorithms cannot. ANNs are constructed in a more sophisticated and intricate network of interconnectedness than the human brain (Costa et al. 2022). The approach is based on algebraic equations and is intended to channel data to a model (Chhajer et al. 2022).
In the most basic terms, ANNs are a network of numerical equations. A sequence of equations is used to process one or more input variables, resulting in one or more outputs. Every network has three layers: an input layer, a hidden layer, and an output layer. The independent variables or predictors are represented by the input layer, the hidden layer is where the mapping between input and output occurs, and the output layer is the dependent variable. The precise prediction of weights is critical to obtaining a decent model. This aim is accomplished by the backpropagation algorithm; it is this algorithm that distinguishes ANN as a learning model (Chhajer et al. 2022; Rodríguez-Hernández et al. 2021).
The benefit of ANNs is that they can learn from historical data and have a general framework. In addition, when compared to the response surface technique (RSM), the key advantages of ANNs are: ANNs do not require any prior definition of an adequate fitting function, and they are capable of universal approximation. They can estimate practically any nonlinear function, including quadratic functions; RSM, on the other hand, can only estimate quadratic functions. To create an efficient model, ANN is expected to need a significantly greater number of experiments (number of patterns) than RSM. Indeed, ANNs may perform well even with limited data as long as the data is statistically properly distributed in the input domain, as is the case with Design of Experiments. As a result, RSM experimental data should be sufficient to build an effective ANN model (Vidra and Németh 2022). ANNs are presently the most widely used artificial learning techniques in biotechnology, with applications ranging from pattern detection in chromatographic spectra to functional studies of genomic and proteomic sequences (Hesami et al. 2020).
Fruits are frequently high in bioactive chemicals like vitamins, phenolic compounds, carotenoids, flavonoids, and so on, which are heat-labile components whose rate of degradation varies depending on the process conditions used. The loss of bioactive substances throughout the manufacturing process can be accelerated or slowed by the product composition (jam), such as pectin type and concentration, sugar, fruit and cultivar, and pH. These are ready-to-eat, shelf-stable goods that can be transferred to any location (Shinwari and Rao 2018).
Vaccinium corymbosum (blueberry) is one of the most commonly consumed soft fruits and is recognized as an important source of bioactive components in the human diet, playing an important role in maintaining a healthy lifestyle; bioactive chemicals found in blueberries, such as flavonoids, stilbenes, phenolic compounds and tanins, may protect against degenerative illnesses, and their health benefits are frequently linked to antioxidant qualities (Dias et al. 2023; Dong et al. 2023; Barraza-Jáuregui et al. 2017). The health advantages of antioxidant activity and phenolics are mostly connected to their ability to scavenge free radicals. Excessive reactive oxygen species generation can cause oxidative stress in cellular lipids, proteins, and nucleic acids, which has been linked to the development of cancer, cardiovascular disease, diabetes, central nervous system illnesses, and chronic obstructive pulmonary disease (Çetin and Sağlam 2022). Furthermore, taste is the most essential element driving customer preferences, making flavor a key aim. Blueberry flavor perception has been linked mostly to the mix of sugars, acids, and volatile organic chemicals that, when recognized by taste and olfactory receptors, provide a wide range of flavor sensations (Dias et al. 2023).
Although these fruits may be eaten fresh, preserving them in processed goods like jellies, jams, and cakes extends their shelf-life and enables year-round enjoyment. However, making jam has a number of obstacles, one of which is preserving the healthy components in the fresh fruit while preventing spoiling. Heat treatment duration, component identity and quantity, and fruit pre-treatment are all suitable preparation stages to optimize. Heat treatment, as well as the addition of sugar and citric acid, can all affect jam quality and final flavone and anthocyanin concentrations (Barraza-Jáuregui et al. 2017).
Osmotic dehydration (OD) pre-treatment is a method that involves immersing items in an aqueous solution containing salt or sugar. It is commonly used on fruits and vegetables (Alabi et al. 2022). By lowering water activity in the fruit, this approach may preserve the quality of the fruit that is later used in jam production. The difference in solute concentration between the solution and the interstitial fluid drives the process, causing water to depart and solutes to enter the cells until osmotic equilibrium is reached (Ahmed et al. 2016; Barraza-Jáuregui et al. 2017).
According to research, prior to jam manufacture, osmotic dehydration pre-treatment of strawberries with sucrose stabilizes anthocyanin better than just adding sucrose during jam preparation (Watanabe et al. 2011). The main anthocyanins involved in blueberry color are delphinidin and cyanidin 3-glucoside and to a lesser extent malvidin, petunidin, and peonidin. However, the variety, maturity, storage conditions, and other components of the blueberry affect these anthocyanins and phenolic compounds (Barraza-Jáuregui et al. 2017). Sugars’ impacts, including not just monosaccharides but also oligo and polysaccharides, in the manufacture of jam on the anthocyanin content have been studied (Skrede et al. 2008). However, the solute’s identity and concentration (often sucrose), immersion time, temperature, pressure, raw food structure, food-to-solution ratio, permeability, size, and shape of the fruit, all have an effect on the osmotic dehydration process (Barraza-Jáuregui et al. 2017).
This study aimed to optimize, through the use of artificial neural networks, the sucrose concentration and the osmotic pre-treatment time of blueberries of the Biloxi variety, to retain the greatest amount of anthocyanins and total phenolic components for the subsequent preparation of jam.
MATERIALS AND METHODS
Raw material
Blueberry fruits (Vaccinium corymbosum L.) Biloxi variety, from the district of Virú, province of Virú, department of La Libertad, Peru. The content of soluble solids (13.49±0.10%), titratable acidity (0.49±0.09%), and pH (3.47±0.12) were evaluated. Fruits were picked at commercial ripeness and chilled before being sent to the National University of Trujillo’s Department of Agro-industrial Engineering. The blueberry fruits were received verifying their good condition, such as intense blue color, spherical shape with an approximate diameter of 20±2 mm, and firmness to the touch; and that they have not presented the development of microorganisms. The Fruit was kept in 1,000 kg clamshell packaging in the dark at 3.0±0.5 °C and 94±3% RH (Barraza-Jáuregui et al. 2017).
Jam preparation
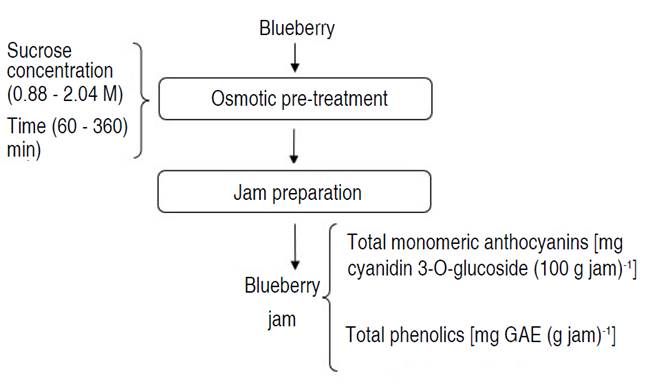
Blueberry fruits were washed using drinking water with sodium hypochlorite at 50 ppm, to remove foreign particles and reduce the microbial load, subsequently, the fruits were cut in half. To create a data matrix input for the ANN that is statistically well distributed, a rotational composite central design was applied, consisting of twelve experimental units (Vidra and Németh 2022). The osmotic pre-treatment (Figure 1) was carried out with concentrations of sucrose solution (between 0.88-2.04 M) and immersion times (between 60-360 min), with a ratio of fruit: syrup of 1:10 (w/w), maintaining constant agitation (vertical stirrer IKA® EUROSTAR 20 Digital, Königswinter, Germany) at 48 rpm (at 20 °C), subsequently the dehydrated blueberry fruits were removed from the osmotic solution, for which were placed in a strainer for a time of 10 min, to eliminate the excess of solution (Barraza-Jáuregui et al. 2017; Watanabe et al. 2011; Rahman et al. 2022). For the preparation of the jam, the proportion used of dehydrated blueberries was 60% and sucrose 40%, the cooking was carried out by initially adding 10% of the amount of sucrose calculated, later when this came to 50 °Brix the rest of the sucrose when the jam came to 62 °Brix, it was removed from cooking and finally brought to 64 °Brix. The filling in cylindrical glass jars (220 mL capacity, transparent, 74.6 mm wide, 67 mm high and 70 mm twist-off metal cap) was done hot at a temperature not lower than 85 °C (this temperature improved the fluidity of the product during filling and at the same time allowed the formation of an adequate vacuum inside the container), hermetically sealed jars and chilled to 20 °C for at least 1.5 h to achieve thermal shock, that guarantees the safety of the product. Before being employed in the study, samples were maintained in total darkness at 5 °C for at least 24 h (Lu-Lu et al. 2016; Shinwari and Rao 2018).
Total monomeric anthocyanins
To 10 g homogenized jam was treated with acidified ethanol (0.01 M HCl solution in ethanol; 40 mL). The extract was chilled overnight before being filtered the next day through S&S 520 (Schleicher and Schuell - Whatman filter paper grade 520, Maidstone, United Kingdom) (Wicklunda et al. 2005; Barraza-Jáuregui et al. 2017). The total monomeric anthocyanins (TA) in the extracts were calculated using the pH-differential technique (Lee et al. 2005), using hydrochloric acid/potassium chloride buffer (0.025 M, pH=1.0) and sodium acetate buffer (0.4 M, pH=4.5) as the buffers. In brief, 0.2 mL of the filtrate was mixed with 1.8 mL of one of the buffer solutions, and absorbance was measured on a UV-VIS spectrophotometer at 510 and 700 nm
(GENESYSTM 10, THERMO, USA). The anthocyanin content in the extract was determined and represented as cyanidin-3-O-glucoside equivalent per 100 g of jam using Equation 1 (Giusti and Wrolstad 2001).
Where: A= (A510-A700)pH=1.0 - (A510-A700)pH=4.5; Mw= molecular weight (449.2 g mol-1); DF= dilution factor (50); Ma = extinction coefficient 26,900 L cm-1 mol-1; L= path length (1 cm).
Total phenolics
In a flask, homogenized jam was diluted with ethanol (2 g jam 10 mL-1 solution). The extract was chilled overnight before being filtered (S&S 520) the next day. The Folin-Ciocalteu test was used to evaluate the phenolic component content (Çetin and Sağlam 2022). Briefly, 20 μL of diluted extract was combined with 100 μL of Folin-Ciocalteu reagent and 1,580 μL of distilled water.
The mixtures were vortexed (Thermo ScientificTM A LP Vortex Mixer, FBKT17302, Darmstadt, Germany), held in the dark at room temperature for 20 min, and then transferred into a 40 °C water bath with 300 μL addition of 20% sodium carbonate (w/v) for another 20 min. The samples were promptly chilled in an ice bath for 3 min, and the A765 was quantified using a UV-VIS spectrophotometer (UV-VIS GENESYSTM 10, THERMO, USA). A calibration curve was created using gallic acid as the standard (Absor=3.3167xQ + 0.0044; R2=0.9936; Absor: absorbance; Q: amount of gallic acid) was armed with 0.05, 0.10, 0.15, 0.20, 0.25, 0.30, 0.35, 0.40, 0.45 and 0.50 mg mL-1 gallic acid solutions, and the findings were reported as gallic acid equivalents (mg GAE g-1 jam) (Barraza-Jáuregui et al. 2017; Piljac-Zegarac et al. 2009).
Data processing
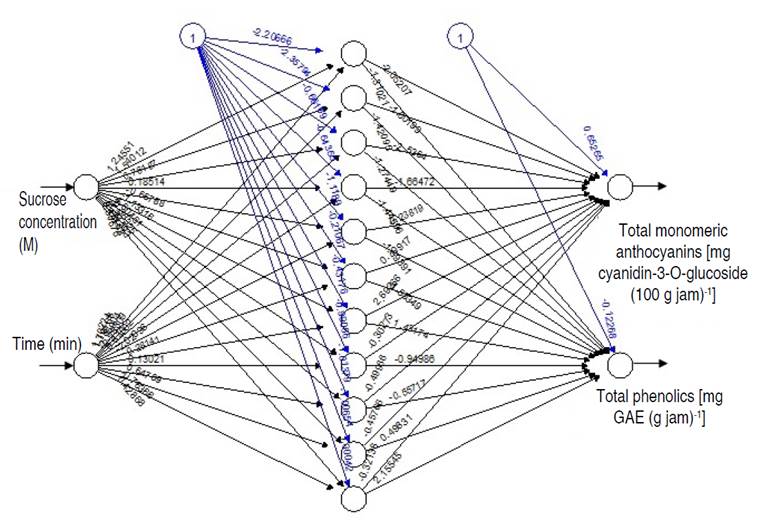
MLP-type ANN was employed in this investigation to estimate anthocyanins and total phenolics (Çetin and Sağlam 2022). In the first instance, the input and output data were normalized (center=min, scale=max-min) (Costa et al. 2022; Yu et al. 2022; Vidra and Németh 2022). The number of inputs was taken as two, the number of neurons in the hidden layer as 11, and the number of outputs as two. The logistic activation function was used in the hidden layer and the linear function in the output layer. Backpropagation was used with Levenberg-Marquardt adjustment, in addition to the learning ratio of 0.01 and threshold of 0.01. The training data was given in supervised learning as a sequence of labeled outputs, each of which was a feature collection set (tagged with the correct output corresponding to the feature set) (Chhajer et al. 2022; Rodríguez-Hernández et al. 2021). The coefficient of determination R2 (maximization) and the mean square error MSE (minimization) were used to evaluate model performance (Yu et al. 2022; Vidra and Németh 2022; Soumyabrata et al. 2022). For data processing, the R version 4.2.1 software was used, with the libraries: "rsm", "MASS", "neuralnet", "ggplot2" and "colorRamps".
RESULTS AND DISCUSSION
ANN were trained in 1,000 cycles with the Brackpropagation algorithm, where the highest performance of the model was achieved with 11 neurons in the hidden layer (Figure 2), having a coefficient of determination R2 of 0.988 and a mean square error of 4.760, presenting a good capacity for generalization. Çetin and Sağlam (2022) determined the performance of ANN presenting R2 value of 0.916 in the modeling of total phenols in dehydrated apples. ANN is the most effective dataset modeling approach. It is used for data fitting and prediction, which have a non-linear connection. It is a self-organizing map and a multi-layer perceptron (Chhajer et al. 2022).

Figure 2 Artificial neural networks in the retention of anthocyanins and total phenolics in the osmotic pre-treatment of Biloxi variety blueberry jam.
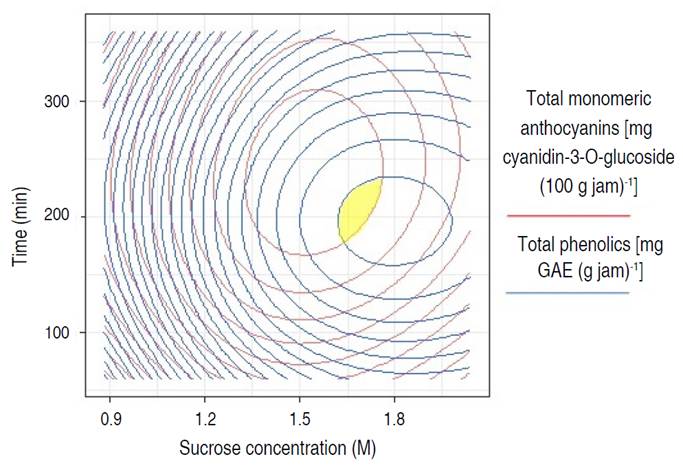
Before the osmotic pre-treatment, the content of total monomeric anthocyanins and total phenolic compounds were 104.47±3.89 mg cyanidin-3-O-glucoside 100 g-1 and 161.04±23.24 mg GAE g-1 in variety Biloxi blueberry fresh, respectively. After osmotic pre-treatment and the preparation of the jam, ANN allowed to obtain (Table 1) the best optimal combination predicted multiple-response (Figure 3) of factors made up of a sucrose concentration of 1.64 M and a time of 211.52 min, which retained a higher content of total monomeric anthocyanins with 70.98 mg cyanidin-3-O-glucoside 100 g-1 of jam (confidence interval at 95% between 70.88 and 71.08 mg cyanidin-3-O-glucoside 100 g-1 of jam) and total phenolics with 110.54 mg GAE g-1 of jam (95% confidence interval between 110.40 and 110.68 mg GAE g-1 of jam), similar trends were observed by Barraza-Jáuregui et al. (2017), where the greatest phenolic and anthocyanin contents were determined to produce blueberry jam pretreatment conditions of 1.65 M and 242 min and strawberry jam pre-treatment conditions of 1.46 M and 219 min. Osmotic treatments for impregnation with sucrose in solution, before making the jam, at concentrations of 0.29 to 2.34 M, for 5 to 60 min, are effective for the efficacy of anthocyanins (Watanabe et al. 2011).
Table 1 Multiple-response and single-response values for optimization through artificial neural networks in the retention of anthocyanins and total phenolics in the osmotic pre-treatment of Biloxi variety blueberry jam.


Figure 3 Contour overlap for multiple-response optimization in the retention of anthocyanins in the osmotic pre-treatment of Biloxi variety blueberry jam.
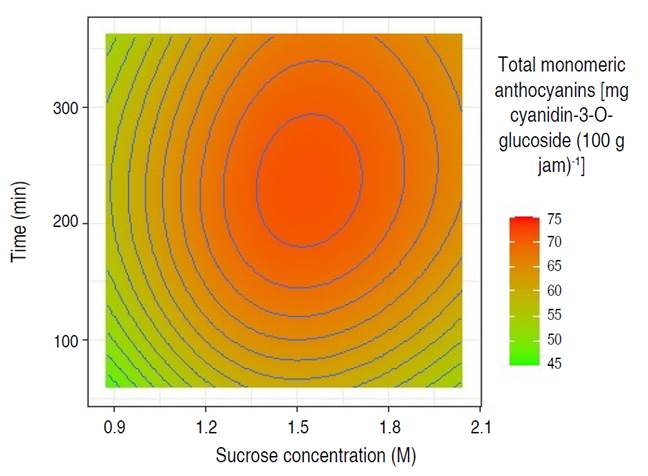
Regarding the single-response optimization for total monomeric anthocyanins (Table 1 and Figure 4) the combination of factors of sucrose concentration of 1.54 M and time of 232.73 min allowed to retain 71.59 mg cyanidin-3-O-glucoside 100 g-1 of jam (confidence interval at 95% between 71.50 and 71.69 mg cyanidin-3-O-glucoside 100 g-1 of jam ); and for total phenolics (Table 1 and Figure 5) the combination of sucrose concentration of 1.79 M and time of 196.36 min allowed the retention of 111.06 mg GAE g-1 of jam (95% confidence interval between 110.92 and 111.20 mg GAE g-1 of jam). It should be noted that the retention of anthocyanins and phenolic compounds was low when the sucrose concentration and immersion time moved away from the optimization zone (maximization of retention), either towards a lower or higher value of the levels of work factors. Barraza-Jáuregui et al. (2017) reported a similar tendency, with an island of high phenolic component or anthocyanin content surrounded by lower expected quantities; lengthy times and/or high sucrose concentrations, as well as short periods and/or low osmotic concentrations, may lower the concentration of phenolic chemicals and anthocyanins in the jam. Because anthocyanins are water-soluble pigments found in most fruits, sugars suppress water activity and protect the flavylium cation from nucleophilic attack at the C-2 position by water, resulting in colorless carbinol base. At low quantities; however, sugar breakdown products (furfurals) from processes such as the Maillard reaction promote anthocyanin destruction (Shinwari and Rao 2018). Osmotic dehydration inhibits water activity in fruit, which has been shown to preserve phenolic components and anthocyanins during jam production (Watanabe et al. 2011). Furthermore, reduced water activity may impede enzymes that hydrolyze pigments, such as polyphenol oxidase and b-glucosidase. Sucrose may also act as a steric inhibitor, blocking anthocyanin-ascorbate or anthocyanin-phenolic condensation. Furthermore, due to colligative effects, the oxygen solubility of high osmotic solutions is limited, providing a partial oxygen barrier that can shield the pigments from oxidation (Barraza-Jáuregui et al. 2017; Wrolstad et al. 2005). Significant losses occur when they are kept and transported in unsuitable settings. Preservation techniques such as drying, freezing, pickling, sugaring, and salting may provide a considerable answer to these challenges (Çetin and Sağlam 2022; Shinwari and Rao 2018). During osmotic dehydration, the concentration of the osmotic agent is an important factor in mass transfer kinetics (Shukla et al. 2018). Low sugar concentrations result in little water loss and solid gain ratios (Figures 4 and 5, low sucrose concentrations) (Cichowska et al. 2019). As osmolarity rises, so does water loss and hypertonic solution absorption. However, as concentration increases, water loss becomes less efficient. Due to case hardening and viscosity fluctuations, fruit cell membranes and pericarp are projected to become less permeable in severely hypertonic solutions, lowering penetration (Figures 4 and 5, high concentrations) (Ahmed et al. 2016; Winkler et al. 2019; Brüggenwirth and Knoche 2016). Furthermore, prolonged exposure to the osmotic pre-treatment conditions may cause anthocyanin and other chemicals in the hypertonic solution to leach (Barraza-Jáuregui et al. 2017) (Figures 4 and 5, longer time points).

Figure 4 Contours surface in the retention of anthocyanins in the osmotic pre-treatment of Biloxi variety blueberry jam.
CONCLUSION
The artificial neural networks allowed to obtain the optimal combination of multiple-response factors consisting of a sucrose concentration of 1.64 M and a time of 211.52 min, which maximized the content of total monomeric anthocyanins and total phenols; corresponding concentrations of 70.98 mg cyanidin-3-O-glucoside 100 g-1 of jam and 110.54 mg AGE g-1 of jam, respectively. From the perspective of simple-response optimization for total monomeric anthocyanins, the combination of experimental factors was sucrose concentration of 1.54 M and time of 232.73 min, allowed to retain 71.59 mg cyanidin-3-O-glucoside 100 g-1 of jam. For total phenols, the combination of experimental factors was a sucrose concentration of 1.79 M and time of 196.36 min, which corresponded to total phenolic retention of 111.06 mg of AGE g-1 of jam. The use of artificial neural networks is an excellent alternative to model phenomena, compared to traditional methods.


