Introduction
Studies on the phytoplankton of the Ciénaga Grande de Santa Marta (CGSM) lagoon (Figure 1) conducted in 1987 and 1995 (Vidal, 1995, 1997, respectively), found that Actinocyclus normanii was the second most abundant species in the lagoon, both for its density and frequency. According to different authors, A. normanii has bigger cells and inhabits estuaries with greater marine influence (Hustedt, 1930; Sinkeldam, 1983; Krammer & Lange-Bertalot, 1991; Rehbehn, et al., 1993; Sims, 1996; Soler, et al ., 2003; Hermany, et al ., 2013). In contrast, A. normanii fo. subsalsa is smaller and inhabits estuarine environments with greater influence of freshwater (Hustedt, 1930; Holland & Claflin, 1975; Hasle, 1977; Sinkeldam, 1983; Gómez, 1991; Krammer & Lange-Bertalot, 1991; Stoermer, et al ., 1992; Bradbury & Krebs, 1995; Sims, 1996; Liukkonen, et al. , 1997; Medvedeva, et al ., 2009; Rebekah, 2010; Hermany, et al ., 2013; Witak, 2013; Anne, et al ., 2015; Vidakovic, et al ., 2016). These field observations were followed by laboratory testing to examine the influence of several physical and chemical variables on A. normanii (Vidal & Galán, 1999).
In our study we make a case to demonstrate that variations in cell diameters of A. normanii (and, therefore, of the forms or varieties subsalsa and normanii), are dependent of salinity changes within the system, arguing that these forms or varieties are simply the result of natural changes in A. normanii caused by variations of salinity in the system. We then concluded that cell diameter variations of A. normanii are dependent on salinity and, thus it can be used as a proxy for salinity in the interpretation of paleoenvironments. This is the first time that the diameter of a centric diatom is used as a proxy for the reconstruction of past salinity and, therefore, the reconstruction of paleoenvironments. We pro-posed that when small cells of A. normanii have prevailed over large cells, fresher water conditions predominated in the system and that when larger cells were more numerous than smaller ones, salinity was higher, i.e., the marine influence was stronger over the system.
Study area
The Ciénaga Grande de Santa Marta (CGSM) (Figure 1) is a lagoon located at 74º 16´, 74º 29´ W and 10º 44´, 10º 57´ N on the Caribbean Coast of Colombia. The lagoon is wider to the north, with an extension of 450 km2, and has an average depth of 1.7 m; it is part of the delta of the Magdalena River, the most important river in Colombia. The CGSM is separated by the ocean through a sand barrier, isla de Salamanca, with a 200-300 m opening on the east side that allows communication with the open ocean. The water depth at this site is 7-10 m. To the east, the lagoon is bounded by the floodplain of three main rivers that feed it and that originate in the Sierra Nevada de Santa Marta (SNSM). The SNSM is a 5000 m mountain with permanent ice caps. The three rivers are, from north to south, Sevilla (also known as río Frío, closer to the sand barrier), Aracataca and Fundación; these rivers reach the lagoon after crossing banana plantations. Together, these rivers contribute to with approximately 56 m3 s-1 of freshwater. To the west, the lagoon is bound by a marsh complex, called Complejo Pajarales. Through the Complejo Pajarales and the Caño Clarín channel, the lagoon receives almost 163 m3 s-1 of freshwater from the Magdalena River. The bottom of the lagoon is muddy, except for some sandy bottoms to the north. Mangrove forests grow around the lagoon; it is affected by a dry season, from February to May, characterized by the dominance of the Trade Winds, and a rainy season, from September to December, characterized by intense precipitation. Between these, there are two periods: one from June to August, with relatively low precipitation, known locally as Veranillo de San Juan, while the second one, from January to February, is a sort of transitional period between the rainy and dry seasons. The difference between the high and low tide in the lagoon is around 30 cm and the circulation is counter clockwise. Salinity ranges from 0 to 35 PSU in tandem with seasonal precipitation: during the dry season salinity is at its peak due to the greater influence of the ocean whereas during the rainy season salinity decreases even to 0. The Secci depth is 30 cm, but it has been recorded even at 70 cm. Solar insulation on the region (> 1700 μE m-2 s-1) is the most intense in the entire country. Temperature ranges between 26 and 33 ºC with the highest ones occurring during the dry season. The population around the lagoon is clustered in five towns (Tasajera, Palmira, Isla Rosario, Pueblo Viejo y Trojas de Cataca), located mainly in the northeast and east of the lagoon, whose main economic activity is fishing (Vidal, 2010).
Materials and methods
Actinocyclus normanii (Gregory ex Greville) Hustedt 1957 ex Van Landingham, is a centric diatom that resembles a drum. Its frustule, in valve view, has a diameter of 8 to 90 μm and in connective view, a height of 18 to 32 μm. The valve face is generally flat, although sometimes it can be slightly convex or concave in the centre. A ring of rimoportulae is present on the mantle; these do not project to the exterior in a tube but seem like little holes around the mantle. Areolae (8-10/10 µm) have a hexagonal shape and are of poroid type (cribra outside and foramen into). Areolae form striae and striae form sectors. Usually, in the distant part of the sector there is one rimoportula. The valve is without a central rosette. In the intersection valve-mantle there is a pseudonodule, only observable under the Scannig Electron Microscope (SEM) (Vidal, 2010, partim). For a wider description of the species see Kiss, et al . (2012). A. normanii is classified in the Class Coscinodiscophyceae, Subclass Coscinodiscophycidae, Order Coscinodiscales, Family Hemidiscaceae (Round, et al., 1990). A. normanii is cosmopolitan inhabiting mainly on the mouth of rivers and estuaries from the equator to the poles (Supplementary information, annex 1, https://www.raccefyn.co/index.php/raccefyn/article/downloadSuppFile/713/3145).
Two field studies were carried out in the 1980s and 1990s. In the first study (Vidal, 1995) five stations were sampled on a bi-weekly basis. One station was located at the opening of the sand barrier, two close to the marsh complex on the west, one in the center of the lagoon, and another one in front of the mouth or Sevilla River (Figure 1). In the second study (Vidal, 1997), an additional sixth station close to the mouth of Fundación River was included and monitored bi-weekly as well (Figure 1). In the first study, carried out between February and December 1987, water samples were collected in a 1.8 m-long tube with a 12 cm diameter, which reached almost to the bottom of the lagoon (2 m). The tube was shaken to homogenize the sample and 1 liter was extracted for analysis. In the second study, carried out between March 1995 and February 1996, water samples were collected using a 1 L-Ruttner bottle. Samples were taken at 30 cm from the water surface and at 30 cm from the bottom. During the two studies, the density of auxospores was calculated (unpublished data) (Figure 2; Table 1).
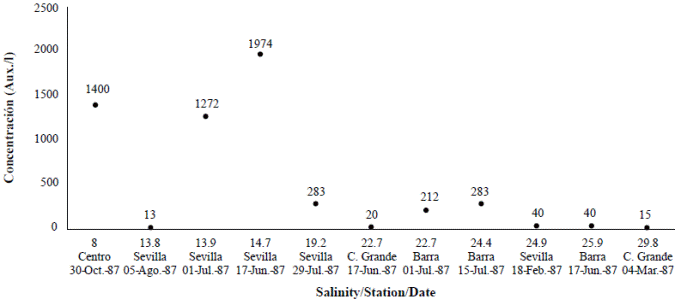
Figure 2 Auxospores formation (Aux/l) according to variation in salinity at different stations: Sevilla, Barra, Centro and Caño Grande in Ciénaga Grande de Santa Marta, 1987. Under 8 PSU, no auxospores were found.
Table 1 Concentration of auxospores of Actinocyclus normanii in different stations in CGSM. The collection dates are shown, the salinity measured in the station and the collection location, either in the water column or in the background.

Bioassays with A. normanii were carried out in the laboratory (Vidal & Galán, 1999) at salinities of 2.7, 10 and 20 PSU on culture medium (Guillard L1) and under constant conditions of temperature (22-24° C), light (30.97 μEins m-2 s-1) and aeration. The culture medium was prepared with water from the lagoon filtered through a Whatman® GF/C microfiber glass filter. Salinity gradients were prepared from filtered seawater (UV filter system) diluted with water from the lagoon sampling station. The salinity of the sample taken in front of the mouth of Sevilla River was 2.7 PSU; the maximum concentrations of A. normanii during the year of study were at 10 PSU (Figure 3); a moderately high salinity value within the range observed for the lagoon was 20 PSU.
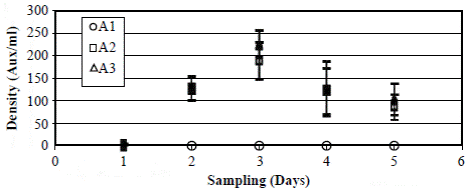
Figure 3 Generation of auxospores of Actinocyclus normanii (Aux/ml) at three concentrations of salinity: A1 = 2.7 PSU; A2 = 10 PSU; A3 = 20 PSU. The vertical bars correspond to the value of the standard error. The values (aux/ml) of the treatments A2 at 10 PSU (squares) and A3 at 20 PSU (triangles) during the days two and four are almost equal.
In the second part of this work, we measured A. normanii cell diameters from 15 permanent plates prepared for a diatom count as part of a published paleoenvironmental reconstruction for the CGSM lagoon (Vélez, et al ., 2014). Each of these plates contained two aliquots of 0.6 ml prepared from specific depths within a sedimentary core extracted in the lagoon (Figure 1). The drilling site for the core was at the mouth of Sevilla River (also known as río Frío), on the eastern side of the lagoon. The code of the 15 samples indicates the core name (Bocas López-BL) followed by the core depth in cm: BL05, BL15, BL35, BL55, BL95, BL115, BL125, BL135, BL154, BL165, BL175, BL195, BL205, BL245, BL265. The age of the samples was recalculated from those presented in Vélez, et al. (2014). For the present study, 14C dates were calibrated using the Bacon software (Blaauw & Christiansen, 2011). For observing and measuring the diameters of the valves, we used a Zeiss® Primo Star microscope coupled with a computer and equipped with the ZEN microscope software for light microscopy system Zeiss®. The core interval selected (5 to 265 cm) represents approximately the last 2,300 years before present (BP).
We measured the diameters of 300 A. normanii valves in each plate: 150 in one of the aliquots and 150 in the other one. If the valve was broken, but it had at least an edge and the center, it was counted; in these cases, the radius was measured and multiplied by two. With this data we constructed a 15-column matrix where each column corresponded to a sample (in the core) with 300 measurements of diameters, which were organized from the lowest to the highest value, while the samples were placed by seniority from left to right. Diameter values were given with a tenth of precision and the units were expressed in microns (μm). We counted the diameters below ≤40 μm and above ˃40 μm (Table 2). We made linear regression curves with the average of the diameters of each sample ordered from low to high and the number of cells whose diameters were under or above 40 µm (Figure 4). In our hypothesis, diameters with an average of < 40 μm indicate a predominance of freshwater, whereas averages of ˃ 40 μm diameters indicate a predominance of marine water.
Table 2 Summary matrix of the measurement of the diameter of 300 cells of Actinocyclus normanii in each sample. The averages of the diameters, the number of cells ≤ 40 μm and the number of cells ˃40 μm are noted.

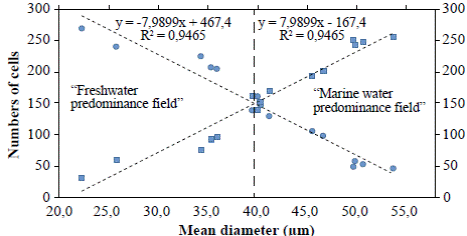
Figure 4 Lineal regression curves of mean diameters of A. normanii of each sample, ordered from low to high and counting the number of cells whose diameters were under or above 40 µm. The curve with the negative slope (circles) corresponds to small cells (≤ 40 μm) and the curve with the positive slope (squares) corresponds to large cells (> 40 μm). The 40 μm average diameter to the left is called “freshwater predominance field” and the 40 μm average diameter to the right is called “marine water predominance field”. In the upper part, the equations of the regression curves with their R2 are shown.
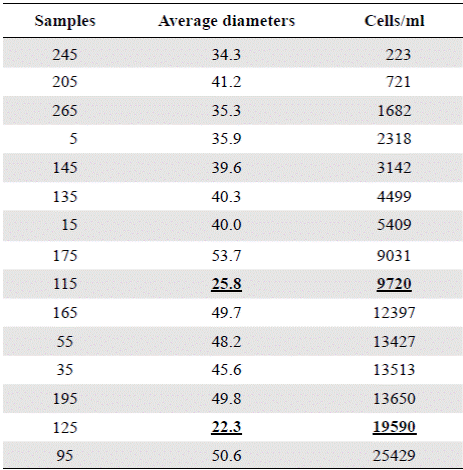
For the sedimentation rates of A. normanii in the different samples, we estimated cell concentrations according to the following equation: Cells/ml = N/surface counted field (ml), where N corresponds to the number of cells counted. The concentrations of the different samples are shown in Table 3. The values of samples BL125 and BL115 were not considered because they were atypical (Table 3).
Table 3 Concentrations of Actinocyclus normanii (cell / ml), in the different samples and their corresponding average diameters. The underlined data (25.8 and 22.3) correspond to apparently nonconsecutive data within the table.
To evaluate the real differences between measured diameters, the following analyses were made: assumption of randomness of the residues (Durbin Watson test), homogeneity of variance (Bartlett’s test) and normality of the ANOVA residues (Shapiro-Wilks test: SW). The assumptions of normality and homogeneity were not met, so all statistical analyses were based on non-parametric tests. The Kruskal-Wallis (K-W) non-parametric variance analysis was used to find differences in the variable defined as “diameter of A. normanii”. The analysis of the power of the test and the required sample size to evaluate whether 300 data per column were enough, was made through the notation function (Cohen, 1988). To determine the 40 μm value in the matrix, i.e., to find the best possible partition of the groups of diameters in the measured cells, a K-Medias analysis was carried out (Guisande, et al ., 2011). The statistical program R version 2.3.2 (R Development Core Team 2016, available at www.r-project.org) was used for all the analyses. The results of the ANOVA analysis of variance are shown in Figure 4.
Reconstructions of the Late Holocene marine transgression were obtained from Vélez, et al . (2014), Wiedemann (1973), and Van der Hammen & Noldus, (1984). In addition, a study about the migration of the intertropical convergence zone (ITCZ) (Haug, et al ., 2001), was used to reconstruct changes in precipitation.
Results
Field observations showed that during the rainy season, when freshwater enters the lagoon decreasing salinity, A. normanii splits profusely through the mechanism of asexual reproduction generating a large number of cells (Figure 5). During the dry season, when the Trade Winds blow from the NE and marine water enters into the lagoon increasing salinity, A. normanii reproduces sexually, auxospores form (Figure 2), and cells reach their maximum size. Then, in the cell divisions that follow, large cells start to decrease in size and the cycle starts again.
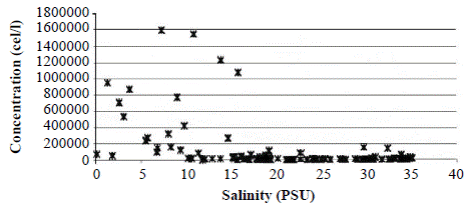
Figure 5 Concentration of Actinocyclus normanii (cell/l) according to salinity variations in CGSM during 1987
We calculated the density of auxospores (unpublished data) (Figure 2; Table 1) and we observed that in February, during the dry season, when the Trade Winds still dominate and salinity is higher, there were 40 auxospores per liter. The lowest value of salinity at which auxospores formed was 8 PSU. Since the sample collected in the tube contained several water depths (the total water column was 1.8 m), the exact depth at which auxospores formed within the water column could not be established. The second study conducted in 1996 (Vidal, 1997) showed that auxospores were abundant at the bottom of the lagoon (unpublished data) (Table 1).
Bioassays with A. normanii´s auxospores carried out in the laboratory (Vidal & Galán, 1999) showed that at 2.7 PSU salinities auxospores did not form as they started to form at 10 PSU (61 ± 14.4 auxospores ml-1 day-1) and had an optimal formation at 20 PSU (75 ± 9.7 auxospores ml-1 day-1) (Figure 3).
The regression analyses (Figure 4) indicated that valves under ≤ 40 μm (curve with circles) had a negative correlation with the number of cells: their number increased as their diameter decreases; conversely, the number of large cells above > 40 μm (curve with squares) decreased as their diameter decreased. Additionally, in the “freshwater predominance field”, from a 40 μm average diameter downwards (to the left), the small cells of A. normanii were more numerous than the large cells. Similarly, in the “marine water predominance field”, from a 40 μm average diameter upwards (to the right), large A. normanii cells were more numerous than small cells.
Figure 6 shows a general oscillatory tendency of cell diameters medians and averages in the samples. The bottom samples BL265 and BL245 (the oldest ones) were similar (Table 4) and fell below the line of 40 μm, i.e., they were located in the predominance of freshwater conditions. These samples are dated between 2,292- and 2,160-years BP. The next four samples, BL205, BL195, BL175, BL165, dated from 1,870 to 1,345 years BP, were statistically different (Table 4), and fell above the line of 40 μm, therefore, they were located in the predominance of marine water conditions. The average diameters of the following upper samples BL145 and BL135, dated between 1,058- and 912-years BP, were 39.5 μm and 40.3 μm, respectively, close to the line of division. The average diameters of these samples were statistically similar (Table 4). The following upper samples, BL125 and BL115, dated between 770- and 625-years BP, had the lowest and similar average diameters, 22.3 and 25.8 μm, respectively (Table 4) and were located in the predominance of freshwater conditions (lower marine influence). In the following interval, the average diameter values of BL95, BL55, and BL35 were similar (50.6, 46.6, 45.6) (Table 4) and fell in the predominance of the marine water conditions (marine transgression). These samples are dated older than 500 years BP (after 1550 AD). Finally, the uppermost samples BL15 and BL05 were different from each other (Table 4) and fell into the transition and fresher water predominance, respectively.
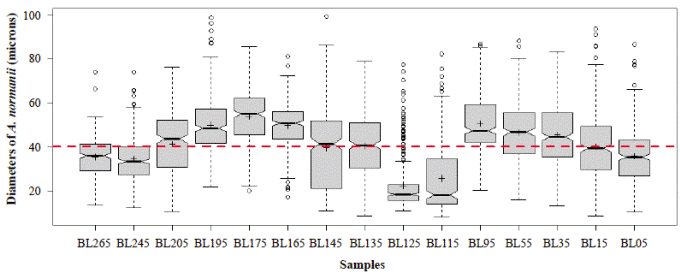
Figure 6 Mean diameters of the 300 cells or cell segments of A. normanii measured in the 15 samples (BL265 to BL05, codes of the 15 samples evaluated). The red line represents the boundary between large and small cells (40 μm). The boxes represent the interquartile range of the data and are divided by the value of the median (solid line) and the average (crossings) of the variable; the bounded lines correspond to the standard errors. Above the red line is the saline domain (marine influence) and below the red line is the fresher water domain (influence of freshwater).
Discussion
The variation of the diameter of the cells of A. normanii in function of a salinity gradient is inherent to the life cycle of the species. It is through these gradients, sexual reproduction, and the formation of the auxospores that A. normanii increases its size 3 to 6 times (gametes transformed from small cells) in a few hours. That is to say that small and large cells are a product of the alternation between asexual and sexual reproduction. In this paper, we did not use the concepts of forms and varieties subsalsa and normanii for small and large cells. Instead, we centered the discussion regarding small and larger sizes as part of the same life cycle of A. normanii as reflected in the life cycle of centric diatoms (Round, et al ., 1990) in which large diatoms decrease in size until the formation of the gametes. After this, gametes fuse and auxospores are formed giving place to large cells, which decrease in size, closing again to complete the full cycle. In the light of the SEM, Hasle (1977) did not differentiate between the morphotypes. Kiss, et al ., (1990) suggest that the forms of this species do not have taxonomic value and that they should not be considered as separated taxa. The fact that auxospores were abundant at the bottom of the lagoon (Vidal, unpublished data) (Table 1) suggests that these migrate through the water column and accumulate at the bottom. It is possible that this journey along the water column facilitates the collection of nutrients (Smetacek, 1985; Finkel, et al ., 2005).
The formation of auxospores has been also observed in the lab for Coscinodiscus granii Gough when salinity increased to 900 and 950 mOsmol (ca.28-30 PSU) (Schmid, 1994), as well as for C. wailesii Gran & Angst, Odonterlla regia (Schultze) Simonsen, O. sinensis (Greville) Grunow, Cyclotella meneghiniana Kützing, and C. cryptica Reimann (Schultz & Trainor, 1968, 1970). For the first four species, it seems that the key factor for the formation of the auxospore is related to the light intensity and the specific salt ions, possibly Na+ (Schmid, 1994). For the last two species, sexual reproduction seems to be related with the increase in the concentration of Na+ (Schultz & Trainor, 1968, 1970) and would indicate that salinity is a key variable in the formation of the auxospores of several centric brackish diatom species.
Samples BL265 and BL 245 had diameters under 40 µm (Figure 6) which indicates fresh water conditions. Cohen & Wiedemann (1973) found remains of the marine indicator Rhizophora mangle 2 km north of the coring site (Vélez, et al ., 2014) at a 200 cm depth. At this depth and at 4 km south of the coring site, Cohen & Wiedemann (1973) found Laguncularia recemosa and the fern Acrosticum aureum, both indicators of freshwater conditions. North and south of the present study coring site, Wiedemann (1973) dated the 200 cm sample depth from a core extracted very close to the point reported by Cohen & Widemann (1973), at 14C, 2300 ± 65 años BP and 1920 ± 65 años BP, respectively. These prior works indicate that samples BL265 and BL245 were not exposed to marine conditions.
In Cienaga Caimanera (Sucre, Colombia) on the Colombian Caribbean coast, southwest of the CGSM, a palynological record shows that by 2,100 years BP freshwater vegetation composed by forest and other plants inhabited the flood-plains, surrounded Caimanera (Beltrán, 2015).
Actinocyclus normanii cells from BL205 to BL165 samples have diameters above the limit of 40 µm, which indicates that a transgression was already affecting the lagoon by 1,870 years BP (Van der Hammen & Noldus, 1984; Vélez, et al ., 2014). Then, a transition state has been identified from 1,058 to 912 years BP (samples BL145 and BL135) as indicated by average cell diameters of 40 μm. Transition states are probably the result of a series of rapid salinity changes.
The period from 770 BP to 625 years BP (1240 AD to 1385 AD) (samples BL125 and BL115) is difficult to interpret as these samples had the smallest cell diameters (25.8 µm and 22.3 µm, respectively), extremely high concentrations (9720 and 19590 cell/ml, respectively), and do not fit into the upward condition of the second column (Table 3). It is possible that the period from 1240 to 1385 AD (ca. 140 years) could have been punctuated by short and frequent periods of drought. Alternatively, the lagoon became isolated from the Caribbean, perhaps as a result of the formation of a sandbar that transformed the estuary into a coastal lagoon or a marsh with very sporadic inputs of freshwater and even smaller inputs of seawater. The predominance of A. normanii small cells over large ones in these samples (Table 2, Figure 4) and the high cell concentrations (Table 3) might be a sign of a limited possibility of cells to form auxospores and large cells probably as a result of a long-lasting period of very low salinity. Palynological and petrographic analyses (Wiedemann, 1973; Cohen & Wiedemann, 1973; Van der Hammen & Noldus, 1984) were used to contrast our findings. From Velez, et al. (2014), it is clear that the percentage of freshwater diatoms was low for samples BL125 and BL115 (Figure 7), but samples BL195, BL185, BL175 and BL165 with a low percentage of freshwater diatoms too, presented a high concentration of diatoms living in environments with marine water predominance (Vélez, et al ., 2014). It is possible, then, that very low salinity conditions prevailed in the CGSM between 770 BP to 625 years BP.
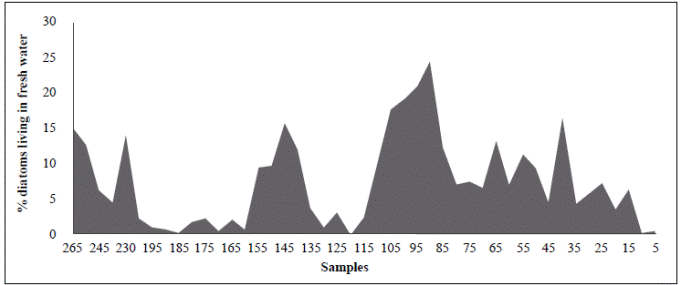
Figure 7 Percentage of diatoms that live in freshwater in different samples from BL265 (adapted from Vélez, et al ., 2014)
Samples BL95, BL55, and BL35, dated from the last 490 years BP, correspond with the “Little Ice Age” (LIA), a very cold and dry period (Van der Hammen, 1984, p. 571-572; Haug, et al ., 2001, p. 1307), and fall in the marine water predominance field. Sample BL15 is interpreted to represent a state of transition between marine and freshwater conditions and corresponds to the end of the LIA. Negative oscillations in titanium (Ti) concentrations in the Cariaco record suggest that during the LIA short dry periods prevailed (Haug, et al ., 2001). The most outstanding recent oscillations in Ti from the Cariaco record occurred in 1590 AD, 1630 AD, 1650 AD, 1700 AD, 1730 AD, and 1840 AD. This last date is close to the date of the BL15 sample (approximately 170 years BP). In 1850 (termination of the LIA) the city of Santa Marta, close to the lagoon, was flooded by an overflow of the Manzanares River that even led to a large part of the population leaving the city (Opinión Caribe journal, January 18-24, 2017, p. 12). It could be postulated that the overflow of the Manzanares River was caused by meltwater of the ice accumulated in the Sierra Nevada de Santa Marta (SNSM) during the LIA. It is expected that the rivers on the western side of the SNSM that carry their waters to the lagoon have suffered the same phenomenon of increased flow. The sample BL05 falls in the freshwater predominance field and could correspond to the 1950s (1950, 1955, 1956). In those years the water levels in the Low Magdalena River were among the highest in 30 years (between 1941 and 1970), with values of 6.27, 6.27 and 6.36 m, respectively (Kaufmann & Hevert, 1973).
The fact that small cells of A. normanii (<40 μm) are more numerous than large cells (>40 um) of the same species when freshwater conditions prevail and, similarly, that large cells of the same species are more numerous than small cells in the marine water predominance field (Figure 4) test our hypotheses.
It is interesting to note that the point of inflection between small and large cells (40 μm) corresponds to the maximum size of A. normanii var. subsalsa (Juhlin-Dannfelt) Hustedt (Hustedt, 1930), as Coscinodiscus rothii var. subsalsa), which identifies the small cells of A. normanii.
It is worth noting that the smallest diameters (ca. 8 μm) of A. normanii obtained during this study were smaller than the smaller diameters found in the articles consulted (13 μm and 16 μm) (Kiss, et al. , 2012; Krammer & Lange-Bertalot, 1991; Hasle & Syvertsen, 1996). The number of areolas per 10 μm of the smallest cells of A. normanii falls within the range reported for the species (6-8 areolas/10 μm) (Hustedt, 1930). The maximum diameters measured in this study (99.1 μm) were below the biggest value reported for the species: 110 μm (Hustedt, 1930; Krammer & Lange-Bertalot, 1991; Hasle & Syvertsen, 1996) and 113 μm, registered for the Adélie Land in the Antarctic, (Manguin, 1960).
The method described here, based on the A. normanii cells average diameter and related to salinity should be explored further and be considered as a complementary proxy for salinity.
Conclusions
Variations in the diameter of A. normanii frustules depend on the variation of salinity in the system. When the salinity in the system is falling due to the precipitation, A. normanii reproduces asexually producing small cells with diameters of ≤ 40 µm. When the salinity is rising during the dry season and exceeds a value of 8 PSU and increases up to 30 PSU, A. normanii reproduces sexually and generates auxospores and, thus, cell diameters are greater than ˃40 µm.
Fossil assemblages with A. normanii cells of ≤ 40 µm predominating over larger cells of ˃40 µm suggest the prevalence of fresher conditions. Conversely, when large cells of A. normanii are more abundant that small cells, it can be concluded that more marine conditions prevailed at that time.


