Introduction
Sea urchins play an ecologically important role in marine coastal ecosystems because of their high abundance and herbivorous feeding preference. Echinometra lucunter (Linnaeus, 1758) is often the dominant herbivore of benthic algae in shallow intertidal areas making it an excellent model to identify connectivity patterns for benthic organisms of the Atlantic Ocean.
E. lucunter is the most widely distributed species of the genus Echinometra. It has two subspecies, one in the Eastern Atlantic (Echinometra lucunter polyporaPawson, 1978) and the other in the Greater Caribbean (E. lucunter lucunter Linnaeus, 1758) which are separated from each other by 200000-250000 million years (McCartney, et al., 2000). The subspecies E. lucunter polypora was proposed by Pawson (1978) based on morphological differences found in specimens that live in the Central Atlantic islands of Ascension and St. Helena. Molecular analyses based on the CO1 gene (McCartney, et al., 2000) show that the closest approach is found between populations present in the African Atlantic, the Central Atlantic Islands (Ascension and St. Helena), and Brazil, suggesting that these populations belong to the subspecies E. lucunter polypora. The subspecies E. lucunter lucunter is present only in the Greater Caribbean.
Researchers have designed and used several types of molecular markers in the past to study genetic diversity within a species and analyse population distribution. Marker choice depends on the study, the particular species, and the questions to be answered (Sunnucks, 2000), therefore, it is necessary to use the correct molecular marker in line with the goals of the research and the available budget.
Microsatellites, or simple sequence repeats of loci (SSR), are tandem repeats of up to six nucleotides in the nuclear genome. The number of repeat units commonly ranges from around 5 to 40, with the number of repeats (and therefore sequence length) corresponding to different alleles (Selkoe & Tonnen, 2006).
As a first step to establish the genetic structure and the influence of the marine barriers to the sea urchin Echinometra lucunter lucunter throughout the Caribbean Sea, we present the design, development, and characterization of 17 microsatellite markers in the sea urchin E. lucunter.
Materials and methods
Development of microsatellites
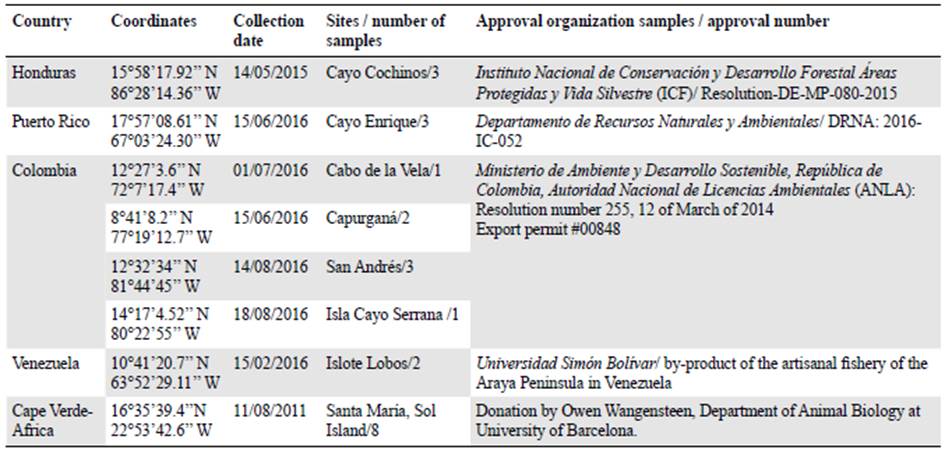
We selected eight E. lucunter lucunter individuals from three sites: Venezuela, Honduras, and Puerto Rico to develop microsatellite markers (Table 1).
Genomic DNA was extracted from tube feet using the DNeasy Blood & Tissue kit (Qiagen, Hilden, Germany) (Qiagen, 2006). The resulting DNA extractions were indexed and pooled to create a paired-end library using the Illumina Nextera® DNA Library Preparation Kit (Illumina, California, USA). Sequencing was carried out using an Illumina MiSeq platform (Illumina, California, USA) at the University of Salford, Salford, UK.
Microsatellite PCR markers were developed in-house using a previously published microsatellite design method (Fox, et al., 2019). The Griffiths, et al. (2016) workflow was used to detect microsatellites in the sequence data and design PCR primers. Multi-individual microsatellite identification (MiMi) (Fox, et al., 2019) was used subsequently as further quality control on potential markers.
To check for amplification success, we tested potential markers with the same eight DNA extractions used to design the microsatellites and extractions from additional individuals from the Colombian Caribbean Sea and the Tropical Eastern Atlantic Ocean. For the amplification steps we used the specifications of the Type-it® Microsatellite PCR kit (Qiagen, Hilden, Germany), (Qiagen, 2009) in a reaction volume of 5μl and the following thermal cycle: Step 1: 95°C/5 minutes; step 2: 28 cycles x (95°/30 seconds for denaturation, 61°C/90 seconds for annealing, and 72°C/30 seconds for elongation); step 3: 60°C/30 minutes, and step 4: hold at 4°C. We checked the final 5μl of PCR product solution on 1.8% agarose electrophoresis gel against a Hyperladder IV size standard (Bioline, London, UK) to confirm successful PCR amplification and the approximate size range of the fragments. Twenty-six SSR's were successfully visualized with these steps. To facilitate multiplexing, a universal tail PCR approach (Blacket, et al., 2012; Culley, et al., 2013) was used to add a fluorochrome to each of the markers (6FAM, TAMRA, HEX, and PET). Amplification success, thermal cycles, PCR features, and confirmation of successful gels were used as in the earlier step.
Microsatellite screening
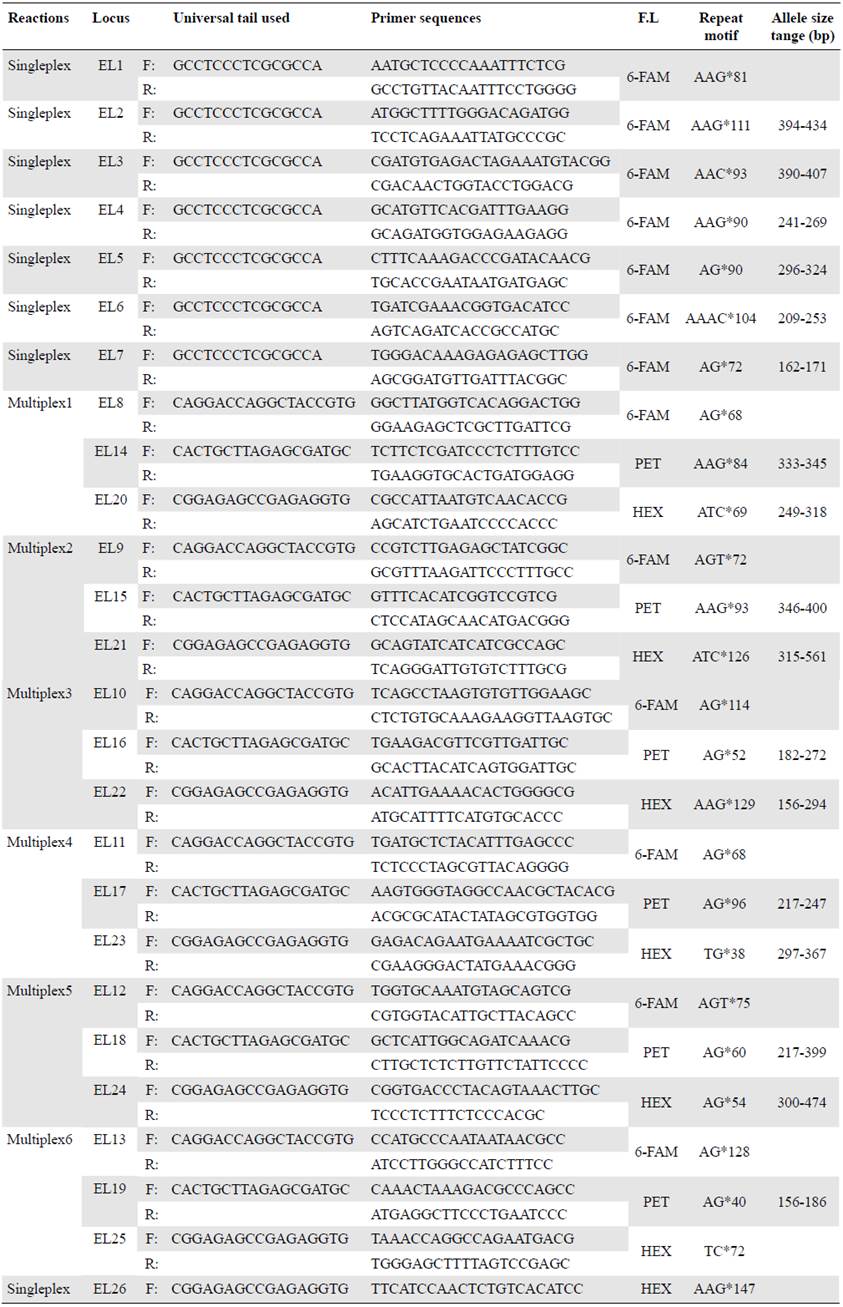
In order to assess polymorphism of SSR's, we analysed 23 DNA samples from Cape Verde (Africa) and Caribbean localities (Table 2) using six multiplex (three-four markers each) and seven singleplex reactions (Table 3) using the PCR thermal cycles described previ ously. Confirmation of amplified SSR was again through visualizing on 1.8% agarose gels. Capillary electrophoresis of PCR products was performed using an Applied Bio systems 3730 DNA Analyzer at the Genomic Technologies Facility, University of Manchester (UK). Length and allele scoring of PCR products were estimated using the GeneMapper 5 (ThermoFisher Scientific) and Peakscanner v1.0 software (Applied Biosystems). Seventeen primers showed successful amplification, variable microsatellite loci, and were successfully genotyped in all 23 samples used.
Table 2 Populations used to observe behaviour and polymorphism of microsatellites loci developed for Echinometra lucunter

Data analysis
We used the microsatellite genotypes of 23 individuals from several localities in the Caribbean and at Cape Verde (Africa) for analysis. Data were edited in Excel (Microsoft, Washington, USA) tables and converted to input files (Microsatellite Toolkit) to produce the genepop data. To detect and estimate genotyping error, data were probed using the Microchecker (Van Oosterhout, et al., 2004) software. We then tested for Hardy-Weinberg Equilibrium (HWE), calculated the number of alleles per loci (Na) and population, and observed heterozygosity (Ho) and expected heterozygocity (He) with the GenAlEx platform (http://biology.anu.edu.au/GenAlEx/Welcome.html). We estimated the Polymorphic Information Content (PIC) of each locus using the program Cervus 3.0.7 (Kalinowski, et al., 2007), and the genotypic linkage disequilibrium using GenPop (http://genepop.curtin.edu.au/). We used the Bonferroni correction method to adjust the significance levels for HWE and linkage disequilibrium tests.
Results
The Illumina MiSeq run generated 27,043,607 paired-end reads with the eight DNA samples (Honduras, Puerto Rico, and Venezuela). We obtained a further filtered list of 308 potentially amplifiable loci (PAL) with the palfilter from the Galaxy platform and we selected 26 PAL's for screening: 14 di-, 11 tri- and one tetra-nucleotide (Table 3).
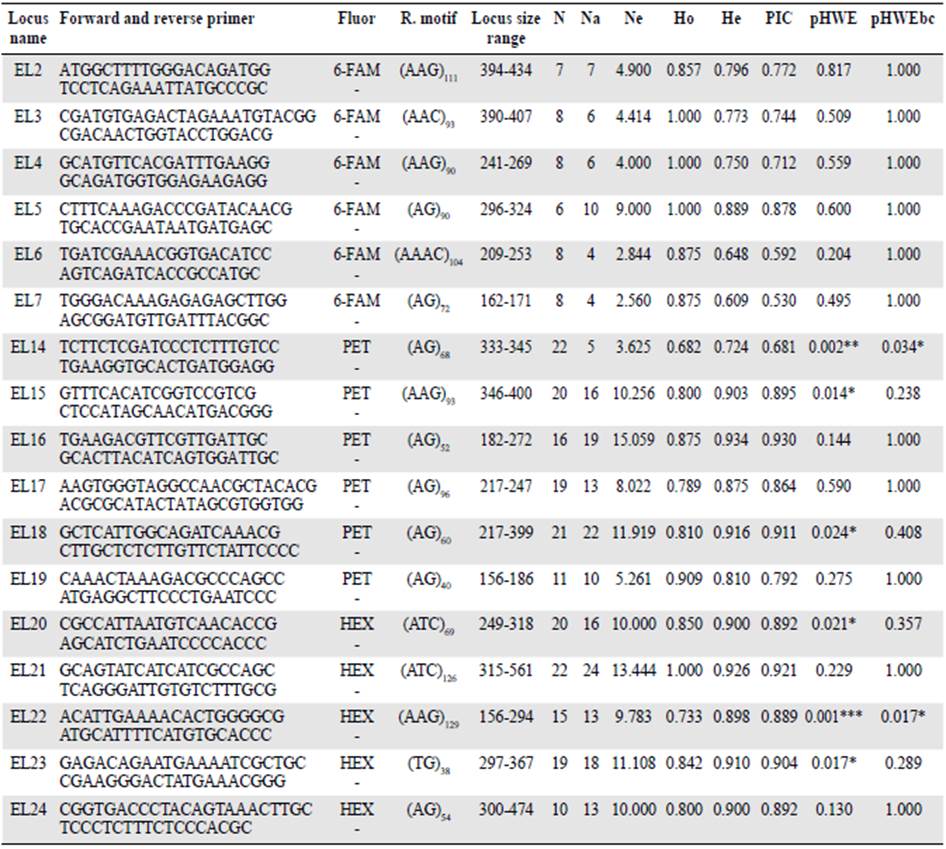
After several assays, we obtained 17 successful microsatellite markers: Nine di-, seven tri-, and one tetra nucleotide (Table 4). The allele number per locus (Na) ranged from four to 24 while the observed (Ho) and expected (He) heterozygosities ranged from 0.682 to 1 and 0.609 to 0.9304, respectively.
Table 4 Characteristics of 17 markers developed for Echinometra lucunter

Fluor: Fluorescent dye, R. motif: Motif of repetition, N: Sample size, Na: Allele number, Ne: Allele effective number, Ho: Observed heterozygosity, He: Expected heterozygosity, PIC: Polymorphic information content, pHWE: Hardy-Weingberg Equilibrium, pHWEbc: Hardy-Weingberg Equilibrium with Bonferroni Correction method. *: p<0,05, **: p<0,01; *** p<0,001
Two out of the 17 loci deviated from HWE (EL22- present in 16 of 23 samples during microsatellite screening and EL14- present in all samples except one in San Andres Island) after Bonferroni correction for multiple testing (p<0.05). Homozygote excess, related to the presence of null alleles or stochasticity due to the different locality sources for one population, might explain these deviations. Polymorphic information content (PIC) ranging from 0.530 to 0.930 shows normal polymorphism behavior (Table 4). We did not detect linkage disequilibrium between any locus pair after the Bonferroni correction, which means that in general, all the loci were independent.
Discussion
Microsatellite development is useful for a variety of genetic analyses of population structure. In this case, these markers will be used for the first time to confirm the influence of marine barriers to genetic flow among populations of E. lucunter lucunter throughout the Caribbean Sea.
For many years, based upon the biological characteristics of marine organisms and barriers such as mouths of rivers, marine currents, physicochemical parameters, and others in the Caribbean Sea, several authors have wondered if the organisms of this area are genetically homogeneous or segregated. While few marine barriers have been identified (Carlin, et al., 2003, Baums, et al., 2005, Cowen, et al., 2006, Taylor & Hellberg, 2003, 2006), several biophysical models have been proposed to identify patterns of connectivity and potential barriers to larval dispersal of reef fish (Schultz & Cowen, 1994; Paris & Cowen, 2004; Cowen, et al., 2006). There are few genetic evaluations of other marine groups providing evidence of both connectivity and phylogeographic breaks for the Caribbean (Avise, 1992; Carlin, et al., 2003; Taylor & Hellberg, 2003; Baums, et al., 2005).
According to Fox, et al. (2019), ecological and conservation studies often focus upon non-model species for which genetic markers are not available, and Echinometra species are an example. The methodology used to isolate and characterize the E. lucunter loci followed the method of multi-individual microsatellite identification (MiMi) proposed by Fox, et al. (2019) with the combination of affordable Next Generation Sequencing (NGS) and freely available bioinformatics tools. Our positive results support once again the effectiveness and speed of this method.
The application of the microsatellite markers developed herein to additional E. lucunter populations will allow understanding how the genetic diversity is distributed in this benthic species throughout the Caribbean Sea considering its biological features and the marine barriers described for the region.
Conclusions
Seventeen (17) new microsatellites were developed and characterized for the sea urchin Echinometra lucunter lucunter. The markers fill up the gap of information regarding tools to characterize the genetic structure of this species in the Caribbean Sea. Due to the absence of microsatellites within the species of the genus Echinometra, it was necessary to develop and characterize a number of this kind of markers to determine the genetic structure of Echinometra lucunter lucunter in the Caribbean Sea. The successful isolation and characterization of these microsatellites will contribute to genetic and marine connectivity studies of Echinometra lucunter lucunter and Echinometra lucunter polypora through their broad range of distribution in the Atlantic Ocean. Information on population genetics of this species is crucial for the assessment of the ecological situation of their populations and the development of management strategies when necessary.


