1. Introduction
The production of lead-free ferroelectric and piezoelectric materials has been investigated in recent years due to environmental concerns associated with the high toxicity of lead. A potential candidate is ferroelectric BNT and its solid solutions. Bismuth sodium titanate, Bi0 5Na0 5TiO3 (BNT) is a distorted perovskite with rhombohedral structure and spatial group R3c at room temperature (Smolenskii, et al., 1961). It is a ferroelectric material with high coercivity (Ec = 73 kV/ cm) and appreciable remnant polarization (Pr = 38 C/ cm2) (Parija et al., 2013); its ferroelectric behavior, relaxor type, is attributed to the disorder in the occupation of site A in the perosvskite structure (Pérez, 2016). Its piezoelectric response can be improved by creating a morphotropic phase boundary (MPB) with other perovskites. Specially, the formation of solid solutions (1-x)Bi0 5Na0 5TiO3-xBaTiO3 (BNT-xBT) and (1-y)Bia 5Na05TiO3-ySrTiO3 (BNT-yST) does not inhibit the relaxor ferroelectric behavior and creates an MPB between the rhombohedral and tetragonal phases (Ma-chado et al., 2017; Lee et al., 2002; Hiruma et al., 2008, Jo et al., 2012), which makes its application possible for energy storage devices.
Sol-gel is one of the most widely used synthesis methods to obtain ceramic powders (Brinker and Scherer, 1990). It produces pure materials with high degree of homogeneity, which is not always possible with traditional methods (Palacios-Santos, 2004). In this document, we report the synthesis of ceramic powders for (1-x)Bi05Naa 5TiO3-xBaTiO3 (x = 0.03, 0.06, 0.09, 0.12) and (1-y)Bia 5Na05TiO3-ySrTiO3 (y = 0.23, 0.26, 0.29) by sol-gel, confirming the structure of an MPB in the studied range.
2. Experimental procedure
For the synthesis of BNT-xBT and BNT-yST systems, we used bismuth nitrate (Bi5O(OH)9(NO3)4, Merck, 99.0%), sodium nitrate (NaNO3, Merck, 99.5%), barium nitrate (Ba(NO3)2, Baker Analyzed, 99.8%), Strontium nitrate (Sr(NO3)2, Aldrich, 99.9%), Titanium n-butoxide (TBT) (Ti(OBu)4, Alfa Aesar, 99.0%) and ethanol (Merck, 99.5%).
Initially, we dissolved the nitrates in acidified water (with nitric acid 2M) with constant mixing to guarantee dissolution. Simultaneously, we dissolved the titanium precursor in methanol and slowly added the previously described precursor mix. We mixed the solution at room temperature for two hours; after that, we aged the mixture at 110°C for 12 hours. We grinded the sample to obtain a finer powder which was calcined at 1000°C for 2 hours. We characterized the structure by transmittance infrared and Raman dispersion spectroscopy and x-ray diffraction. We collected infrared spectra with a Thermo Scientific Nicolet iS10 FT-IR. For the Raman dispersion spectra, we used a Raman EZRaman-N (Enwave Optronics) coupled to a Leica DM300 microscope with a 532 nm wavelength laser excitation source. Spectra were taken at 32% power with 10 seconds integration time per spectrum. Spectra were deconvoluted using Fityk 0.9.8 software, which allows qualitative and semi-quantitative analysis of the spectral bands (Wojdyr and Fityk, 2010). For x-ray characterization, we used a Bruker D8 Advance diffractometer with CuKa radiation operating in a range 26: 20-60°, with 0.02° step size and a 2 s step time. We used the Rietveld method with the GSAS program to analyze the diffractograms and to conclude about the effect of the addition of BT/ST on the BNT structure. Microstructural characteristics were determined by scanning electronic microscopy (SEM) using an EVO MA15, Carl Zeiss.
3. Results and discussion
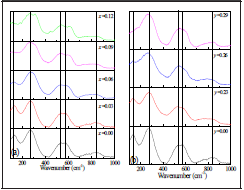
Figure 1 shows the Raman spectra for BNT-xBT and BNT-yST, in the 100 a 1000 cm1 range. The BNT spectrum ( Figure 1 for x=0,y=0) presents five vibration bands centered at 131, 270, 520, 575 and 842 cm-1, which agrees with reports by other researchers (Lidjici, et al., 2015; Siny et al., 2000). The first band at ~131 cm-1 is attributed to Na-O bond vibration. The second band, located at 270 cm-1, is associated to the TiO6 group vibration observed in the perovskites (Trujillo et al., 2005), while the bands at 520 and 575 cm-1 are associated with vibrations involving oxygen shifts. Finally, the band at 842 cm-1 can be attributed to oxygen vacancies (Zannen, et al., 2012; Selvamani, et al., 2011). Upon addition of BT (Figure 1a), the first band (-131 cm-1) shifts towards lower frequencies and decreases in intensity until disappearing for x = 0.09. The changes in position and form are more prominent in the bands attributed to the Na/Ba-O vibration; the 131 cm-1 band shift results from Ba having a higher mass compared to Na (Suchanicz, Jankowska-Sumara and Kruzina, 2011; Buixaderas et al., 2007; Rout et al., 2005; Kreisel et al.; 2000), and the broadening and pronounced decrease in intensity are related to the A-O bond weakening (Shi et al, 2014).

Figure 1 Raman spectra (100 cm-1 - 1000 cm-1) at room temperature for ceramic powders (a) BNT-xBT (b) BNT-yST
The band at 270 cm-1, associated to the Ti-O bond, splits after BT addition, which reveals a symmetry change to one whose irreducible representation has a higher number of active Raman bands; i.e., the rhombohedral and tetragonal phases coexist [32]. This is confirmed by the appearance of a band at ~ 310 cm-1, which corresponds to a tetragonal symmetry [28]. The bands at 520 cm-1 and 575 cm-1 are more sensitive to structural changes, according to studies in other type of materials with perovskite structure [28]. High frequency Raman bands are usually caused by alteration of the oxygen ion concentration as the valence difference between the ions in the host lattice and the dopant can produce oxygen vacancies. [26, 31]. There are interesting changes in several regions, especially the band at 520 cm-1 (x=0.00) which shifts to 544 cm1 and the band at 575 cm-1 which shifts to 620 cm-1, both for x=0.12. This behavior is related to the symmetry change due to phase transition (rhombohedral/tetragonal). Researchers have reported that in the BNT-yST system with 0.10 < y < 0.30, the rhombohedral (R3c) and tetragonal (P4mm) phases coexist (Kim et al., 2017), while for higher concentrations the tetragonal and pseudo cubic phases, characteristic of ST, coexist (Parija et al., 2012). The main characteristics of the Raman spectra for the BNT-yST system in Figure 1b, are: (i) bands at ~136 cm-1, ~276 cm-1 and ~548 cm-1 and some wider and lower intensity bands between 700 cm-1 and 900 cm-1; (ii) broadening of the band at ~276 cm-1 for y=0.26 and y=0.29; (iii) shifting and splitting of the band at ~548 cm-1. Band splitting and frequency variations are characteristic of a local structural reorder. The bands at -136 cm-1 can be assigned to the vibrations of site A cations. Figure 2a shows the x-ray diffraction pattern corresponding to the BNT sample. The system crystal-izes as Bi0 5Na0 5TiO3 with rhombohedral symmetry and spatial group R3 according to the CIF (Crystallographic Information File) number 2103295 (Jones and Thomas, 2002), as indicated by the Rietveld refinement shown in Figure 2b
Figure 3 shows the BNT-xBT and BNT-yST system diffraction patterns, with all characteristic peaks from BNT and without secondary phases, which indicates that BT/ST diffuses through the BNT lattice forming a solid solution. Zooming in different areas of the diffractogram in Figure 3a, shows the changes in the shape of peaks (111) ( Figure 4a) and (202) (Figure 4b) for BNT. There is a displacement towards lower 26 as the concentration of BT increases, which indicates a modification in the lattice structure parameters, confirming the analysis done by Raman.
The evolution of the peaks corresponding to the (111) y (202) lattice planes confirms not only the rhombohedral structure characteristic of BNT but also the coexistence of the rhombohedral and tetragonal phases characteristic of BT; i.e. as shown in Figure 4, for x = 0.03, there is an overlap of two peaks, interpreted as the coexistence of two phases. This overlap evolves with the increase in BT and for x=0.12 the system has a tetragonal phase; that is, there is two-phase coexistence for 0.03 < x < 0.12. The coexistence of phases is more noticeable in Figure 3b diffractograms (BNT-yST), observed in the same peaks (Figure 5); an increase in ST shifts the diffraction signals to lower angles, which corresponds to an increase in the lattice parameters. For y=0.23, a split in the peak between 46°- 47.5° forms an additional shoulder; for higher compositions the two shoulders converge, which can be interpreted as a new phase transition. The results suggest that the rhombohedral and tetragonal phases are present in the BNT-yST system for ST concentrations 0.23 < y < 0.29; therefore, the solid solution also presents an MPB.
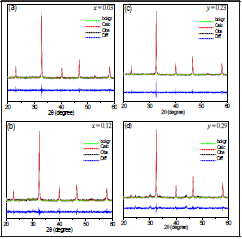
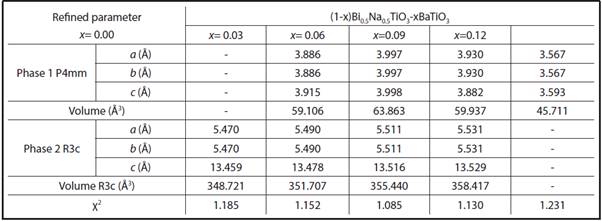
To supplement the XRD analysis, we applied Rietveld refinement to all diffractograms and the results are shown in Tables 1-2 for BNT-xBT and BNT-yST, respectively. As an example, Figure 6 shows the adjustments for the diffractograms corresponding to x=0.03 BT, x=0.12 BT, y=0.23 ST and y=0.29 ST.

Figure 6 Rietveld refinement for the BNT-xBT and BNT-yST using GSAS program for the following molar concentrations: (a) x = 0.03 BT, (b) x = 0.12 BT, (c) y = 0.23 ST and (d) y = 0.29 ST
TABLE 1 LATTICE AND PHASE PARAMETERS OBTAINED FROM RIETVELD REFINEMENT ADJUSTMENTS FOR THE BNT-XBT SYSTEM USING GSAS PROGRAM

The data reported in Tables 1 and 2 confirm the discussion already made based on raman spectroscopy and XRD patterns. The tables show that the volume modification does not follow a linear behavior, suggesting that even if BT/ST is completely soluble in the BNT matrix, the addition generates distortion in the structure (originally rhombohedral) due to variation in the size of the ions. To have a clear idea of the effect of the dopant size on the crystal structure, we analyzed the tolerance factor, t, proposed by Goldschmidt, which quantifies the degree of distortion of the perovskite in terms of ionic packing (Bhalla, Guo and Roy, 2000). For an ideal perovskite, (structure without distortions) t=1. If ion A radius is smaller than the ideal value, t is less than 1; therefore, when t decreases, the symmetry of the crystal is reduced.
TABLE 2 LATTICE AND PHASE PARAMETERS OBTAINED FROM RIETVELD REFINEMENT ADJUSTMENTS FOR THE (1-Y) BI05NA05TIO3- YSRTIO3 SYNTHESIZED BY SOL GEL, USING THE GSAS PROGRAM
| Refined parameter | (1- y)Bi0.5Na0.5TiO3- ySrT^ | ||||
| y= | 0.00 | y = 0.23 | y = 0.26 | y =0.29 | |
| a (Â) | - | 3.996 | 3.984 | 3.988 | |
| Phase 1 P4mm | b (Â) | - | 3.996 | 3.984 | 3.988 |
| c (Â) | - | 4.081 | 3.986 | 4.036 | |
| Volume P4mm (Â3) | - | 65.174 | 63.259 | 64.183 | |
| a (Â) | 5.470 | 5.515 | 5.491 | - | |
| Phase 2 R3c | b (Â) | 5.470 | 5.515 | 5.491 | - |
| c (Â) | 13.459 | 13.509 | 13.479 | - | |
| Volume R3c (Â3) | 348.721 | 355.851 | 352.006 | - | |
| X2 | 1.185 | 1.275 | 1.150 | 1.092 | |
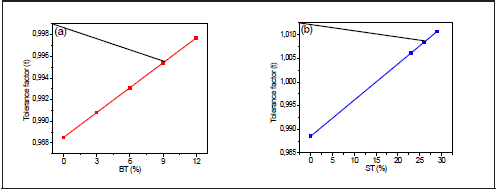
Figure 7 shows that the tolerance factor increases linearly with the BT/ST concentration. While BNT t =0.988, BNT-0.29ST, t = 1.013, which indicates that BNT's rhombohedral structure becomes more symmetrical. However, because the perovskites are not entirely ionic compounds, the tolerance factor only gives an estimated approximation of the crystal structure.

Figure 7 Variation of the tolerance factor with the percentage of (a) BNT- xBT and (b) BNT- yST BT (%) ST (%)
Figure 8 shows the micrographs for BNT and the BNT-xBT and BNT-yST system with concentrations x=0.06 and y=0.23. The SEM microscopy only allows us to observe an effect of the addition of BT / ST on the particular size. The particles have a size distribution between 1 and 2 um, but there are also some smaller particles. This size distribution can be the result of a pre-sintering process at the calcination temperature. The particles have an irregular shape and the particle size decreases and becomes more uniform with the inclusion of BT/ST.
4. Conclusions
We obtained monophasic ceramic powders with a perovskite structure for all the synthesized compositions. The percentages of BT/ST added to the BNT matrix were completely soluble in the matrix, maintaining the monophasic perovskite structure; however, there was a variation in the lattice parameters, modifying the phase percentage (rhombohedral-tetragonal) as the concentration increased. The coexistence of the rhombohedral (BNT) and the tetragonal (BT/ST) phases was confirmed by X-ray diffraction and Rietveld refinement, which indicated the generation of a morphotropic phase boundary in the obtained solid solutions


