1. Introduction
The Potwar Basin is a productive oil and gas-producing basin in Pakistan. Several researchers have provided information on the sources of hydrocarbons in the basin, including Imtaiz et al. (2017), Fazeelat et al. (2010), Ihsan et al. (2022), and Shah (2022). Hydrocarbon traps in the Potwar Basin are primarily structurally controlled, although there are also stratigraphic traps (Asif et al., 2011; He et al., 2023; Yasin et al., 2021; Zhou et al., 2022). In this study, sediments from two wells in the Fimkassar oilfield and well logs have been analyzed (Fig. 1). According to various studies, the primary source of hydrocarbons in the Potwar Basin is the Patala Formation. These researchers include Asif et al. (2011), Fazeelat et al. (2010), Fazeelat et al. (2009), Shah et al. (2022), Shah and Shah (2021), Shah (2022), and Yasin et al. (2021). The sediments from two wells of the Fimkassar oilfield, which are of the Eocene and Palaeocene ages, have been studied (Fig. 1).
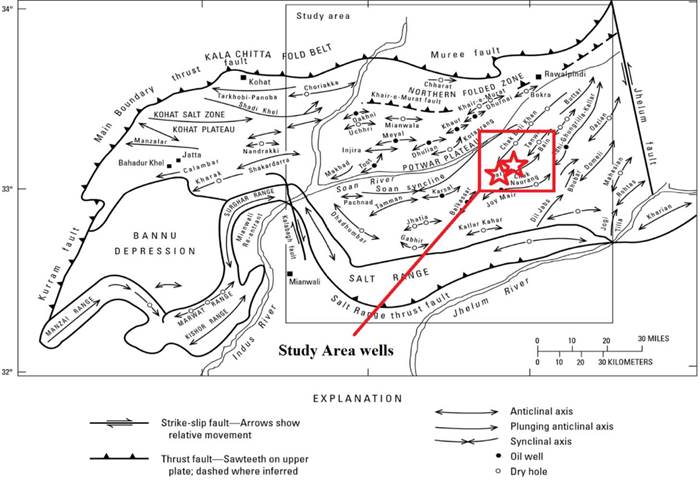
Figure 1 Map showing location of wells and major tectonic structures of Potwar Basin (after Shami and Baig, 2002; Zahid et al., 2014; Shah and Abdullah, 2016; Shah and Abdullah, 2017; Shah et al., 2019).
A study by Fazeelat et al. (2011) and Shah (2022) found that shallow marine sediments in the Potwar Basin contain organic-rich matter, necessitating an evaluation and interpretation of the source and reservoir rock characteristics of the Chorgali, Patala, and Sakesar formations in the basin (Table 1).
Table 1 Qualitative description of reservoirs porosity set by Rider's (1986) and Shah et al. (2021).
| Qualitatively Evaluation of Porosity | |
|---|---|
| Qualitative description | Average Porosity |
| Negligible | 0-5 |
| Poor | 5-10 |
| Good | 10-20 |
| Very Good | 20-30 |
| Excellent | >30 |
The novel contribution of this research is the thorough study of well cutting samples and well logs to assess source rock generation potential, thermal maturity, identification of kerogen type, and petrophysical properties. Additionally, this research combines two different methods to evaluate the horizon for potential prospects and two essential properties of the petroleum system, namely source and reservoir rock properties. This is the unique aspect of this research work. Previous studies by researchers such as Ihasn et al. (2022), Nazir et al. (2014), Shah et al. (2021), Fazeelat et al. (2010), Shah (2017), Nazir et al. (2015), H et al. (2021), and Masood et al. (2017) focused on different formations and used various techniques to evaluate them, including modelling the structure with faults for salt diapirs and studying specific formations like Sakesar, Tobra, and Khewra. However, there is a lack of information regarding the interpretation of all three formations' source and reservoir rock properties, which makes this study necessary and crucial.
The Fimkassar oilfield is located in the Potwar Basin (Fig. 1). The findings of this study will reveal the source and reservoir rock generation potential, kerogen type, thermal maturity of the rocks as source rocks, and the presence of possible hydrocarbon prospects. The research outcomes will directly benefit future hydrocarbon exploration by oil and gas companies. This research will contribute valuable information to the existing body of knowledge, aiding in the understanding of various source and reservoir properties and the petroleum potential for future hydrocarbon exploration and production.
2. Geological setting
The Potwar Basin exhibits several major characteristics, including inner and outer folded zones, a platform, and a foredeep comprising depressions (Kadri, 1995; Kazmi and Jan, 1997; Liu et al., 2023; Nazir and Fazeelat, 2017; Zhan et al., 2022). The study area specifically refers to the Fimkassar oilfield.
The Potwar Basin is geographically divided into two sections by the Indus and Jhelum rivers in the east and west, respectively. It is bordered by the Salt Range in the south and the Kalachitta-Margalla hill ranges in the north (Cheng and Fu, 2022; Liu et al., 2023; Shah and Abdullah, 2017; Yin et al., 2023). The basin is characterized by east-west complex and tight folds, which are inverted in the south and affected by steep-angle faults. The northern portion of the basin experiences more extensive deformation (Aadil et al., 2014; Kazmi & Abbassi, 2002; Kazmi & Jan, 1997; Riaz, 2022; Shah, 2009; Shah, 2022). In contrast, the eastern part of the basin exhibits an abrupt change in strike towards the northeast, with structures consisting of large synclines and anticlines tightly folded. The western part of the basin contains several gentle and broad east-west folds (Fu et al., 2022; Shah, 2022; Yin et al., 2023; Zahid et al., 2012; Zhang et al., 2022).
2.1 An overview of the Potwar Basin's source and reservoir rocks
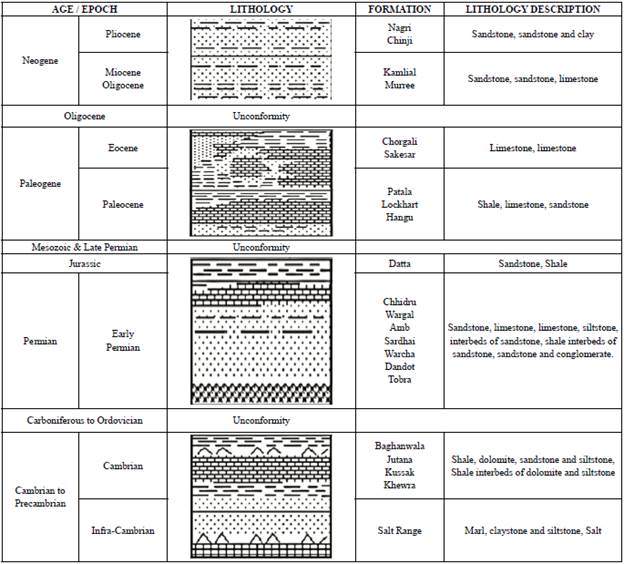
The Potwar Basin has several known source rocks, including the Sakesar, Hangu, Patala, and Lockhart formations (Shah, 2022; Xu et al., 2022; Zheng et al., 2023) (Table 2). The reservoir rocks found in the Potwar Basin include alluvial and shoreface Cambrian sandstones, Miocene alluvial sandstones, Jurassic and Permian continental sandstones, Paleogene shelf carbonates, and Miocene alluvial sandstones (Aadil et al., 2014; Kazmi & Abbassi, 2002; Liu et al., 2023; Peng et al., 2022). Oil and gas have been explored from reservoir rocks such as Tobra, Wargal, Amb, Cambrian Khewra, Jutana, Kussak, Jurassic Dutta, Khairabad, Lockhart, Nammal, Sakesar, Margalla Limestone, Chorgali, Bhadrar, and Murree (Zahid et al., 2012). The discovered oilfields in the Potwar Basin are found in either pop-up structures, faulted anticlines, or fault-block traps (Shah, 2022; Xu et al., 2022; Zheng et al., 2023; Zhou et al., 2022).
Table 2 General stratigraphy of Potwar Basin (Modified after Fazeelat et al., 2010; Shah and Abdullah, 2017).
3. Materials and methods
Thirty-four well cutting samples were obtained from the Fimkassar oilfield in the Potwar Basin, collected from Palaeocene and Eocene sequences. Well A provided samples at intervals of 4-15 m, while well B provided samples at intervals of 5-6 m. Detailed information about the samples can be found in Table 5.
Reservoir rock characteristics were determined using various logs, including density, neutron, gamma ray, resistivity, and spontaneous potential logs. The reservoir properties were qualitatively described based on criteria from Rider (1986) and Shah and Shah (2021). This study specifically utilized well logs from Well A to investigate the reservoir potential of the Nammal Formation. Reservoir rock characteristics were evaluated using methods proposed by Shah (2022), Shah (2021), and Hartmann and Beaumont (1999). Furthermore, calculations were performed to determine hydrocarbon saturation, porosity, water saturation, and formation water resistivity.
3.1 Organic petrographic analyses
The analysed samples were dried and crushed to approximately 1-2mm in size. The sediments were then embedded in polyester resin (Serifix) with a hardener, allowing the resin to set. Once set, the samples were flattened on a diamond lap and polished using various grades of silicon carbide paper, lubricated with isopropyl alcohol. Subsequently, the samples were further polished with increasingly finer alumina powder (5/20, 3/50, and gamma) to achieve a highly reflective surface. Vitrinite reflectance measurements were conducted using a Leica CTR6000M microscope equipped with Diskus Fossil software. Calibration was performed using a leuko-sapphire standard (0.589% Ro). Considering the availability and distribution of vitrinite particles, between 15-50 measurements were obtained. The measurements were taken using an oil immersion X50 objective lens under white light.
3.2 Organic geochemical analysis
The well cutting samples were initially crushed to obtain fine particles smaller than 200 mesh. The total organic carbon (TOC) content was then measured using LECO elemental analysers, specifically the CS-125 model. Pyrolysis analysis was performed using the Rock-Eval VI equipment. Approximately 100mg of crushed samples were subjected to pyrolysis in a helium atmosphere, heated to 600°C. The pyrolysis process provided three crucial parameters: S1, representing the amount of whole free petroleum; S2, indicating the quantity of hydrocarbons generated during thermal cracking; and Tmax, the temperature at which the maximum hydrocarbon generation occurs (Shah, 2023; Shah and Shah, 2021). The hydrogen index and production yield were also calculated as other significant factors.
3.3 Well log analysis
The well logs in the LAS file format were used on the interactive petrophysics software package to establish reservoir properties. Details of the properties are available in Table 3.
Table 3 Petrophysical analysis ifferent parameters calculated for well logs analysis.
| Depth (ft) | Temp | RHOB | ΦD | SP | Φ (N.D) | Rt (LLD) | Rwe | Rw | Sw | SH | Lithology |
|---|---|---|---|---|---|---|---|---|---|---|---|
| 7944 | 151.6 | 2.61 | 0.13 | -27 | 0.12 | 330 | 0.39 | 0.67 | 36% | 64% | Limestone |
| 7969 | 152.2 | 2.62 | 0.10 | -12 | 0.14 | 310 | 0.51 | 0.80 | 39% | 61% | Limestone |
| 7994 | 152.7 | 2.64 | 0.12 | -28 | 0.11 | 160 | 0.62 | 0.61 | 37% | 63% | Limestone |
| 8019 | 153.1 | 2.63 | 0.09 | -33 | 0.09 | 950 | 0.56 | 0.47 | 35% | 65% | Limestone |
| 8044 | 153.5 | 2.61 | 0.11 | -25 | 0.13 | 1390 | 0.27 | 0.32 | 38% | 62% | Limestone |
| 8069 | 154.4 | 2.67 | 0.08 | -32 | 0.10 | 1680 | 0.62 | 0.44 | 32% | 68% | Limestone |
| 8094 | 154.6 | 2.66 | 0.11 | -35 | 0.13 | 480 | 0.35 | 0.35 | 36% | 64% | Limestone |
The procedure for obtaining various parameters from the well logs is described in the section below:
The log track parameters that were directly read included:
Volume of shale (Vsh):
The volume of shale was calculated using GR logs. Vsh was calculated using the equation below. (Rider, 2002; Shah, 2023; Shah et al., 2022):
GR= (GRJog-GR_min/GR_max-GR_min)
Porosity calculation:
Sonic log was used to determine the porosity by using the following equation:
Φs = ΔTlog-Δtma/ΔTf-Δtma
Where,
Effective porosity:
The permeable zone of the formation is determined by calculating effective porosity. Following equation was used to calculate effective porosity (Rider, 2002; Shah et al., 2023; Xu et al., 2022; Zhang et al., 2022):
ϕe= ϕt∗(1−Vsh)
Whereas: ϕe= Effective porosity ϕt = Total porosity
Vsh = volume of shale
Hydrocarbon Saturation (SH)
Spontaneous potential (SP) method (Figure 2-3b) was used for the determination of hydrocarbons at the zone of interest. The graphs and equations used together in the following process:
Formation temp was calculated using Figure 2 and the following equation: Tf = Ts + Df (BHT-Ts/TD)
Rmf and Rm were corrected (Fig. 3a).
Sp values were read from logs directly.
Rmf/Rwe ratio was calculated (Fig 3b).
The Rwe was calculated by Rmf/Rwe ratio.
Rwe= Rmfeq/(Rmfeq/Rwe)
Water saturation was calculated using Archie's equation:
Hydrocarbon saturation was calculated using equation: SH=1-Sw
After measuring the resistivity values of the mud fíltrate, they were converted to equivalent mud fíltrate resistivity values using the equation in Figure 2. To obtain the equivalent water resistivity, the equivalent mud fíltrate resistivity values were used according to step 6. Subsequently, the equivalent water resistivity was converted to water resistivity, which was then used to determine water saturation using Archie's equation.
The log header's mud fíltrate resistivity was determined at surface temperature. To determine the mud fíltrate resistivity at formation temperature, it must be corrected to formation temperature for each value at a certain depth, and this correction was made using the equation presented in Figure 3a.
4. Results and discussion
4.1 Total Organic Carbon and Pyrolysis
Typically, the total organic carbon (TOC) content is used to indicate the richness of rocks, with a TOC value of 1.0% considered necessary for a clastic rock to qualify as a source rock, as stated by Hunt (1996) and Shah (2023). Sediments from the Patala Formation in both wells exhibited higher TOC contents, with mean values ranging from 2.70 wt% to 2.88 wt% in well A and 2.48 wt% to 2.98 wt% in well B, respectively. Sediments from the Sakesar Formation had an average TOC content of 1.72 wt% and ranged from 1.56 wt% to 1.88 wt%. Based on the sample analysis, the majority of samples showed good to very good TOC content.
The parameter S2, produced during pyrolysis, is the most useful for estimating the hydrocarbon generative potential (Dang et al., 2023; Peters and Cassa, 1994; Tissot and Welte, 1984; Wu et al., 2022). According to Bordenave et al. (1993) and Shah and Abdullah (2017), a good petroleum generation capacity requires a minimum of 5 mg HC/g S2. In general, the Sakesar Formation exhibited hydrocarbon yields (S2) ranging from 3.76 mg/g to 5.78 mg/g, while the Patala Formation in well A showed hydrocarbon yields ranging from 7.88 mg/g to 9.65 mg/g, and the Patala Formation in well B showed hydrocarbon yields ranging from 5.87 mg/g to 8.66 mg/g. The Sakesar Formation displayed fair to good petroleum generating potential, whereas sediments from the Patala Formations in both wells A and B showed good petroleum generating potential, as indicated by the S2 versus TOC cross plots (Fig. 4 and 5).
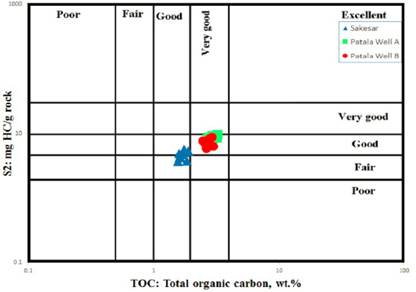
Figure 4 Pyrolysis S2 versus total organic carbon (TOC) plot, showing generative source rock potential for the analyzed samples (Peter and Cassa, 1994).
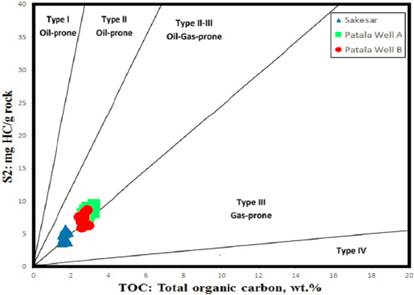
Figure 5 Pyrolysis S2 versus total organic carbon (TOC) plot, showing the type of kerogen for the analyzed samples (Peter and Cassa, 1994).
The migration index (S1/TOC) can be used to differentiate between indigenous and migrated petroleum (Shah, 2022; Tissot and Welte, 1984). The S1 versus TOC plot in this study demonstrated that all samples from the Sakesar Formation and Patala Formation (wells A and B) were indigenous (Fig. 6).
4.2 Kerogen Type
The hydrogen index (HI) was utilized to assess the kerogen types in the formations, which is considered the most important index for this purpose (Peters, 1986; Tissot and Welte, 1984). HI values for the Sakesar Formationranged from 211 mg HC/g TOC to 332 mg HC/g TOC, while the Patala Formation exhibited HI values ranging from 262 to 317, and well B showed HI values ranging from 213 to 308. To classify the kerogen type, HI versus Tmax plots were constructed, revealing that the sediments of all formations primarily consist of mixed Type-II/III kerogen. The kerogen type identified through S2 versus TOC plots also aligned with the interpretation of the HI versus Tmax plot (Fig. 4 and 7).
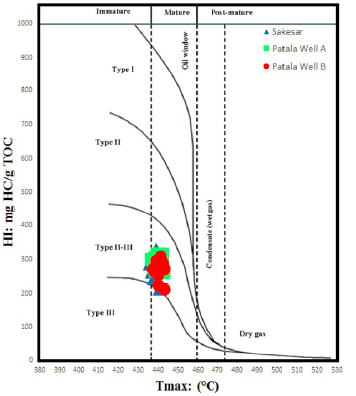
Figure 7 The Pyrolysis HI versus Tmax plot shows kerogen type for the analyzed samples (Mukhopadhyay et al., 1995).
Samples from both wells A and B in the Patala Formation exhibited high HI values of 213 to 317 mg HC/g TOC, while samples from the Sakesar Formation also displayed high HI values of 211 to 332 mg HC/g TOC, indicating their potential as oil/gas-prone source rocks (Fig. 4, 5).
4.3 Thermal maturity
For thermal maturity assessment, parameters including Tmax values, vitrinite reflectance (%Ro), and Production Index (PI) were used. Oil with vitrinite reflectance values ranging from 0.6% to 1.3%Ro is considered thermogenic oil (Bordenave, 1993; Tissot and Welte, 1984). Tmax levels exhibit a wide range of variation. According to Espitalié et al. (1977) and Shah et al. (2023), Tmax values between 430 and 455 °C correspond to kerogen Types I and II, while values between 435 and 465 °C correspond to Type III.
All formations showed measured vitrinite reflectance (%Ro) values ranging from 0.67% to 0.81% (Figure 8). As shown in Table 4, the vitrinite reflectance values for the Sakesar Formation sediments ranged from 0.67% to 0.8% Ro and corresponded to temperatures between 435 and 442 °C, indicating the peak of oil production and early maturity within the oil window (Fig. 9). In the case of the Patala Formation, samples from well A exhibited vitrinite reflectance values ranging from 0.69% to 0.81% Ro, with Tmax values between 436 and 443 °C, while samples from well B exhibited vitrinite reflectance values ranging from 0.71% to 0.81% Ro, with Tmax values varying between 437 and 443 °C (Table 4 and 5). These values suggest early maturity within the oil window and the peak of oil generation (Fig. 9).
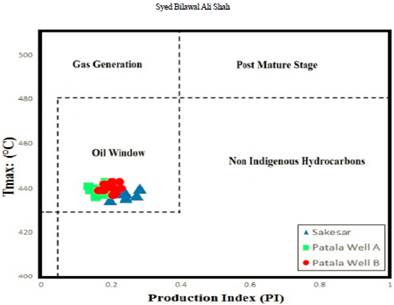
Figure 8 Plot of Tmax versus production index (PI), showing the maturation and nature of the hydrocarbon products of the analyzed samples (Shah, 2023).
Table 5 Bulk geochemical results of all analysed samples in detail including all test results (VR, TOC and Rock-Eval data).
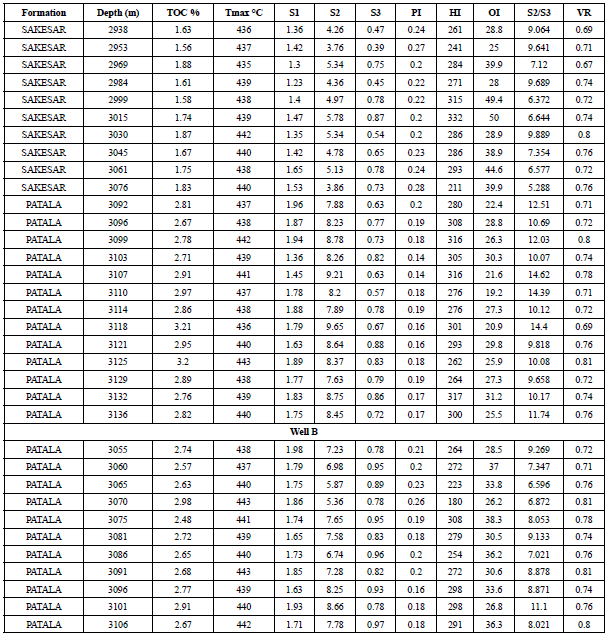
For organic matter maturity assessment, if PI values are less than 0.05, the samples may be considered immature and may have produced little to no hydrocarbons. PI values between 0.05 and 0.10 indicate very limited oil production and a potential entry into the wet gas zone. PI readings exceeding 1.0 suggest that the kerogen's capacity to produce hydrocarbons may have been depleted.
Sediments from the Sakesar Formation exhibited PI values ranging from 0.2 to 0.28, indicating early to peak maturity, which aligns with the Tmax and vitrinite reflectance (%Ro) measurements (Fig. 8). Meanwhile, samples from the Patala Formation predominantly displayed PI values ranging from 0.14 to 0.26, indicating early to peak maturity within the oil window, and were consistent with the Tmax and %Ro data (Fig. 8).
4.4 Reservoir potential
The reservoir parameters determined from the petrophysical analysis were used for the quantitative interpretation of the reservoir. The estimated petrophysical characteristics of the Chorgali Formation are shown in Table 3. The average porosity ranged between 8-14%, indicating poor to moderate reservoir potential. According to Rider (1986) and Shah and Shah (2021) criteria, the average water saturation was 36.14%, and the hydrocarbon saturation was 63.85%, indicating average to good hydrocarbon potential (Table 1).
5. Concluding remarks
Following is a summary of the key findings from the investigation of the Chorgali, Patala, and Sakesar formations sediments using geochemical and petrophysical analysis:
The source rock sediments showed that the Sakesar Formation has fair to good generative ability, with TOC > 1.5 wt. % (ranging from 1.56-1.88 wt. %), and possesses mixed Type II/III Kerogen. The Patala Formation has good to very good generative potential, with TOC > 2.4 wt. % (ranging from 2.483.21 wt. % in both wells). Both formation sediments lie in the maturity oil/gas window zone, as indicated by both S2 vs TOC and HI vs Tmax plots. Therefore, it could be expected that both formations may have generated oil and gas in the Fimkassar Oilfield subsurface.
Petrophysical analysis of the Chorgali Formation encountered in well A indicates average reservoir qualities and an average potential for the production of hydrocarbons.


