Introduction
Leading scientists such as François Perroux and Gunnar Myrdal have argued that economic growth and development are not a natural by-product of the free functioning of markets, but rather are an unbalanced process that creates gaps even between adjacent regions[1]. Therefore, the planning and implementation of public policy strategies becomes a necessity to positively influence the economic development of a region.
"In the state of Hidalgo, Mexico, the polarization between regions is deep, a developed south with services and economic growth, in contrast, a northern zone with large economic imbalances, lack of infrastructure and inadequate services" (Hernández, 2020, p. 4).
In this regard, Huiwen Gong, Robert Hassink, Juntao Tan, and Dacang Huang (2020) refer to regional resilience and mention that:
"... Some regions are more resilient than other regions, because the regional industries dominating the regional economy are less affected by the shocks (see example above). Second, business culture, confidence and expectations affect regional resilience (Martin & Sunley, 2020), and thirdly, local and national institutions, including norms and values (Huggins & Thompson, 2015) and experiences to deal with past shocks and crises (institutional learning) (Bristow & Healy, 2014). Fourthly, the nature and extent of supportive policies and measures, such as specific policies to remedy the crisis, etc., at several spatial scales affect regional resilience (Cowell, 2015; Evenhuis, 2016; Kakderi & Tasopoulou, 2017)" (Gong, Hassink, Tan, & Huang, 2020).
Micro-region XVI is in the south of the state of Hidalgo, made up of the municipalities of Tizayuca, Tolcayuca, Zapotlán de Juárez, and Villa de Tezontepec (INEGI, 2020), municipalities with deep economic imbalances, but also with competitive advantages, which, if well used, can detonate a pole of development with multiple economic benefits.
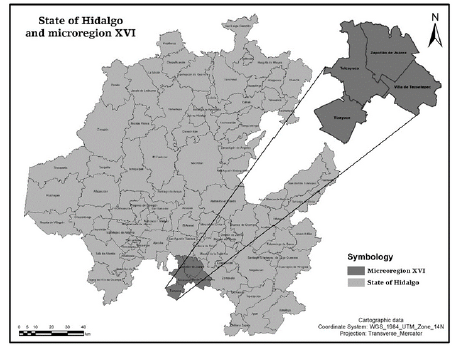
Source: own elaboration based on INEGI (2020), "Information by entity. Hidalgo". With the use of the ArcGIS program.
Figure 1 State of Hidalgo and its microregion XVI
In the last twenty years, the population dynamics of Tizayuca have grown rapidly. In the year 2000, there were 46,344 inhabitants; in 2010, there were 97,471 inhabitants; and 10 years later, the population was 168,302 people. This represented a growth of 360 percent compared to the year 2000.
Tolcayuca has a phenomenon called a dormitory city, where people sleep in the city but work in other nearby cities. In Zapotlán de Juárez, half of the population is 30 years old or younger, with the highest range concentrated between 10 and 19 years old. Villa de Tezontepec, in 2010, had a population of 11,654 inhabitants; by 2020, it grew to 13,032, a growth of 12 percent in 10 years.
The micro-region presents an economic structure that, if taken advantage of, can become an economic space in which a new pole of economic growth is located, increasing labor demand, taking advantage of the multiple research centers that are consolidated, and generating vertical and horizontal productive chains.
Proof of the economic potential of micro-region XVI is the road infrastructure and the proximity to universities and research centers, which have not been used by the neighboring municipalities. The problem of the lack of jobs and the low economic development of the region arises because of a lack of public and industrial policy. "El crecimiento económico es un proceso encauzado e incentivado desde la política económica y demás instrumentos económicos diseñados y adoptados por el aparato de Estado para incidir en la construcción de los mercados y en su expansión" (Pérez, 2016, p. 77). Piketty (2015) suggests that "las regiones requieren de políticas que redistribuyan la riqueza. Pero para llegar hasta este punto primero se necesitan crear los mecanismos necesarios para generar la riqueza, es decir, concebir un crecimiento económico sostenible".
The objective of the research is to detect the productive activities with the greatest economic potential in micro-region XVI; to achieve this, a methodology with a quantitative approach was developed. This allows for building a balanced work in which indicators, statistics, and relevant data are contemplated. The methodology uses panel data for the years 2004 to 2019 with a positive method under an economic approach. Based on some authors (Mohammadali & Abdulkhaliq, 2019), Kljucnikov et al. (2020) argue that the regional development of industrial regions is structurally disadvantaged; therefore, it is a field that needs a new and innovative approach.
Methods and results
To know and describe the economic situation at the state and regional levels, four indices were used that have the advantage of being easily operable and highly descriptive:
Participation Index by Sector
Location Coefficient
Economic Specialization Index
Economic Potential Index (own design and elaboration)
These four methodological tools were used to study the economic situation in the years 2004, 2009, 2014, and 2019 using information from the INEGI Economic Censuses.
Once a descriptive analysis of the state and regional economic activity was obtained at a general level through the different indices, a quantitative methodology used to determine the potentialities and opportunities of the territory. The quantitative methodology was based on the design and execution of what was named the Economic Potential Index, whose objective was to determine the productive vocation for each of the five elements of the North American Industrial Classification System (SCIAN) that was applied to micro-region XVI. With the use of this methodology, a rigorous analysis of those activities with high potential that must be promoted was sought.
The following general questions led us to conduct this research:
How firms, industries, clusters, and regions evolve in space and over time, how they respond to shocks and crises, and how they transform themselves in the longer run belong to the most intriguing and challenging questions in economic geography and adjacent disciplines (Oinas et al., 2018, p. 227).
An industry cluster may be defined very generally as a group of business enterprises and non-business organizations for whom membership within the group is an important element of each member firm's individual competitiveness (Bergman & Feser, 2020).
Participation Index by Sector (IPS)
The IPS is designed to indicate the economic sector with the highest relative preponderance for the entity. It can take values from 0 to 100, with 0 representing a sector with marginal weight and 100 representing an economic sector that uses all inputs and production factors, meaning that it is the essential sector for the economy that encompasses all the resources of said economy. Formula 1 summarizes the methodology used to calculate the IPS.
PBThj = Total Gross Production for activity j. Where h represents a territorial delimitation as a state or region and j the selected productive activity.
PBTh = Total Gross Production. Where h represents a territorial delimitation as a state or region.
The information collected through the variable Total Gross Product (PBT) at the state and regional levels was processed through Equation 1.
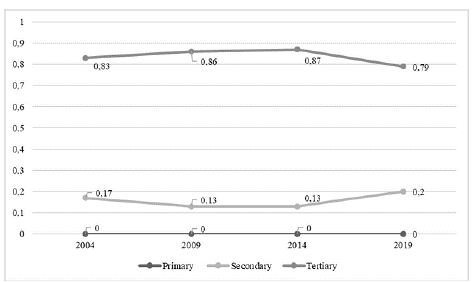
Figure 2 shows the value of the Hidalgo state IPS for the years 2004, 2009, 2014, and 2019 for the three different economic sectors. In the same illustration, it can be seen that the primary sector has an insignificant weight in the economic dynamics, while the trade and services sector present a positive trend that goes from 17% for 2004 to 20% for 2019.
Source: own elaboration based on INEGI (2004, 2009, 2014, 2019).
Figure 2 Participation Index by Sector of the state of Hidalgo
In addition, on the other hand, the secondary sector showed a negative trend during the analysis period, declining from 83% in 2004 to 79% in 2019. However, the average participation of this sector in the state, across the four activities that compose it, was 83%, with the manufacturing industry contributing between 88% and 97%.
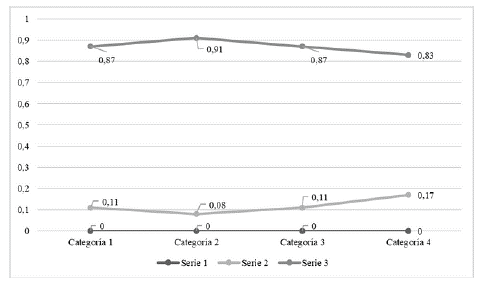
Figure 3 shows that the IPS for micro-region XVI follows a trend very similar to that at the state level, where the largest amount of resources is used for industrial production, followed by marginal participation from the tertiary sector, and finally, the absence of primary activities in the economy.
Source: own elaboration based on INEGI (2004, 2009, 2014, 2019).
Figure 3 Participation rate by sector for micro-region XVI
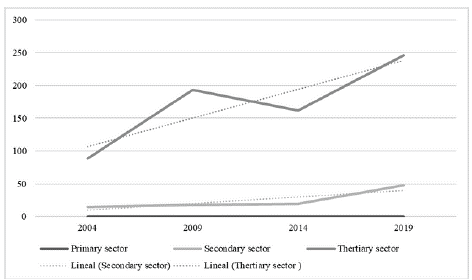
Another important element is the analysis of the positive trend presented by the tertiary sector from 2004 to 2019. To delve deeper into this topic, Figure 3 depicts the PBT at the regional level deflated with the Consumer Price Index with a base year of 2008. This technique allowed us to observe the real trend of PBT and thus understand the reasons motivating the behavior of the tertiary sector.
Figure 4 illustrates the actual trend line for each economic sector. The industrial sector stands out initially for presenting a positive and markedly pronounced trend. Similarly, the secondary sector increased its trend angle since 2009 and intensified it further during the period from 2014 to 2019.
Source: own elaboration based on INEGI (2004, 2009, 2014, 2019).
Figure 4 PBT at the regional level deflated with the Consumer Price
In summary, from 2004 to 2019, both the secondary sector and the tertiary sector presented positive growth rates. In the last five years, the commerce and services sector accelerated dramatically, increasing from a real PBT of 21.9 million pesos to 42.72 million pesos, which translates into a growth rate of 94% in just four years. This dynamic on the part of the tertiary sector has caused the industrial sector to lose part of its participation in the economic structure of the region in relative terms, which explains the adjustment in the trend by the secondary sector expressed in Figure 3.
Location coefficient
In the modern world economy, the ranking of cities is a function of the location of international companies and the presence of their network linkages (Zuzañska-Zysko, 2020, p. 2). The Location coefficient (CL) is a technique widely used to identify the economic activity or sector in which a certain territory specializes. In the research, this methodology was used to verify, through the Total Gross Production (PBT) variable, the economic specialization of micro-region XVI.
Equation 2. Summarizes the methodology used to obtain this indicator.
Where:
PBThj= Total Gross Product of sector j. Where h represents a territorial delimitation as a state or region and j the selected productive activity.
PBTh= Total Gross Product. Where h represents a territorial delimitation as a state or region.
PBTnj= Total Gross Product of sector j. Where n represents a territorial delimitation immediate superior to h and j the selected productive activity.
PBTn= The sum of Total Gross Production. Where n represents the immediate superior territorial delimitation to a h.
To interpret the CL, there are two possible scenarios: 1) when CL < 1, it is argued that there is no economic specialization in said sector, and 2) when CL > 1, in this case, it is argued that said sector has relative specialization.
The product obtained with the IPS can take values between 0 and 100, where 0 reflects null participation by the economic sector "X," and 100 represents the absolute participation of said sector in the economy.
The results of this procedure are shown in Figure 5; both the primary sector and the tertiary sector are poorly specialized, despite the latter showing vertiginous growth from 2014 to 2019. On the other hand, the industrial sector, whose CL presents values above 1, although with a negative trend over time.

Source: own elaboration based on INEGI (2004, 2009, 2014, 2019).
Figure 5 Location coefficient for the state of Hidalgo
Localization coefficient for micro-region XVI
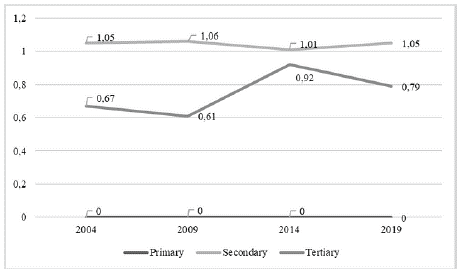
As shown in Figure 6, throughout the analysis period, micro-region XVI maintained economic specialization in the secondary sector. Conversely, the tertiary sector gained ground from 2004 to 2018, increasing from a CL of 0.67 to a CL of 0.79, which reaffirms the rapid growth shown in Figure 4. Regarding the primary sector, there is marginal CL, which is consistent with the observable economic dynamics at the state level.
Source: own elaboration based on INEGI (2004, 2009, 2014, 2019).
Figure 6 Location coefficient for the micro-region XVI
Economic specialization Index
The economic specialization index follows the same logic as the CL, with the difference that it uses the total number of employed populations as the main variable. Therefore, in this section, this indicator will be used to identify those subsectors within the secondary sector that exhibit economic specialization. The methodology used is summarized in Equation 3.
Where:
POhj= Total employed population in economic activity j. Where h represents a territorial
delimitation as a state or region and y j the selected productive activity.
POh= Total employed population. Where h represents a territorial delimitation as a state or region.
POnj= Population employed in economic activity j. Where n represents a territorial delimitation immediate superior to h and j the selected productive activity. POn= Total employed population. Where n represents the immediate superior territorial delimitation to h.
The interpretation of the IEE results follows the same logic as the CL, where an IEE < 1 represents low specialization and an IEE ≥ 1 represents high economic specialization. From Figure 7, it is important to highlight that, for the state of Hidalgo, both the mining and manufacturing industries maintained their productive specialty from 2004 to 2019, while Subsector 22 lost this specialty in 2014, decreasing from an index of 1.46 in 2009 to 0.74 in 2014 and then to 0.9 in 2019. On the other hand, the construction sector is emerging as the activity with lower economic specialization within the sector, as it registered an IEE of 0.76 in 2004, increasing to 0.9 by 2019.
With the use of these indicators, the aim was to gain an overview of the regional productive vocation. However, given that the objective of this research is to understand the economic potential of the entire chain that integrates the North American Industrial Classification System, and to identify different areas of opportunity that should be supported to consolidate an economic region, it became imperative to resort to other types of methodologies that would allow for a more precise investigation of these issues.
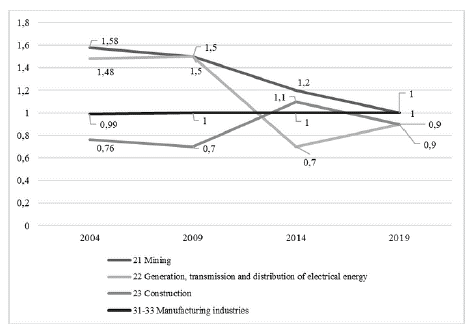
Source: own elaboration based on INEGI (2004, 2009, 2014, 2019).
Figure 7 Index of Economic Specialization for the state of Hidalgo
Once the economic specialization of the secondary sector for micro-region XVI has been confirmed, it is important to determine which subsectors drive such economic specialization. To achieve this, information on the total employed population provided by INEGI (National Institute of Statistics and Geography) was utilized and processed through Equation 3. The results of this methodology are shown in Figure 8.
From Figure 8, it is concluded that, like the state level, the manufacturing industry maintains a favorable and stable EEI over the analysis period, whereas Subsector 23 exhibits a fluctuating index. Subsectors 21 and 22, on the other hand, show an EEI of 0, indicating that these last two subsectors lack economic specialization.
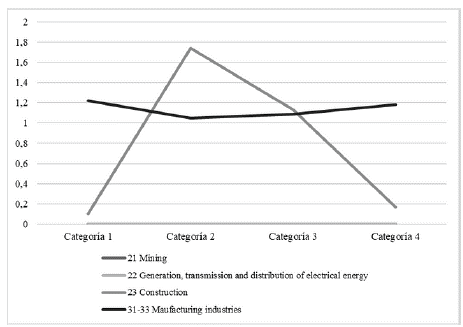
Source: own elaboration based on INEGI (2004, 2009, 2014, 2019).
Figure 8 Economic specialization index for micro-region XVI
Economic potential index
With the aforementioned indicators, the aim was to gain an overview of the regional productive vocation. However, given that the objective of this research is to understand the economic potential of the entire chain that integrates the North American Industrial Classification System, and to identify different areas of opportunity that should be supported to consolidate an economic region, it became imperative to design other types of methodologies that would allow us to delve more precisely into these issues.
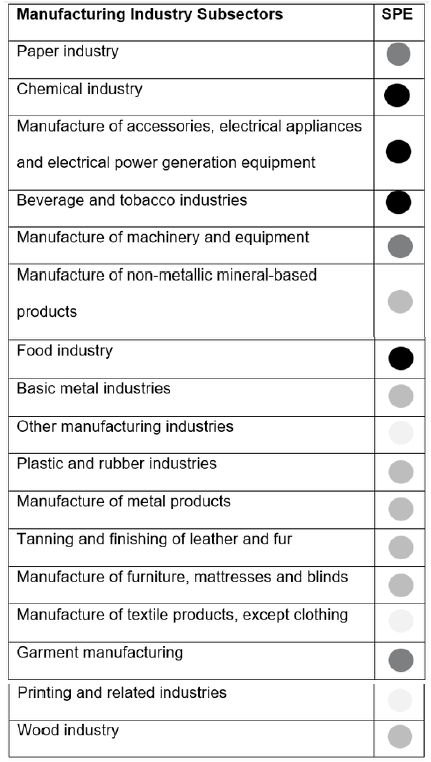
To identify the activities with the greatest economic potential, the Economic Potential Index (IPE) for micro-region XVI was designed and prepared using IBM SPSS software, considering 17 of the 19 subsectors of the manufacturing industry in which micro-region XVI actively participated in 2019. Subsequently, the IPE was transformed into the Economic Potential Stoplight (SPE) with the aim of communicating the results and findings quickly and accurately.
According to Guadarrama Zamora (2009), it is necessary to select and promote economic sectors that benefit the infrastructure and economic structure of the entity, thus achieving Hidalgo's development and triggering economic growth.
To achieve this objective, we started with a 17 x 6 matrix where the columns represented each of the 17 subsectors and the rows represented their respective values, based on data obtained from the Census Information Automation System (SAIC) of INEGI. This matrix included the following 6 items:
Total Gross Production (PBT) in millions of pesos: Represents the value of all goods and services produced or marketed by economic units because of their activities.
Employed Population (PO): Represents the number of people engaged in a specific economic activity.
Gross Census Added Value (VACB) in millions of pesos: Represents the value of production added during the work process through creative and transformation activities of employed personnel on consumed materials.
Percentage of value added in the PBT (VACB / PBT): Represents the value that economic units add to the PBT of each economic activity.
Productivity index. It is the quotient between PBT and PO. This can be interpreted as an indicator that evaluates the performance of an economic activity, which is considered productive if it is equal to or greater than 1.
Later, with the help of SPSS software, a dummy variable was created for each of the 6 items, resulting in a 17x12 matrix. These dummy variables were designed to assign a value of 0 to those economic activities that fell below the mean of each item and a value of 1 to those that exceeded the mean. Subsequently, the IPE variable was constructed, which sums the 6 dichotomous variables, resulting in a 17 x 13 matrix, with row 13 representing the IPE.
Consequently, the IPE can take values from 0 to 6, where 0 indicates very low economic potential and 6 indicates high economic potential. Finally, to visually present this index, the IPE was transformed into the Economic Potential Traffic Light (SPE, by its Spanish acronym) to visually represent the economic potential of each selected productive activity based on 4 colors: green, yellow, orange, and red, as follows:
Subsectors with an IPE = 0 were categorized as having very low economic potential and are represented in red.
Subsectors with 1 < IPE < 2 were categorized as having low economic potential and are represented in orange.
Subsectors with 3 < IPE < 4 were categorized as having medium economic potential and are represented in yellow.
Subsectors with 5 < IPE < 6 were categorized as having high economic potential and are represented in green.
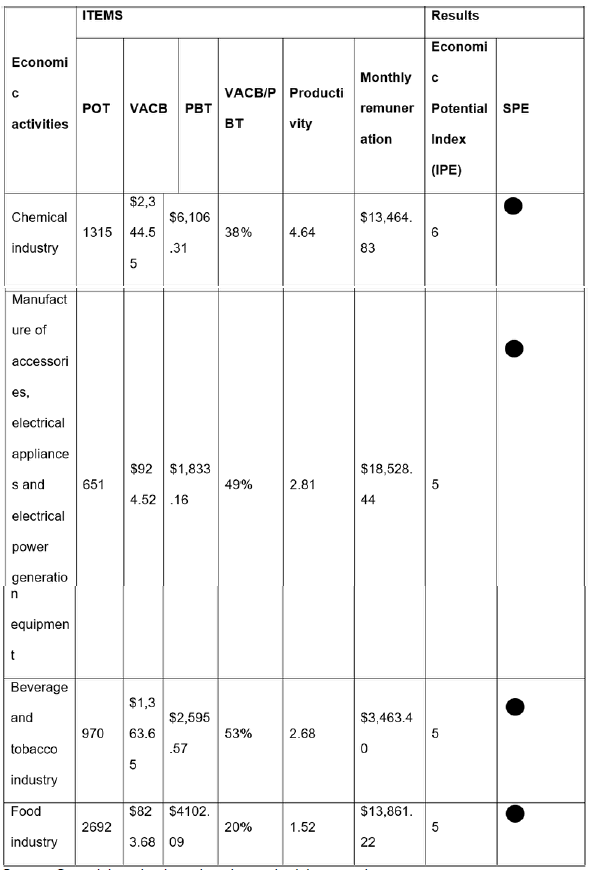
The results obtained with the IPE for the 17 economic subsectors of the industry are shown in Table I. It can be observed that out of the 17 subsectors analyzed, five have very low economic potential, another five have low potential, three have medium potential, and four have high economic potential.
From this table, it is important to highlight the four subsectors with high potential: Chemical industry; Manufacture of accessories, electrical appliances, and electrical power generation equipment; Beverage and tobacco industry; Food industry.
The data and results of these subsectors are shown in Table 1, which presents the 6 items that were evaluated to obtain the IPE. Within this table, the four subsectors have an IPE greater than or equal to five, indicating high economic potential, reflected in the last column with a green SPE.
This means that, by discriminating among the 19 subsectors comprising the manufacturing industry of Tizayuca based on their size, productivity, added value they contribute to their products, and average monthly remuneration per worker, there are four leading subsectors of the economy: chemical industry; manufacture of accessories, electrical appliances, and electrical power generation equipment; beverage and tobacco industry; and food industry.
Discussion
The economic structure of micro-region XVI is not overly complex, as it essentially mirrors the municipality of Tizayuca. Evidence of this is that the PBT of Tizayuca represented 93%, 95%, and 95% of the PBT of micro-region XVI for the years 2009, 2014, and 2019.
To illustrate this situation, Figure 9 presents the PBT deflated with the Consumer Price Index, base year 2018.
From the above figure, two characteristics can be deduced:
i. The PBT of the region is composed of the contribution of Tizayuca's PBT plus a marginal contribution from the rest of the municipalities that make up the region.
ii. The trend of the real PBT during the period 2004 to 2019 followed a positive trajectory with a slight contraction in 2014; nevertheless, the deflated PBT increased from 105 units to 273 units. Additionally, the region experienced a growth rate of 60% during this period, translating to an average annual growth of 4.3%.

Source: own elaboration based on INEGI (2004, 2009, 2014, 2019).
Figure 9 Gross Total Product. Regional and Municipal Trend
Another crucial aspect that has contributed to Tizayuca positioning itself as the municipality with the highest PBT in the region is its proximity and functional relationship with the central municipalities of Mexico City, which has even positioned Tizayuca as an outlier municipality of the metropolitan area of Mexico City (Secretaría de Desarrollo Social, 2012).
There is growing evidence of the effects of the movement of industry-specific human capital on the development of regions (Jara-Figueroa et al., 2018, p. 12653). History shows that the migration of skilled workers encourages regional development of new industries. However, the aforementioned functional relationship with the city and the most important business center in the country imposes challenges; one of them is to retain the human capital that is produced, since according to data from the 2019 Economic Census, in CDMX the average annual salary per worker is 109,380 pesos, while in micro-region XVI it is 67,023 pesos.
Tizayuca within micro-region XVI is the municipality with the largest demographic size, political weight, and economic dimension. This is due to the fact that until 2019, this municipality was home to the largest number of companies and sources of employment in the region. Evidence of this situation is that by 2019, the municipality contributed 72% of the total population of the micro-region and 95% of its PBT (INEGI, 2020).
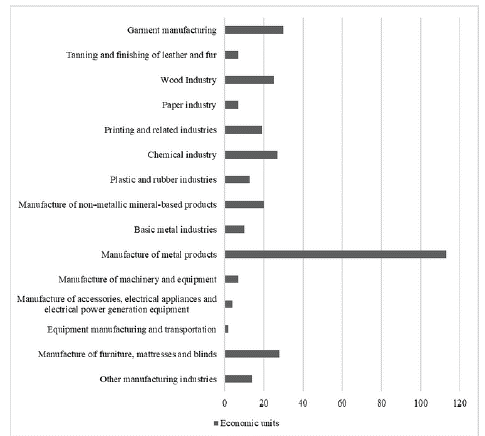
The three economic indicators applied in the previous sections suggest that micro-region XVI has a productive vocation aimed at the manufacturing subsector. To delve into this subsector, Figure 10 shows the 19 economic branches and their respective number of companies comprising it for the year 2019.
In Figure 10, the subsector of the food industry and the manufacture of metal products stand out, activities that have the largest number of economic units, while the manufacture of transport equipment and manufacture of textile inputs and finishes are those with the lowest number of companies.
Tizayuca and, with it, micro-region XVI of the State of Hidalgo, have four branches within the manufacturing industry with high economic potential that must be stimulated to consolidate the micro-region as a development pole for attracting investment, generating wealth, and jobs Ramírez Velázquez (2011) argues that:
"...el uso de la categoría de desarrollo territorial permite hacer una propuesta que vaya más allá de considerar al espacio como mero soporte contenedor de cosas, personas o actividades y lo integre a un proceso de cambio en conjunción con los agentes que lo usan, se lo apropian o lo transforman." (p. 568).
However, to lay the foundations for an economic development policy, it is necessary to be precise about the productive activities to be promoted. This is because within these four branches there are many unproductive activities. Therefore, in this research, it is proposed to underpin the following 4 branches through 7 economic activities:
Chemical industry: manufacture of other basic organic and inorganic chemicals.
Food industry: preparation of snacks; preparation of fresh food for immediate consumption; and manufacture of biscuits and pasta for soup.
Manufacture of accessories, electrical appliances, and electrical generation equipment: manufacture of accessories, electrical appliances, and electrical generation equipment.
Beverage and tobacco industry: production of soft drinks, ice and other non-alcoholic beverages; purification and bottling of water; and production of soft drinks and other non-alcoholic beverages.
Conclusions
Micro-region XVI is at a crucial moment in what will be its economic future. This happens because the tertiary sector is in a process of vertiginous growth that could be even more favored with the completion of the Santa Lucía airport located just 11 kilometers from the center of Tizayuca with an estimated transfer time of 20 minutes.
On the other hand, the secondary sector faces a scenario of opportunities caused by the recent construction of the PLATAH project (Logistic Platform of Hidalgo State), which to date has a total investment of 167 million dollars and opens a range of opportunities for the four municipalities that make up the region (PLATAH, 2019). Barre (1964, p. 147) says: "es deseable, pues, que la inversión se concentre en puntos estratégicos, de donde el crecimiento se difundirá progresivamente al conjunto de la economía y que favorezca la aparición de actividades complementarias, que se reforzarán mutuamente."
Faced with this scenario, the actors within the micro-region XVI, whether public or private, have two options: 1) remain defenseless and act as mere observers of the transformation process of the territory, or 2) continue undertaking joint projects that allow them to make the most of the advantages and the productive vocation that the territory has through external economies of scale. Baumgartinger-Seiringer, Simon; Johan, Miörner; and Michaela, Tripply (2021) argue based on various authors:
"Regional industrial path development and transformation will only unfold if local (and non-local) actors harness and valorize the regional asset base (MacKinnon et al., 2019). In contrast to firm-centred views prevailing in conventional EEG models, systemic perspectives of path development (Tödtling and Trippl, 2013) suggest adopting a multi-actor approach. In line with this view, our framework appreciates the role played by non-firm actors such as universities or research institutes (Vallance, 2016), policy actors, support organisations, intermediaries (Dawley, 2014), and so on."
With the argument that it is more fruitful to plan and undertake projects than to be just an observer, this chapter will focus its attention on finding the productive vocation of the micro-region XVI. Any policy or study that seeks to generate economic development through the implementation of a single strategy, such as political, economic, or social, will surely fall into a theoretical bias that, when faced with reality, will stumble. In other words, these types of strategies implemented in isolation have positive effects on a single variable. The opposite is the economic development that benefits many areas, such as the development of infrastructure, the creation of jobs, the emergence of universities, greater governance, and a decrease in the levels of insecurity, among many others.
One of the main strategies to be generated must focus on the economic sphere, since, as Amartya Sen mentions, "all empirical studies about successful development experiences have demonstrated the crucial role of capital accumulation" (Sen, 1999, pp. 80-81). This means that, for a territory to achieve development, the generation of wealth is indisputably required.


