


 English (pdf)
 Article in xml format
 Article references
 Send this article by e-mail
 Cited by SciELO
  Cited by Google
  Similars in
SciELO
Similars in
SciELO  Similars in Google
 Permalink
INTRODUCTION
The varying levels of thermal energy affect the development of many crops in their phenological stages (Kukal and Irmak, 2018; Shivers et al., 2019). Phenology is documented through periodic and systematic observations of a variety of plant species over time. This information is used to understand trends and patterns in plant life cycles, their growth and their relationship with seasonal and climatic changes. The phenological development stages depend on interactions between genetic and environmental conditions, particularly air temperature (Chaves et al., 2017). Thus, phenological studies enable the evaluation of fruit crop adaptation by determining local climatic conditions and applying this knowledge to improve crop management practices (Cepeda et al., 2021; Pinzón-Sandoval et al., 2021).
Calendar time is used to predict crop growth and development stages (Leguízamo-Medina et al., 2022; Pinzón-Sandoval et al., 2022). Furthermore, some models have been proposed and adjusted to use the calendar time in predicting crop development, highlighting the predominant effect of temperature on phenological development (Criollo-Escobar et al., 2020). Several methods for determining growing degree days (GDD) or thermal time involve calculating the sum of the difference between the mean temperature and the base temperature (or temperature base, Tb), estimated from the mean temperature of daily maximum and minimum temperatures (Cepeda et al., 2021; Pinzón-Sandoval et al., 2022). The GDD method is one of the most widely recognized for describing fruit growth, as it is independent of specific dates (Orjuela-Angulo et al., 2022). GDD for each phenological phase is also known as thermal time, physiological time, or heat units (López et al., 2014). To apply this method, a value of Tb or the critical or minimum temperature required for crop development is established. It is understood that crops will not advance in their growth if the daily temperature is below this base value (Parra-Coronado et al., 2015a; Woznicki et al., 2019).
The Tb varies for each plant phenological stage, as reported in different fruit crops (Parra-Coronado et al., 2015a; Orjuela-Angulo et al., 2022). Estimating Tb in GDD is possible through several statistical methods, including the least standard deviation in days, the lowest coefficient of variation, or linear regression using the methods of regression coefficient and intersection x (Parra-Coronado et al., 2015a). The base temperature that results in the least variance of GDD accumulation (thermal or physiological time) provides a measure of accumulated heat over a specified time (Salazar-Gutiérrez et al., 2013; Parra-Coronado et al., 2015a; Akbar, 2019). The accumulation of daily mean temperature is a widely used procedure in agriculture. This method is based on quantifying the amount of degree days needed to complete a phenological phase (Pinzón-Sandoval et al., 2021; Leguízamo-Medina et al., 2022). It is important to determine the temperature requirement for each crop to predict changes in the phenological stage.
The accuracy of thermal time models allows the prediction of various development stage dates (Salazar-Gutiérrez et al., 2013). These predictions are partially dependent on the precision of the Tb, indicating the need to determine the critical temperature at each phenological stage (Díaz, 2020). Once the Tb has been identified, it is possible to identify the moment when the stages cease their metabolic processes (Orjuela-Angulo et al., 2022). Various models exist for predicting climates and crops, which interact in various ways with crop phenology and in turn the physiological thermal time of each plant (Cepeda et al., 2021; Pinzón-Sandoval et al., 2022).
Degree days measure the combined effect of time and temperature on the development of any living organism; as the temperature increases, the cycles of these living beings generally decrease (Leguízamo-Medina et al., 2022; Orjuela-Angulo et al., 2022). Thermal time is expressed as the number of heat units required to complete plant development (Leguízamo-Medina et al., 2022; Orjuela-Angulo et al., 2022). In agriculture, GDD have been shown to be a useful and reliable tool for determining the ripening date of fruits. This method is based on monitoring and accumulating thermal units over time, allowing for a more accurate prediction of when fruits will reach their optimal ripening (Parra-Coronado et al., 2015a). The degree day model, based on the accumulation of thermal units above the base temperature threshold, is a simple and valuable tool for predicting the vegetative and reproductive development of plants (Salazar et al., 2008; Parra-Coronado et al., 2015a). However, this model also has certain limitations associated with the impact of extremely high or low temperatures on crop growth (Woznicki et al., 2019).
The accumulation of GDD has been calculated in several fruit trees including 'Hass' avocado (Ramírez-Gil et al., 2023), peach (Pinzón-Sandoval et al., 2021; 2022), apple (Cepeda et al., 2021), European plum (Shivers et al., 2019), lulo (Criollo-Escobar et al., 2020), cape gooseberry (Salazar et al., 2008; Syropoulou et al., 2022), banana passion fruit (Mayorga et al., 2020), and feijoa (Parra-Coronado et al., 2015a). Most of these fruit trees are grown in high tropics.
The Japanese plum (Prunus salicinaLindl.) is considered the most promising crop in the Boyaca department, located in the eastern mountain range of Colombia, at elevations between 1,800 and 2,800 m a.s.l. (Fischer et al., 2022; Gutiérrez-Villamil et al., 2024). It is fundamental to new production models (Serrano et al., 2021). This Japanese plum is a deciduous species, requiring fewer chill hours to break winter dormancy than European plum (Prunus domestica L.), making it better adapted to high tropical zones (Campos, 2013; Gutiérrez-Villamil et al., 2024). In Colombia, 80% of Japanese plum crops are of the Horvin variety, marketed nationwide in cities such as Cali, Popayan, and Bogota, among others (González-Romero et al., 2018). This crop has been established as an alternative for a sustainable economy by small and medium producers (Campos, 2013; Gutiérrez-Villamil et al., 2024). A Tb of 2.9ºC was reported for the period between fruit set and harvest in P. salicina (Orjuela-Angulo et al., 2022). However, the Tb for the other fruit phenological stages, which would serve as a technical tool for better crop management by allowing the accurate identification accumulation of GDD in Andean zones, is still unknown. Considering the above, the objective of this study was to determine the base temperature and thermal time for phenological stages between floral bud and fruit harvest of 'Horvin' plum under high tropical Colombian conditions.
MATERIAL AND METHODS
Study areas, plant material and growing conditions
The study was conducted in two localities in the municipality of Nuevo Colon, Boyaca department (Colombia). Locality A (Blanca farm, 5º20'17.56” N and 73º27'53.85” W) is at an elevation of 2.195 m a.s.l., and locality B (Ana farm, 5º21'26.5” N and 73º28'10.8” W) is at an elevation of 2,567 m a.s.l. These two farms had rootstocks of 'Durazno blanco común', grafted with scions of the Japanese plum, Horvin variety (Prunus salicina Lindl.) with an age between 20 and 30 years. In the study, 10 trees were selected from each row, with 2 rows per farm (locality), totaling 40 trees.
The study area is characterized by a cold, humid climate with “Thornthwaite classification” B2d B1 and mean temperature of 15.6 to 23.4ºC for the two localities. Precipitation in this area has a monomodal behavior, with average annual precipitation values of 877.2 mm.
The study was conducted in two phases. In the first phase, the Tb was calculated. In the second phase, the duration in GDD was estimated in order to predict the periods of floral bud-anthesis, anthesis-fruit set, and fruit set-harvest. The study included the recording of the floral bud date and daily meteorological data such as relative humidity, temperature (including maximum and minimum temperatures in ºC), precipitation, and solar radiation for each locality. The data was collected over three harvest cycles.
For temperature and relative humidity records in each locality, UNI-T brand USB data loggers, with an accuracy of ±0.5°C (UT330B IP67, Osaka, Japan) and a data collection frequency set to every 20 min were used. To determine precipitation in each plot, 35 mm capacity rain gauges from the Opitec brand (Rocafort-Barcelona, Spain) with height of 24.5 cm, upper diameter of 9 cm and lower diameter of 3.3 cm, were installed in each locality, taking measurements each time a rain event occurred. Solar radiation was measured using a CHP1 Inmisión IEC 100-4-4 pyrheliometer (Delft, Netherlands) with radiant flux from a solid angle of 5°, and a receiving surface that captures the radiation incident perpendicular to its surface.
The phenological stages are presented in table 1 and the dates of the phenological stages are described in table 2. In this study, the date of the fruit set was reported at 17 d after observing the floral cluster.
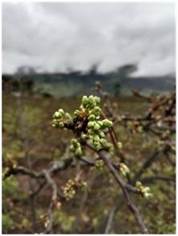
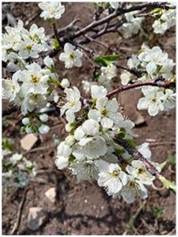
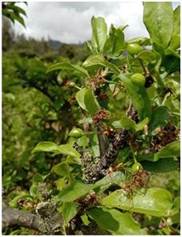
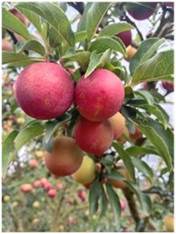
Table 1. Phenological stages of 'Horvin' plum evaluated in this study.
| Floral bud | Anthesis |
|
|
| Fruit set | Ripe fruit |
|
|
Table 2. Recording dates for the phenological stage of floral bud-anthesis, anthesis-fruit set, fruit set-harvest for the 'Horvin' plum, during three harvest cycles.
| Phenological stage | Harvest | Locality A (2,195 m a.s.l.) | Locality B (2,567 m a.s.l.) |
|---|---|---|---|
| Flower bud marking | 1 | June 20, 2021 | August 6, 2021 |
| 2 | March 27, 2022 | March 12, 2022 | |
| 3 | August 20, 2022 | August 24, 2022 | |
| Flower emergence | 1 | July 18, 2021 | August 26, 2021 |
| 2 | April 7, 2022 | April 4, 2022 | |
| 3 | September 13, 2022 | September 26, 2022 | |
| Fruit set | 1 | August 3, 2021 | September 15, 2021 |
| 2 | April 22, 2022 | April 25, 2022 | |
| 3 | September 29, 2022 | October 17, 2022 | |
| Harvest | 1 | September 25, 2021 | November 29, 2021 |
| 2 | Jun 25, 2022 | Jun 30, 2022 | |
| 3 | November 24, 2022 | December 11, 2022 |
Similarly, cultivation practices were recorded in each location to determine their impact as input variables on the output or response variables. Crop management, including fertilization, pruning, pest and disease control and other procedures, was carried out according to established practices in the region.
Estimation of base temperature (Tb)
The Tb was estimated for the three plum fruit phenological stages: from floral bud-anthesis, anthesis-fruit set, and fruit set-harvest. The sum of the temperatures recorded in each studied location was made for each phenological stage from floral bud. Then, the coefficient of variation (CV) of the calculated heat units (GDD) was minimized, based on a temperature range between 0 and 12°C, for each of the different stages considered in this study, according to the proposal by Parra-Coronado et al. (2015b).
The determination of the optimal temperature for the Tb of each stage is based on identifying the temperature at which the lowest coefficient of variation is achieved, using a second-degree regression model (Orjuela-Angulo et al., 2022). The Solver tool for Excel® was used for the estimation of Tb. Solver is an iterative nonlinear procedure. The process begins by using a set of initial values for the parameters of the equation. Then, using the Solver tool, these values are gradually adjusted, either increased or decreased, to determine the minimum value of the deviations. The deviation refers to the difference between the values obtained from the equation and the actual or expected values (Parra-Coronado et al., 2015a).
Estimation of thermal time (GDD)
One degree day is accumulated when the average daily temperature is 1 degree higher than Tb, for a period of 24 h (Parra-Coronado et al., 2016). For this study, it was necessary to know the date of bud appearance in each location and harvest.
Thermal time was calculated based on the difference between Tb and the average temperature, and the daily sum was then deduced (Eq. 1),
where TT is the accumulated thermal time (ºC d) over n days until the appearance of the stage, from fruit set to harvest, Ti is the daily average temperature (ºC) for day i and Tb is the base temperature (ºC). The GDD, for the accumulation of TT, are calculated using the following considerations (Eq. 2, 3 and 4):
where Tmax is the maximum temperature (ºC) for day i and Tmin is the minimum temperature (ºC) for day i (Orjuela-Angulo et al., 2022).
Processing and data analysis
The GDD model was developed by applying the necessary dataset for the identification of floral bud, anthesis, fruit set, and harvest. With the estimated Tb, the thermal time from floral bud to harvest was obtained for each location (farm), and these times were averaged for the considered phase.
The mean thermal time obtained from two different study areas was used to evaluate the proposed model, providing a representative value of the accumulated temperature during the study period. Subsequently, this mean thermal time value was determined based on a series of equations and parameters to simulate the behavior of certain phenomena or variables, in order to evaluate the accuracy and reliability of the model by comparing the simulated values with the observed values in both study areas. The linear model exhibited greater fit than the other models evaluated, including logistic, exponential, and logarithmic models (data not shown).
This cross-validation employed a double-sample, leave-one-out method that uses all input points to first estimate the parameters of one interpolation model and then the others. This type of validation allowed the visualization of the data in the proposed model. The coefficient of determination (R 2), the agreement index (Eq. 5), and the growth curves simulated with the adjusted mathematical method correctly described the behavior of GDD and its TT. For the different thermal time measurements, the values from bud to flower (for the three harvests) were 465.32, from flower to fruit set were 322.76, and from fruit set to harvest were 1,207.91. Thus, the evaluated thermal time variable is confirmed as an adequate criterion for determining thermal time throughout the phenological stage of the crop, with good GDD performance for the establishment of the cultivar under observed and estimated conditions (Orjuela-Angulo et al., 2022; León-Burgos et al., 2022).
where (n) is the number of observations, (P i ) the predicted value for the i-th date, and (O i ) the observed value for the i-th date, P i ’ = P i − Ō and 0 i ’ = 0 i − Ō, where the overall mean of the observed values is Ō (Parra-Coronado et al., 2015a).
RESULTS
Climatic conditions and floral buds
Regarding the climatic conditions during the three cycles of phenological stages across the two farms and elevations, notable differences were observed (Tab. 3). In locality A (2,195 m a.s.l.), the averages for the three cycles were: mean temperature 23.36°C; radiation 6.6 kW m-2; average relative humidity (RH) 79.9%; and total accumulated precipitation 1,085.9 mm. In locality B (2,567 m a.s.l.), the values were 15.96°C; 7.4 kW m-2; 91.7%; and 1,352.6 mm, respectively. Therefore, locality A had a higher temperature, but lower values of radiation, RH, and accumulated precipitation.
Floral bud amount differed between the two locations (Tab. 3). In locality B, at 2,567 m a.s.l., there were fewer floral buds (2,726) and therefore fewer fertilized units (246) for the three harvests, while in locality A, at 2,195 m a.s.l., the amount of floral bud for the three harvests was 3,070, with 282 fertilized units.
Table 3. Temperature, solar radiation, relative humidity, and precipitation for the stage from floral bud to harvest, floral bud amount, and number of fertilized units for each locality.
| Locality | Harvest | Mean temperature (°C) | Solar radiation (kW m-2) | Relative humidity (%) | Precipitation accumulated (mm) | Amount of floral buds | No. fertilized units |
|---|---|---|---|---|---|---|---|
| Locality A (Blanca farm, 2,195 m a.s.l.) | 1 | 20.14 | 6.6 | 86.6 | 1,285.2 | 880-1100 | 80 |
| 2 | 24.57 | 6.7 | 79.8 | 1,122.2 | 895-1126 | 92 | |
| 3 | 25.36 | 6.5 | 73.4 | 850.2 | 920-1220 | 110 | |
| Locality B (Ana farm, 2,567 m a.s.l.) | 1 | 15.61 | 7.2 | 91.6 | 1,489.3 | 850-950 | 91 |
| 2 | 15.92 | 7.4 | 92.5 | 1,222.9 | 870-950 | 84 | |
| 3 | 16.36 | 7.6 | 91.1 | 1,345.5 | 905-928 | 71 |
Estimation of base temperature (Tb)
Since Tb is essential for fruit development, some statistical methods have been performed to obtain it in a simpler way. The values that had an appropriate fit were those found by the coefficient of variation method. These were 2.84°C with R 2=0.99 for the phenological stage of floral bud to anthesis (Fig. 1). For anthesis to fruit set, Tb was 3.05°C and R 2=0.99 (Fig. 2), Finally, for fruit set until fruit harvest, Tb was 1.76°C, with R 2=0.99 (Fig.3).
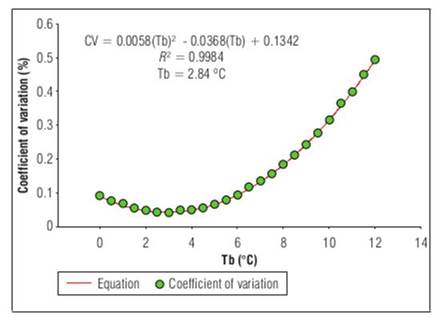
Figure 1. Base temperature (Tb), estimated by the coefficient of variation, from the flower bud to the appearance of the flower in 'Horvin' plum, cultivated in tropical conditions, where the base temperature is a function of the coefficient of variation, which is a dependent variable, where n-corresponds to the base temperatures obtained from least squares for each phenological stage.
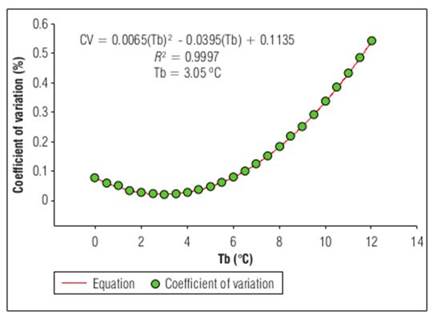
Figure 2. Base temperature (Tb), estimated by coefficient of variation, from flower to fruit set for 'Horvin' plum, cultivated in tropical conditions, where the base temperature is a function of the coefficient of variation, which is a dependent variable, where n-corresponds to the base temperatures obtained from least squares for each phenological stage.
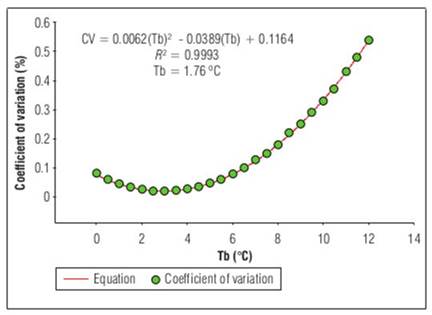
Figure 3. Base temperature (Tb), estimated by coefficient of variation, from fruit set to ripe fruit for 'Horvin' plum, cultivated in tropical conditions, where the base temperature is a function of the coefficient of variation, which is a dependent variable, where n-corresponds to the base temperatures obtained from least squares for each phenological stage.
Estimation of thermal time (GDD)
Japanese plum cultivation varies according to the thermal time and the number of days needed to reach each phenological stage. Values of GDD for the stages from floral bud to harvest, for the two study locations are presented in table 4. The lowest accumulation of GDD was from anthesis to fruit set, followed by floral bud to anthesis, while the highest accumulation of GDD was observed from fruit set to harvest with 1,243.17 and 1,172.12 GDD for Locality A and B, respectively.
According to the phenological stages, Japanese plum cultivation requires 465.31 GDD from floral bud to anthesis, 322.75 GDD from anthesis to fruit set, and 1,207.64 GDD from fruit set to harvest. This indicates that the time required to go from floral bud to harvest in calendar days varies from 94.1 for locality A, compared to 110.3 d for locality B, meaning the farm at 2,567 m a.s.l., needed about 16 more days to complete its reproductive phase (Tab. 4).
Table 4. Thermal time (GDD) and calendar time (d) for the phenological stages of 'Horvin' plum fruit in study localities A (2,195 m a.s.l.) and B (2,567 m a.s.l.).
| Developmentstage | Tb (ºC) | Thermal time (GDD) | Calendar time (d) | ||
|---|---|---|---|---|---|
| Locality A | Locality B | Locality A | Locality B | ||
| From floral bud to anthesis | 2.84 | 459.09±130.22 | 471.54±91.14 | 21.0±7.25 | 20.3±0.47 |
| From anthesis to fruit set | 3.05 | 306.82±42.90 | 338.69±32.20 | 15.33±0.47 | 20.33±0.48 |
| From fruit set to harvest | 1.76 | 1,243.17±199.92 | 1,172.12±41.43 | 57.66±4.92 | 69.6±3.39 |
The number of days required from floral bud to anthesis varies from 21 d (locality A) to 20.3 d (locality B); for anthesis until fruit set, it varies from 15.3 d (locality A) to 20.3 d (locality B); and from fruit set to harvest, it ranged from 57.7 d (locality A) to 69.6 d (locality B), as presented in table 4.
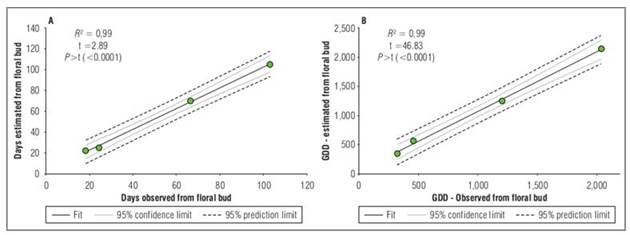
The validation of the models using the cross-validation method between predicted and observed days (Fig. 4A) shows that the model accurately predicts the number of days to reach each phenological stage when the estimated Tb value was determined for each stage. The intercept and the slope are close to 1, which indicates a good fit between the estimated (y) and observed (x) values, as well as a high R 2. For the validation of the models, the cross-validation method between observed and estimated GDD was used (Fig.4B). The analyses show that the model accurately predicts the GDD required to reach each phenological stage. It was also observed that the intercept is not significantly different, and the slope is equal to 1. These results show a good fit between the estimated (y) and observed (x) values, as well as a high coefficient of determination.
DISCUSSION
The environmental conditions varied in the evaluated locations (Tab. 3), despite being at the same thermal level. These climate variations influenced the number of days required from floral bud until harvest in Japanese plum (Tab. 4), as previously reported by Trbic et al. (2022). Variables such as temperature, precipitation, solar radiation, and evapotranspiration also affect data collection for Tb calculation (Parra-Coronado et al., 2015a). Likewise, the climatic conditions influence, among other factors, the duration of phenological phases of the cultivar, fruit ripening, harvest times, and overall crop growth (Ramírez-Jiménez et al., 2021). This has been related to the temperature and relative humidity control in the fruit development and growth rate (Zhang et al., 2022), as reported for P. salicina by Orjuela-Angulo et al. (2024).
The 'Horvin' plums developed from floral bud to harvest in 94 d at 2,195 m a.s.l. farm, while at the higher and colder location, at 2,567 m a.s.l., it took 110 d. This longer duration in fruit development with increasing elevation in the Cundiboyacense region of Colombia was also found by Fischer et al. (2007) in cape gooseberry at 2,300 and 2,690 m a.s.l. (66 and 75 d), and Parra-Coronado et al. (2015a) in feijoa at 1,800 and 2,580 m a.s.l. (168 and 209 d, respectively). These results corroborate that at higher elevations, development is prolonged, mainly due to lower temperatures that slow down metabolism (Fischer et al., 2024; 2022). This behavior of prolonging phenological phases at higher sites was also observed in the period from anthesis to fruit set, which required 20.3 d at 2,195 m a.s.l., compared to only 15.3 d at 2,567 m a.s.l.
According to the average temperatures recorded in the two locations (Tab. 3), the higher the elevation, the lower the temperature, a trend that has been shown to occur in mountainous regions (Fischer et al., 2024; 2022; Parra-Coronado et al., 2022). It has been found that temperature falls by between 0.6 and 0.7°C per 100 m increase in elevation (Benavides et al., 2017), which agrees with the records in this study (Tab. 3). In contrast to temperature, solar radiation increases with increasing elevation in the study area, including ultraviolet radiation, because the atmospheric layer is thinner in higher areas and therefore filters less solar rays (Benavides et al., 2017). This can bring advantages in fruit coloration, an important aspect in the commercialization of 'Horvin' plum (Fischer et al., 2022).
On the other hand, precipitation increased by 266.7 mm at 2,567 m a.s.l. compared to 2,195 m a.s.l., which contrasts with Benavides et al. (2017), who suggest that precipitation shows an inverse relationship with solar radiation. This finding is probably due to the very particular microclimate in the area of the Nuevo Colon municipality where the study was carried out, where there is only one (prolonged) rainy season per year, compared to the rest of Boyaca and Cundinamarca departments, where two rainy seasons per year prevail. In this regard, Manz et al. (2016) indicate that precipitation patterns in the Andes are not sufficiently recorded due to their high spatial-temporal variability and the deficient network of rain gauges.
Since the production of floral buds for each location occurred in similar proportions, environmental conditions with a predominance of dry days increased the number of fertilized individuals in the floral clusters. This is similar to the findings of Orduz-Ríos et al. (2020), who state that the production of Japanese plum flowers is affected by the temperature and wind speed in the cultivation areas. Additionally, in locality B (2,567 m a.s.l.), it was observed that when ambient temperatures were below Tb, particularly during frosts in January and February, floral and newly set fruit organs suffered sudden detachments. The reason for the dropping of these organs due to frosts is that the surfaces of the tender and outer tissues of the flowers and newly set fruits cool below the temperature of the surrounding air as a result of heat exchange, which causes damage to the intracellular compartments and cell membranes (Voronkov et al., 2019). This situation occurs especially on clear nights in high tropical areas. To avoid this form of damage in tree production, the fruit grower should schedule management practices so that the plants do not present these susceptible states during the coldest months of the year in high tropics.
The accumulation of thermal time for the first two phenological stages during the reproductive phase of 'Horvin' plum at 2,195 m a.s.l. is lower than for the location at 2,567 m a.s.l., while for fruit development from floral bud or fruit set, this relationship is reversed. This result indicates that the temperature accumulation during fruit development at the lower elevation is higher than at the higher elevation. This behavior agrees with what was reported by Pérez de Camacaro et al. (2017), where fruits such as strawberries were affected by the environmental conditions in which they develop.
The lower accumulation of thermal time of the crop at 2,567 m a.s.l., mainly caused by the lower temperature at this elevation, led to the prolongation of fruit development by 12 d from its fruit set and by 16 d from the floral bud, compared to the lower elevation. This characterization is presented in table 4, where the calendar time was greater for locality B, but inversely proportional to the accumulation of thermal time. This behavior is similar to that indicated by Salazar-Gutiérrez et al. (2013).
In many studies to determine the Tb in thermal time estimation, a standard temperature of 10°C has been used; however, in studies similar to the present one at tropical elevations, a different Tb was found for each of reproductive phenological states (Mayorga et al., 2020), which was almost always lower than 10°C (the 'standard Tb'). Thus, for the estimation of the Tb in the different stages of 'Horvin' plum development, the value is not constant but falls within a range between 1.76 and 2.84°C. Specifically, Tb was 2.84°C from floral bud to anthesis, 3.05°C from anthesis to fruit set, and only 1.76°C from fruit set to harvest. These results complement the reports of Orjuela-Angulo et al. (2022), who estimated a single value of 2.9°C. In this regard, Pinzón-Sandoval et al. (2022) indicate that knowing the climatic conditions of the cultivation site, plus the Tb at each stage of plant development, allows for better adaptation and application of good agricultural practices, leading to optimal crop management.
The lower Tb for the development of 'Horvin' plum fruit of 1.76°C could be because the growing fruits are already better acclimated to the low temperatures of an orchard at altitude (Salazar et al., 2008; Parra-Coronado et al., 2015a) and present structures that are not as susceptible to cold compared to flowers or floral buds (Nicolás-Almansa et al., 2023). For the growth of cape gooseberry fruit, Salazar et al. (2008) calculated a Tb of 1.9°C, while Mayorga et al. (2020) found a Tb of only 0.01°C for banana passion fruit, which is a fruit plant that tolerates mild frosts.
As the results show, the calculation of the Tb is significant for each of the phenological states, allowing the generation of growth and development models and their related simulation, suggesting that the application of a single Tb value is not recommended (Orjuela-Angulo et al., 2022; Parra-Coronado et al., 2015a).
It is important to specify that in the two locations, there were no major temperature variations between the days of observation. However, changes occurred from one elevation to another, consistent with the findings of Orjuela-Angulo et al. (2022) for Japanese plum in four locations in the same area. This variability between the two study locations includes the calculation of thermal time (compared to calendar time alone), which can explain the differences in fruit maturity when comparing observations made in different seasons (Almanza-Merchán and Balaguera-López, 2009).
The 'Horvin' cultivar differs in the GDD required to reach each phenological state. Specifically, for the stage from floral bud to harvest for the location at 2,195 m a.s.l., the required thermal time was 2,054.78°C, while for the farm at 2,567 m a.s.l., it was 2,033.62°C (Tab. 4). Similar results were obtained by different authors who determined the GDD in different environments for each phenological stage in different cultivars. Parra-Coronado et al. (2015a) determined the GDD for each of the phenological stages in the Quimba feijoa cultivar, finding that 196 GDD were required from floral bud to anthesis, 116 GDD from anthesis to fruit set, and 2,651 GDD from fruit set to fruit harvest. For 'Sampion' and 'Ligol' apples, 2,550 and 2,600 GDD, respectively, are required to reach harvest from full bloom, using a Tb of 0°C (Lysiak, 2012). Stenzel et al. (2006) considered a Tb of 12.8°C, finding that the thermal sum for the growth and ripening of 'Folha Murcha' orange fruit in Londrina and Paranavaí (Brazil) is in the range of 4,462 to 5,090 GDD. Finally, the parameters of the regression analysis and cross-validation show that the proposed models can predict the exact days of phase change (Pérez-Planells et al., 2015).
CONCLUSIONS
The results suggest that thermal time and base temperature requirements for the Japanese plum cv. Horvin vary depending on the elevation where the cultivation is established under Andean tropical conditions. The Tb values vary depending on the phenological stage: 2.84°C from floral bud to anthesis, 3.05°C from anthesis until fruit set, and 1.76°C from fruit set to harvest. Therefore, this variety should be grown where there the minimum temperature of during the reproductive phase is at least 3.05°C.
The study also found differences in the number of days required for plum fruit development between the two locations. At locality A, the duration was 57.7 d from fruit set to harvest, while at locality B, it was 69.6 d. The GDD were 1,243.17 for locality A and 1,172.12 for locality B. Therefore, the values for Tb and thermal time are very important tools for selecting suitable areas for cultivation and making decisions in the crop management practices of 'Horvin' plum under tropical conditions.

