


 English (pdf)
 Article in xml format
 Article references
 Send this article by e-mail
 Cited by SciELO
  Cited by Google
  Similars in
SciELO
Similars in
SciELO  Similars in Google
 Permalink
INTRODUCTION
The potential of lulo cultivation lies in its flavor, aroma and nutritional and organoleptic properties (Lagos-Santander et al., 2019). Agronomic traits such as yield and fruit quality have differential behavior depending on the producing areas and time. Factors such as genetic variability, production systems, acceptance by consumers, agro-industrial potential, and the possibility of integrating them into the processes of reconversion from illicit crops to productive land, favor their development (Lagos et al., 2020).
Lulo is a species of fruit in the process of domestication. It has a high level of heterozygosity, stability in specific niches, and generally narrow adaptability. The response of the lulo crop depends on the influence of the environment on the genetic expression of the plant, which can favor or limit the expression of the genetic potential (Lagos et al., 2020). In the absence of stress, conditions can occur that permit high yields and better production quality, while under conditions of biotic stress, physiological disorders appear in plants that reduce the quality and production of the crop (Lagos, 2023).
It is important to determine the differential behavior of the genotypes or the degree of genotype environment interaction (GEI). This behavior manifests independently according to the degree of presence of interaction in each of the environments where these genotypes are evaluated. It is also necessary to determine which genotypes have the lowest degree of this interaction without compromising yield, as these are considered as stable (Mejia-Salazar et al., 2020).
The additive and multiplicative main effects model of interaction (AMMI) is one of the most widely used statistical methods to explain the proportion of sum of squares due to GEI. It separates the main effects from interaction effects. This increases precision and ensures recommendations, selection, and genetic gains of genotypes (Gauch et al., 2008). Usually, the results of AMMI analysis are expressed in plots called biplots that contain the values of genotypes and environments using the singular vector technique (Szareski et al., 2017). The biplot takes advantage of the PCA approach to study data from multiple environments, allowing visualization of the relationship between genotypes, environments, and their interactions.
The AMMI model has been widely used in Solanaceae to assess the performance of genotypes in terms of yield adaptability and stability. Cadersa et al. (2022) evaluated the yield of commercial tubers of 18 advanced potato clones compared to the commercial variety Spunta in four environments in France, identifying stable and specifically adapted clones. Ceballos-Aguirre et al. (2022) identified optimal environments for variables associated with cherry tomato yield and promising genotypes by environment across different Colombian departments. Santacruz-Benavides et al. (2021), identified the GEI for 21 potato wadding genotypes in the department of Nariño, highlighting promising genotypes in terms of yield.
The hypothesis tested was that the environment would not affect the biological processes of different families of lulo's half-siblings and that this lack of effect would be reflected in a uniform response of these families to the environmental conditions in San Pedro de Cartago, Arboleda, Tangua and La Union. Based on the above, the objective of this work was to estimate the effect of GEI on yield and fruit quality in half-sib families using the AMMI model and to identify the most stable families to make decisions about their usefulness, either as parents in crossing programs or for use by farmers.
MATERIALS AND METHODS
Ten half-sib families (10HSF) selected from a first cycle of a recurrent selection of 50 HSF of lulo were evaluated. These 50 HSF were selected for their agronomic performance under a stratified selection scheme. The evaluation was carried out in four medium climate localities of the natural Andean region of the department of Nariño located between 1,700 and 2,100 m a.s.l. during the years 2014 to 2016. The 10 HSF were selected based on their good performance related to growth, yield and fruit quality variables. These families were evaluated in four trials located in the municipalities located in the department of Nariño (Tab. 1). In addition, a control was included, corresponding to ‘lulo de Castilla’, a cultivar widely accepted in national markets for its multiple uses as fresh fruit. Table 2 shows the most important characteristics of the 10 HSF evaluated.
Table 1. Climatic variables, fertility, and soil texture of the locations (Colombia) used for the evaluation of 10 FMH of lulo (Solanum quitoense).
| Locality | T (°C) | PP (mm) | Latitude (North) | Longitude (West) | RH (%) | Soil fertility | Soil texture |
|---|---|---|---|---|---|---|---|
| San Pedro | 18 | 2,396 | 01°32’24.8” | 77°08’07.7” | 93 | High | Cl |
| La Union | 19 | 1,405 | 01°29’3.7” | 77°13’47.3” | 83 | Medium | L-Cl-S |
| Tangua | 16 | 2,420 | 01°3’44.74” | 77°25’12.2” | 79 | Medium | Cl |
| Arboleda | 19 | 2,219 | 01°30’45.0” | 77°08’42.0” | 80 | High | L-Cl-S |
Texture: L: loam; Cl: clay; S: sand. T: temperature; PP: precipitation; RH: relative humidity: Source: adapted from Atlas Climatológico (IDEAM, 2010).
Table 2. Characteristics of fruit weight (FW), yield, seed/pulp ratio (RSP), fruit volume (VOL), respiration (IR) and ascorbic acid (AA) of 10 HSF of lulo (S. quitoense) evaluated in four localities of the department of Nariño.
| HSF | FW (g) | Yield (t ha-1) | AA (mg/100 g) |
|---|---|---|---|
| 1 | 88.44 | 8.88 | 34.00 |
| 4 | 88.35 | 9.57 | 38.77 |
| 7 | 105.23 | 9.53 | 37.31 |
| 22 | 100.44 | 8.19 | 32.39 |
| 25 | 105.33 | 9.10 | 34.74 |
| 28 | 97.43 | 9.02 | 30.39 |
| 29 | 98.25 | 10.91 | 29.94 |
| 36 | 92.97 | 8.61 | 32.93 |
| 45 | 97.25 | 6.96 | 34.93 |
| 49 | 110.78 | 9.92 | 40.18 |
| Control (‘lulo de Castilla’) | 107.73 | 8.83 | 31.08 |
Data on fruit weight in g (FW) and ascorbic acid (AA) was obtained from 20 fruits per sample from the useful plot. Ascorbic acid (AA) was determined by Reflectoquant® previously calibrated for the measurement of ascorbic acid. A dilution of 10 mL of filtered lulo juice was made using 20 mL of oxalic acid; the mixture was homogenized and left to stand. Since the equipment gives the data in mg L-1 of solution, a correction of units was carried out using the following formula (Eq. 1)
where, AA was ascorbic acid content (mg/100 g), SV solution volume (mL), SaV sample volume (ml), and SW sample weight (g).
Yield in t ha-1 was also evaluated by measuring total weight of fruit produced in the useful plot during the 10-months production cycle.
At each location, a trial was established under a randomized complete block design with 11 treatments and four replications. The experimental area of each trial was 2,160 m2. The experimental plot consisted of a row of six plants planted at distances of 2.5 × 3.0 m, for an area of 45 m2. The useful plot was 30 m2 where four central plants were used to avoid the border effect.
The data obtained for the variables evaluated were subjected to a combined analysis of variance (ANOVA). When the genotype by environment interaction (GEI) was significant, an analysis of the effect of environment on each of the HSF was performed.
The statistical model of the combined ANDEVA used was (Eq. 2):
where, Yijk was response variable of the k-th genotype in the j-th block and i-th environment, µ overall mean, Li effect of the i-th environment, B(L)ij effect of the j-th block within the i-th environment, Gk effect of the k-th genotype, (GxE)ik effect of the genotype-by-environment interaction, eijk error associated with the response variable Yijk.
The analysis of the genotype-by-environment interaction was done using the additive main effects model and multiplicative interaction - AMMI (Mandel, 1971; Zobel et al., 1988; Kangs and Zobel, 1996) with the following model (Eq. 3):
where, Y gl was response variable of each HSF and control at location 1, μ overall mean of the variables evaluated, α g deviations of the averages of HSF and the control, β l deviations of the location means, n number of principal components (PC) retained in the PCA with n = 1, 2, .., N, λ n eigenvalue for the nth interaction principal component, Y gn eigenvectors for each genotype, δ ln eigenvectors for each environment, and ρ gl residual.
For each HSF, the average stability value (ASV) of AMMI was calculated, which corresponds to the distance from the coordinate point to the origin on a two-dimensional plot of PC1 scores versus PC2 scores (Al-Naggar et al., 2020). PC1 scores contribute more to the sum of squares of AMMI; therefore, a weighted value is needed and is calculated as follows (Purchase et al., 2000) (Eq. 4)
where, SSCP1 was sum of squares of PC1 of the first AMMI model, SSPC2 sum of squares of PC2 of the second AMMI model, iPC1s scores of each HSF in the interaction of PC1, and iPC2s scores of each HSF in the interaction of PC2.
If the negative or positive ASV value is of high magnitude, it was determined that a HSF presented specific adaptations to certain environments. On the other hand, if the ASV value was smaller, the HSF was more stable across environments (Farshadfar et al., 2011; Al-Naggar et al., 2020). For yield, the YSI stability index is also calculated (Farshadfar, 2008), corresponding to: YSI = RASV + RY, where RASV is in the range of the AMMI stability value (ASV) and RY is in the range of the average yield of genotypes across all environments. YSI incorporates both yield and stability into a single criterion. The low value of this parameter shows desirable genotypes with high yield and stability. Based on YSI, for FW and AA, the selection index SI = RASV + RY was calculated. In this case, RY will be the rank of the variable considered. Likewise, based on the values of SI and YSI, the average was obtained the most stable genotypes was selected taking into account the three variables.
RESULTS AND DISCUSSION
The combined AMMI analysis of variance (ANOVA) of the HSF showed that the effects on the fruit weight of lulo (FW) were highly significant (P<0.01) for genotypes (HSF and control), significant (P<0.05) for localities (environment) and for the genotype-by-environment interaction (GEI) (Tab. 3). The AMMI model showed that of the sums of squares generated, the environment contributed 8.14%, the genotype-by-environment interaction (GEI) contributed 13.68% and the effect of genotypes (HSF and control) contributed 37.22%. The results revealed that the HSF of lulo had different adaptability to the environment. However, the effects of genotypes (HSF) were the main cause of total FW variation. Additionally, decomposition of the interaction effects into principal components (PC) of the AMMI model indicated that the first principal component (PC1) contributed 67.82% of the total variance of the interaction and PC2 contributed 23.79%, for a total cumulative variance of 91.6%.
Table 3. AMMI ANOVA for fruit weight (FW), ascorbic acid (AA) and yield of 10 lulo genotypes evaluated in four environments of the Andean region of the department of Nariño (Colombia).
| Fruit weight (FW) | |||||||
|---|---|---|---|---|---|---|---|
| Source | DF | SS | MS | F | Pr(>F) | %SS | |
| Environment (E) | 3 | 1901.97 | 633.99* | 4.99 | 0.003 | 8.14 | |
| Repetition/E | 12 | 1523.45 | 126.95* | 1.89 | 0.042 | 6.52 | |
| Genotypes (G) | 10 | 8693.52 | 869.35* | 8.16 | 6·10-10 | 37.22 | |
| GEI | 30 | 3195 | 106.5* | 1.59 | 0.042 | 13.68 | |
| Error | 120 | 8040.82 | 67.01 | 34.43 | |||
| IPCA | %V | %VAc | |||||
| IPCA1 | 12 | 2166.74 | 180.56* | 2.58 | 0.004 | 67.82 | 67.82 |
| IPCA2 | 10 | 759.98 | 76.00ns | 1.09 | 0.38 | 23.79 | 91.6 |
| Ascorbic acid (AA) | |||||||
| Source | DF | SS | MS | F | Pr(>F) | %SS | |
| Environment (E) | 3 | 10471.91 | 3490.64* | 244.48 | 6·10-51 | 64.04 | |
| Repetition/E | 12 | 171.33 | 14.28ns | 0.62 | 0.82 | 1.05 | |
| Genotypes (G) | 10 | 1709.3 | 170.93* | 4.19 | 5·10-05 | 10.45 | |
| GEI | 30 | 1224.69 | 40.82* | 1.76 | 0.017 | 7.49 | |
| Error | 120 | 2776.03 | 23.13 | 16.98 | |||
| IPCA | %V | %VAc | |||||
| IPCA1 | 12 | 768.12 | 64.01* | 2.85 | 0.002 | 62.72 | 62.72 |
| IPCA2 | 10 | 401.97 | 40.2ns | 1.79 | 0.07 | 32.82 | 95.54 |
| Yield | |||||||
| Source | DF | SS | MS | F | Pr(>F) | %SS | |
| Environment (E) | 3 | 1166.4 | 388.8* | 10.01 | 6·10-06 | 43.82 | |
| Repetition/E | 12 | 465.94 | 38.83* | 7.88 | 1·10-10 | 17.5 | |
| Genotypes (G) | 10 | 156.53 | 15.65ns | 1.67 | 0.096 | 5.88 | |
| GEI | 30 | 281.54 | 9.38* | 1.9 | 0.008 | 10.58 | |
| Error | 120 | 591.42 | 4.93 | 22.22 | |||
| IPCA | %V | %VAc | |||||
| IPCA1 | 12 | 195.42 | 16.28* | 2.56 | 0.005 | 69.43 | 69.43 |
| IPCA2 | 10 | 53.91 | 5.39ns | 0.85 | 0.582 | 19.15 | 88.58 |
* significance of the source, ns = non-significance of the source; %SS: percentage of sum of squares explained by the corresponding VF; IPCA: principal component analysis of interaction; %V = percentage of variance explained by the PC; %VAc: percentage of cumulative variance-explained by the PCs.
The combined ANOVA (Tab. 3) for ascorbic acid (AA) shows highly significant differences for locations, treatments and for GEI, indicating that the families behave differently in the environments evaluated. Of the total variance, 64.04% is contributed by the locations, followed by error with 16.98 and interaction with 7.49%. PC1 contributed 62.72% of the total variance of the interaction, followed by PC2 with 32.82%. These two PCs presented a cumulative variance of 95.54%, where PC1 was significant.
In yield, highly significant differences (P<0.01) were observed for locations and for the GEI, indicating that the HSF and the control behaved differentially in the environments evaluated. The genotypes did not show significant differences; however, the GEI is of most importance to find potential genotypes with specific or general adaptations to the environments of Nariño. Of the total variance, the highest percentage was contributed by the locations with 43.82%, followed by the error with 22.22%. GEI contributed 10.58% and genotypes 5.88%. PC1 contributed 69.43% of the total variance of the interaction, followed by PC2 with 19.15%, for a cumulative variance of 88.85%. PC1 was significant (Tab. 3).
In all three variables (FW, AA and yield), the AMMI1 biplots graphically represent stability, which is given by the relationship between IPCA1 and the additive effect of genotypes and environment; moreover, IPCA1 explains between 62 and 69% of the total variation implied in the GEI. The AMMI2 model was also chosen, revealing stable environments and genotypes located close to the origin with low scores for the two interaction axes (IPCA1 and IPCA2) (Nafisah et al., 2020).
The AMMI1 model for FW (Fig. 1A), shows that genotypes HSF49, HSF22, HSF25, HSF7 and control lie to the right of the vertical line, thus outperforming the overall FP average (99.2 g). HSF49 obtained the highest FW average with 110.44 g. Families HSF1 (88.44 g) and HSF4 (88.35 g) recorded the lowest FW averages (Tab. 4).
The most stable HSFs were 4, 22, 28, 29, 36, 45, 49 and the control; although families 4, 36, 45, 28 and 29 showed lower FWs than the overall mean. Of all the genotypes, control and HSF49 obtained the highest FW averages and were stable. Regarding environments, Tangua (100.03 g) and Arboleda (103.77 g) stood out, with FWs exceeding the other locations and within the 26 and 30 caliber (Icontec, 2002). These calibers are the most suitable for fresh marketing (Muñoz et al., 2013). The most stable environment was Tangua. Environmental stability is important to demonstrate the reliability of genotype ranking in each environment with respect to the rating of the environments in question (De Oliveira et al., 2014).
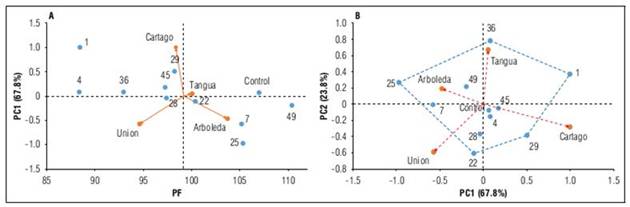
Figure 1. Graphical representation of the biplots of the AMMI analysis for fruit weight (FW) recorded in nine HSFs of lulo and evaluated in four environments of the Andean region of the department of Nariño (Colombia). A: PC1 as a function of FW (AMMI1 model); B: biplot of PC1 vs. PC2 (AMMI2 model).
Table 4. AMMI stability value (ASV), orders and stability indices (SI) for fruit weight (FW), ascorbic acid (AA) and fruit yield for lulo half-sib families (HSF) evaluated in four locations in the department of Nariño (Colombia).
| HSF | FW | Or1 | ASV | Or2 | SI1 | AA | Or3 | ASV1 | Or4 | SI2 | Yield | Or5 | ASV2 | Or6 | YSI | SIa |
|---|---|---|---|---|---|---|---|---|---|---|---|---|---|---|---|---|
| C | 107.04 | 2 | 0.20 | 1 | 3 | 31.08 | 9 | 0.41 | 5 | 14 | 8.5 | 9 | 2.82 | 10 | 19 | 12.0 |
| 4 | 88.35 | 11 | 0.27 | 2 | 13 | 38.77 | 2 | 0.09 | 1 | 3 | 9.57 | 2 | 0.5 | 3 | 5 | 7.0 |
| 28 | 97.43 | 7 | 0.39 | 3 | 10 | 30.39 | 10 | 0.29 | 2 | 11 | 9.02 | 6 | 0.33 | 1 | 7 | 9.7 |
| 45 | 97.25 | 8 | 0.50 | 4 | 12 | 34.93 | 4 | 0.58 | 9 | 13 | 6.96 | 11 | 1.04 | 5 | 16 | 13.7 |
| 49 | 110.44 | 1 | 0.60 | 5 | 6 | 40.18 | 1 | 0.35 | 4 | 5 | 9.56 | 3 | 1.4 | 6 | 9 | 6.7 |
| 22 | 100.44 | 5 | 0.68 | 6 | 11 | 32.39 | 8 | 0.81 | 11 | 19 | 8.19 | 10 | 2.01 | 7 | 17 | 15.7 |
| 36 | 92.97 | 9 | 0.82 | 7 | 16 | 32.93 | 7 | 0.56 | 8 | 15 | 8.61 | 8 | 0.47 | 2 | 10 | 13.7 |
| 29 | 98.25 | 6 | 1.49 | 8 | 14 | 29.94 | 11 | 0.48 | 7 | 18 | 10.91 | 1 | 3.65 | 11 | 12 | 14.7 |
| 7 | 105.22 | 4 | 1.66 | 9 | 13 | 37.31 | 3 | 0.29 | 2 | 5 | 9.53 | 4 | 2.29 | 8 | 12 | 10.0 |
| 25 | 105.33 | 3 | 2.79 | 10 | 13 | 34.74 | 5 | 0.74 | 10 | 15 | 9.10 | 5 | 2.35 | 9 | 14 | 14.0 |
| 1 | 88.44 | 10 | 2.88 | 11 | 21 | 34.00 | 6 | 0.42 | 6 | 12 | 8.88 | 7 | 0.89 | 4 | 11 | 14.7 |
C= control; HSF = half-sib family; Or1 = order of FP; ASV = AMMI stability parameter for FW; Or2 = ASV order of FW; SI1= selection index for FW; Or3 = order of AA; ASV1 = AMMI stability parameter for AA; Or4 = ASV1 order of AA; SI2 = selection index for AA; Or5 = order of yield; ASV2 = AMMI stability parameter for yield; Or6 = ASV2 order of yield; YSI = selection index for yield; SIa = average selection index.
In the graphical representation of the contribution of genotypes and environments to the interaction, considering the two IPCs (Fig. 1B), genotypes located close to the origin of the biplot contribute to the interaction with low percentages, hence they are considered stable and of higher adaptability to the environments where they were evaluated (Gordón-Mendoza, 2020). According to these criteria, control, HSF4 and HSF45 showed greater stability across the locations evaluated, with averages between 88.35 g and 97.25 g, except for control which had a FW (107.04 g), higher than the general mean (Tab. 4).
Families 36, 1, 29, 22 and 25 found in the vertices represented by points showed greater interaction and, in turn, have greater specific adaptation to the environments of the corresponding zone formed by the polygon of variation (Rodríguez-González et al., 2011; Liu et al., 2022). Thus, the Tangua environment was in the upper right sector of figure 1B, where HSF36 stands out with a FW of 92.97 g. The Cartago environment was in the lower right sector where HSF1 and HSF29 stand out as the most adapted, with averages of 88.44 and 98.25 g. On the lower left side, La Union with HSF22 was located as the most adapted to this environment with a FW of 100.44 g. Finally, in the upper left sector Arboleda was located with HSF25 with FW of 105.33 g.
These averages exceed those found by Lagos et al. (2015) in 50 HSF of lulo, and Álvarez et al. (2016), in a collection of 15 genotypes collected in municipalities of the department of Nariño, classified as moderately resistant and resistant to Meloidogyne spp., with values ranging between 52.6 and 81.5 g that are cataloged in caliber 26 and 30 (Icontec, 2002). In addition to the influence of the environment on the expression of the FW, agronomic practices must be considered to improve fruit quality at harvest time. Ardila et al. (2015) recommend improving fruit quality by pruning productive branches and managing bunches per branch to obtain a higher percentage of fruit in the extra and first category with 40 bunches per plant and four to five stems per plant.
The ASV represents the distance between each genotype and the origin of the AMMI biplot. This stability parameter is ranked from highest to lowest, with the lowest the one that is closest to the origin, indicating higher stability (Liu et al., 2022). Consequently, ASV values established that the control, HSF4 and HSF28 are stable. High ASV values indicated that genotypes HSF25 and HSF1 are unstable (Tab. 4). An ideal genotype should have a high average for the evaluated trait and a low ASV (Al Naggar et al., 2020). This description corresponds to the control, HSF49, HSF28 and HSF22, which had high average FW and lower and moderate ASV values that produced low selection indices (SI1). This makes them suitable to be selected as parents or to improve this trait (Tab. 4).
Genotypes HSF29 and HSF7 could be potentials for validating FW performance and specific adaptability, considering that they have high FW averages. The high ASV results indicated that HSF1 is unstable and not adapted to the environments where it was evaluated and presents the low average for FW (Al-Naggar et al., 2020).
Figure 2A shows that ascorbic acid (AA) of HSFs 25, 45, 7, 4 and 49 exceed the overall mean (AA = 34.04 mg/100 g), while HSF1 is similar. The AA values of these families greatly exceed those of Bastidas and Cuaspud (2018), who evaluated the agronomic performance of 10 HSF under conditions of the municipality of Tangua, in the department of Nariño; González et al. (2014), who evaluated commercial fruits of crops from Valle del Cauca, Colombia, and Matarazzoet al. (2013), who evaluated fruits from the experimental farm of the Federal University of Viçosa, located in the municipality of Viçosa (MG). This could be due to the low proportion of enzymes that reduce ascorbic acid, such as ascorbate oxidase, in these families and their reduced performance or functional ability compared to the genotypes under study by the authors.
HSF49, HSF4 and HSF7 were categorized as stable, given their low SI2 value and had the highest AA values, between 37.31 and 40.18 mg/100 g (Tab. 4). In contrast, HSF25, HSF49 and HSF36 were classified as unstable (Fig. 2A). The averages of the other families evaluated ranged from 29.94 to 32.39 mg/100 g across environments. These are considered low, but with high agroindustrial potential as the minimum daily consumption per person is 50 mg (Fonseca et al., 2013), which would be met by the consumption of two fruits of any family evaluated. Among the locality averages, the highest average was Cartago (44.39 mg/100 g), followed by Arboleda (35.18 mg/100 g), Tangua (34.07 mg/100 g) and La Union (22.66 mg/100 g).
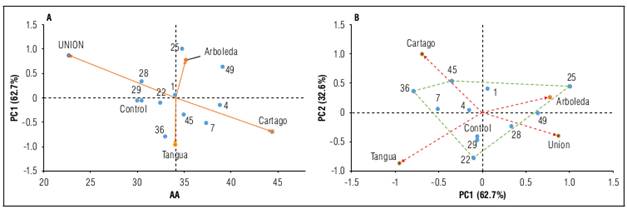
Figure 2. Graphical representation of the biplots of the AMMI analysis for ascorbic acid (AA) recorded in nine HSFs of lulo evaluated in four environments of the Andean region of the department of Nariño. A: PC1 as a function of FW (AMMI1 model); B: biplot of PC1 vs PC2 (AMMI2 model).
The environments Arboleda and La Union with a positive PC1 and PC2 close to zero (Fig. 2B) have little participation on the interaction effect. These environments group HSF49, with an average of 42.9 mg/100 g. HSF25 is close to the Arboleda vector; therefore, it has a specific adaptation to this environment with an AA value of 41.03 mg/100 g. HSF45 is adapted to the Cartago locality with an AA content of 49.05 mg/100 g. These three families had the highest averages among the families and could be considered as important sources of vitamin C for human consumption and agroindustrial transformation.
Cartago had a yield of 8.87 t ha-1 and La Union had the lowest average with 4.85 t ha-1 (Fig. 3), due to the presence of important outbreaks of fruit gall midge (Neoleucinodes elegantalis) during the evaluation period. These outbreaks are facilitated by the altitude of the locality (1,405 m a.s.l.) and its temperature (19°C), which are within the infestation range for lulo (Díaz and Brochero, 2012). The pests generate losses in production by affecting fruit at color stages 2 and 3 (Icontec, 2002).
Figure 3. Graphical representation of the biplots of the AMMI analysis for the yield (RTO) obtained in nine HSFs of lulo evaluated in four environments of the Andean region of the department of Nariño (Colombia). A: PC1 as a function of yield (AMMI1 model); B: biplot of PC1 vs. PC2 (AMMI2 model).
Cartago stood out for the lowest contribution to the GEI and Arboleda, Tangua and La Union had a high contribution to the GEI (Fig. 3B), indicating more variability and less stability. This variability affects how genotypes perform across different environments, confirming that environmental factors play a larger role in yield variation than genetic factors, as supported by De Oliveira et al. (2015). In addition, the variation in average yield is lower for genotypes than for environments (Fig. 3). HSF29 stands out with the highest average across environments at 10.91 t ha-1 while HSF45 had the lowest average at 6.96 t ha-1.
The graphical representation of the contribution of genotypes and environments to the interaction considering the first two axes (Fig. 3B) shows that families 29, 49, 22, 4, 45 and control form a polygon of variation. Among these, HSF49 does not present a specific adaptation and its behavior varies according to the environment, marking it as unstable (Ceballos, 2012). Similarly, HSF36 and HSF25 do not adapt to any specific environment, indicating they are also unstable.
The length of the vectors indicates the capacity of evaluated localities to discriminate the specific adaptation of the families (Yan et al., 2000). Control and HSF7 show specific adaptation to Tangua, with yields of 12.82 and 13.41 t ha-1, respectively. In La Union, HSF4, located at the extreme end of the vector, is therefore adapted to this environment, with 6.14 t ha-1, yield that is considered low with respect to the others. In Cartago, HSF22 stands out with specific adaptation to this environment, with a yield of 9.11 t ha-1 and in Arboleda, HSF29 with the highest average with 16.14 t ha-1 (Fig. 3B). Thus, the influence of environments is responsible for the variation by genotype and genotype-by-environment interaction (Kizilgeci et al., 2019).
In table 4, low ASV values for HSFs 4, 28, 36, and 1 establish that they are stable. High ASV values indicate that genotypes HSF25, control, and HSF29 are unstable. ASV is used in the simultaneous selection of high yielding and stable genotypes (Sharifi et al., 2017). Stability alone is not a suitable selection criterion as stable genotypes may not be high-yielding, so the simultaneous use of yield and stability in a single measure is essential. The simultaneous selection index, known as the genotype stability index (GSI) or yield stability index (YSI), is calculated by summing the ranks of the stability measure and the average yield of genotypes (Farshadfar, 2008; Poudel et al., 2023). Consequently, HSF4, HSF28 and HSF49 families are promising due to their high yields and stability. HSF7 and HSF25 have high yield averages and could be considered for validating their specific adaptability. The high ASV results indicated that HSF29 was unstable and not adapted to the environments where it was evaluated despite presenting high yield averages (Al-Naggar et al., 2020).
The ASV value allowed us to classify the genotypes according to the stability measure, since the AMMI model does not provide this classification (Mekonnen and Mohammed, 2009). Genotypes close to the point of origin are considered stable and generally adaptive because of their low interaction with their environments (Alejos et al., 2006). By considering the selection indices (SI1, SI2 and YSI) and obtaining the average (SIa), behavioral genotypes were identified based on FW, AA, and yield. In this sense, SIm showed the genotypes that combined high values in the three evaluated variables and stability. These corresponded to HSF49, HSF4 and HSF28, which showed higher values in two of the three variables, except for HSF49, outstanding in all three variables.
CONCLUSION
Variation in genotype-by-environment interaction was an important factor for identifying half-sib families that are stable and specifically adaptive. The families HSF25 in AA and HSF29 in yield showed specific adaptation to Arboleda. Families stable across environments and performing well were HSF4, HSF28 and HSF49. HSF4 and HSF28 showed superior values in two of the three variables (FW and yield), while HSF49 was outstanding in all three variables (FW, AA and yield). These families can be used in breeding programs for the species as parents or as improved cultivars that can contribute to the sustainability of production systems.

