1. Introduction
Wetlands include habitats such as swamps, peat bogs, floodplains, rivers, lakes, coastal areas such as marshes, mangroves, and seagrass beds, as well as coral reefs and other marine areas, whose depth at low tide does not exceed six meters, and artificial wetlands, such as wastewater treatment ponds and reservoirs (p.2) [1].
Wetlands are fragile, especially those found in paramo ecosystems. These are influenced by distressing factors related both to neighboring productive systems and natural factors associated with the climatic and edaphic conditions of this ecosystem. They evolve rapidly and display abrupt declines.
Various methodologies have been employed for the study of terrestrial and aquatic ecosystems, which advance as technology evolves. Among these is the use of remote sensing as a fundamental tool for wetland analysis. It detects information on small or large scales, and "aims to recognize the characteristics of the terrestrial surface and the phenomena that take place therein, based upon sensor-recorded data"[2]. Countless investigations have been carried out using remote sensing tools for rapid ecosystem study, including those presented [3-6]. These results of these studies demonstrate the importance of aerial photograph, LANDSAT image processing, digital terrain model, and spectral index use, from different years, for wetland study in Colombia.
The use of RADARSAT Radar Images, SAR COSMO Skymed images and Digital Elevation Models -DEM- such as those presented by [7-9], is also of consequence. In accordance with the above, and based on references which support the use of remote sensing techniques for wetland detection in various contexts, they may be applied to ascertain levels of wetland decline and the speed at which this occurs. This would be principally applied in water recharge areas, such as the Los Nevados National Natural Park (PNNN) buffer zone in Colombia, where hydrological tracts of vital importance for rural and municipal aqueducts for the city of Manizales and neighboring towns are found. Knowledge of this acceleration in wetland decline permits the generation of information for the decision-makers responsible for acting quickly and efficiently in pro of ecosystem recovery.
This investigation has established the evolutive process of high Andean wetlands located in the upper part of the Chinchiná river basin in the department of Caldas, Colombia, over time, via the use of Landsat, Rapideye, and radar images [10], together with anthropic and climatic factor analysis. Thus, comparisons have been established comparisons between water mirror loss and the above-mentioned factors.
2. Methodology
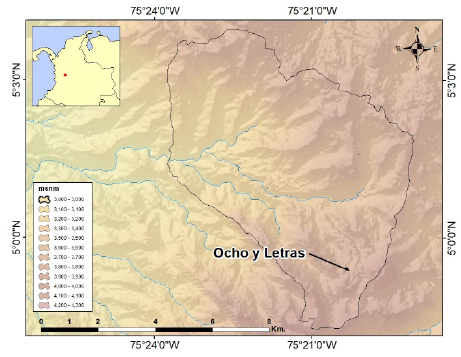
Fig.1 shows the study area, as defined by the Los Nevados National Natural Park (PNNN) buffer zone in Colombia. It is located in the upper part of the Chinchiná River basin in the Caldas department. Said area encompasses 24,250 hectares, and most of the wetlands studied included water mirrors or peat bogs. The spectral index calculation and image classification techniques were applied thereto for monitoring. The Normalized Difference Vegetation Index -NDVI- [11] is an equation which relates differences between thermal infrared and red bands, and the addition of thermal infrared and red bands, expressed as:
Source: The authors.
Figure 1 Study area location, Los Nevados National Park (PNNN), buffer zone in Colombia. Located in the upper part of the Chinchiná River basin in the department of Caldas.
Where NIR is Near Infrared. Application of this equation to the image generates values between 1 and -1, which indicate the phenological state of the vegetation. In the cases of those bodies of water which were areas of interest, values of -1 indicate bodies of water, in accordance with the spectral response thereof.
The Normalized Difference Water Index -NDWI- is generated by the relationship between Near Infrared (NIR) and visible bands, specifically those which are green, by means of the following formula:
Values of -1 represent the crystalline water, values of 1 represent clean soils, intermediate values or those equal to 0 represent areas with humidity, which are of great importance in the delimitation of wetland bodies. Another technique used in the present investigation was image classification, which consists of extracting relevant and appropriate information, in accordance with the object of study, using both mathematical and statistical techniques. There are various ways to classify images [12], such as supervised classification. This requires the participation of an analyst, for the assessment of the different pixels of an image, based on training areas and unsupervised classification. These relate both to the value and relative color of the tone or grouping, for the identification of spectral entities or classes, objects in the image with similar spectral characteristics.
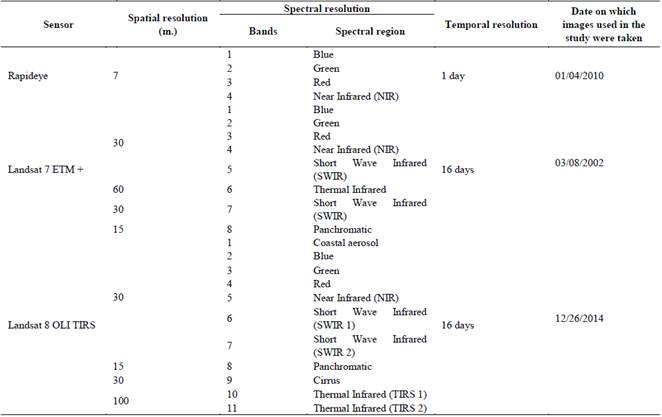
There are several types of supervised image classification algorithms [13]. These include: the minimum distance, Mahalanobis, box classification, and maximum probability algorithms. The operation of said algorithms is detailed in [12,13]. For this study, LANDSAT images from 2002 and 2014, as well as a Rapideye image from 2010, were processed. Notably, LANDSAT sensor images have a spatial resolutions of 15 meters (considering the application of image synergy between the different bands). Rapideye sensor images were used (seven-meter spatial resolution) for the identification of small wetland areas.
The optical sensor images used in this investigation are available in several free-access web catalogs. Therein, only those images which were unaffected by the high levels of cloudiness characteristic of the area studied (20- 25%). It is important to clarify that use of Landsat 7 ETM + images corresponding to different years was initially intended. However, their radiometric distortions (noise) necessitated the use of correction algorithms, in order to minimize the noise effect. The use of both kinds of images permitted study of a greater spatial range and higher resolution. Although they represent a more restricted time period, it is possible to obtain reliable results for the dynamics of the wetlands in the studied area, as their minimal backscattering permits simpler detection of wetland areas and those with water mirrors.
Regarding active sensor images, SAR images including Sentinel-1, (10-meter spatial resolution in azimuth and 10-meter range) and ALOS PALSAR satellite images (6.25-meter and 12.5-meter spatial resolutions) were used, as they were available in the area of study for the following years: 2007, 2008, 2009, 2014, 2015 and 2016.
It merits emphasis that the absence of wide spectrum range radar satellite images, such as those from the TerraSAR X (TSX) or CosmoSkymed (CSK) sensors, which have ideal spatial resolution and little or no backscattering in humid areas, only those radar images which are freely accessible or were found in public web catalogs for download and processing were used.
Sentinel 1A and ALOSPALSAR image processing consisted of geometric image correction, by way of the Simulation terrain correction (SAR) data algorithm, generates an orthorectified image, using a rigorous SAR data simulation with a Digital Elevation Model -DEM-, Geocoding vectors, and original SAR image orbit status. These and SAR image mathematical geometry models were generated using a simulated SAR image, which employed the same dimensions and resolution as the original image. Finally, the pixel value for the rectified ortho image was obtained from the original SAR image, via interpolation.
Thereafter, radiometric image calibration was carried out. This aimed to provide images in which pixel values could be directly related to scene radar backscatter. Although uncalibrated SAR images are sufficient for qualitative use, calibrated SAR images are essential for their quantitative use. This procedures importance lies in its reflection of SAR image pixel values together with the actual reflective surface value. Radiometric correction is also necessary for the comparison of SAR images acquired by different sensors, by the same sensor at different times, or in different acquisition modes.
SAR images normally have textures inherent to salt and pepper, called specks, which degrade image quality. Said spots are caused by random constructive and destructive interference of the outdated, but coherent, return. The Speckle noise reduction noise elimination filter may be applied via spatial filtering or multilook processing. Lee filtering was applied in this case, which reduced the speckling effect in a large part of the study zone’s area of interest to a 7 * 7 matrix, Source: [14].
Table 1 Passive optical sensor images used in the present study.
Source: United States Geological Survey, Agustín Codazzi Geographical Institute (2015).
Finally, backscatter value separation was performed, based on histogram analysis values. This evaluated image backscatter coefficient values. Low backscatter coefficient values correspond to water and humid vegetation zones, and high values reflected in the histogram correspond to areas with higher backscatter, which, in this case, correspond to another type of coverage.
Following analysis of the linear output image histogram (db), a value within the image’s moisture content ranges was selected, with which a mask was made, which only displayed moisture contents. Next, those pixels smaller than -10 db were selected and classified as water or wet zones. Decibel values outside of said range marked as null values or not water.
Thereafter, a data mask was obtained, whose moisture values were exported to a new layer, in Geotiff format. Later, it was converted to vector format and wetland zones were calculated, following elimination of those with low decibel values. Next, a map of each of the images, with possible wetland location zones, was generated. A texture analysis of the radar image was performed for the obtention of better wetland identification results.
Subsequently, an unsupervised classification was carried out, in which 13 different texture classes were generated, in order to establish wetland areas. These were selected after having converted the resulting layer to Shapefile format, and wetland areas were calculated in hectares. For the multi-temporal wetland analysis, CORPOCALDAS performed the delimitation in 2006, when the Caldas wetland diagnosis was carried out. Thus, two zone sizes were utilized, owing to image availability, as Landsat images were only available for a smaller area.
Finally, in order to analyze ecosystem dynamics in relation to anthropization and its relationship with water mirrors, maps of reclassified vegetation cover in natural and non-natural areas were constructed for 1998, 2010, and 2016 , in an effort to determine the degree of fragmentation suffered in the area studied.
Likewise, an analysis of climatological data, including temperature, relative humidity, and precipitation was performed. Said information was taken from the Mirador Station, located at N75 degrees 26’ 24'' latitude, 5 degrees 4'44''' longitude, at an elevation of 2,651 meters above sea level, in Las Palomas hamlet. The analyzed information was from the 2002-2016 period, and an analysis of its relationship with water mirrors was carried out.
3. Results and discussion
Two different areas of analysis are presented, given the limited availability of optical images, which failed to cover the entire area photographed by radar images.
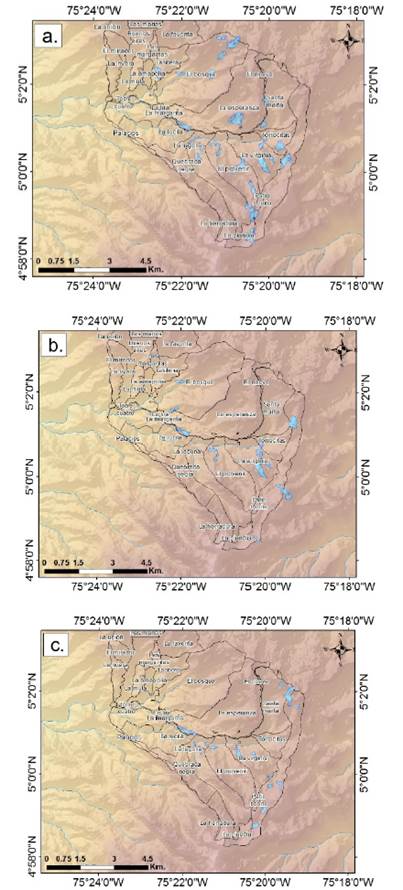
Fig.2 shows those maps which resulted from the multitemporal analysis of the wetland area in the high Andean sector, which employed both optical and radar images.

Source: The authors.
Figure 2: Multitemporal wetland analysis using multispectral optical images, for 1970, 2002, 2010, and 2014.
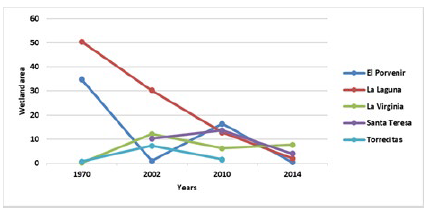
According to the (Fig.2) there seems to have been a temporary decrease in water mirrors in a sector of the area studied. Likewise, as shown in Fig.2d, the wetland with the greatest temporal impact is the Laguna Negra, as accelerated decline has been observed on said property. In the case of the Porvenir and Santa Teresa land, observe that between 2002 and 2010, there was a slight increase in wetland area. The Torrecitas property experienced an increase near 2002, but then returned to 1970 levels.
A temporal variation graph of the wetland area was created to corroborate the above observation (Graph 1). Linear regression was applied thereto, and one may observe that the La Laguna and El Porvenir sectors, reflect a significant decrease in water mirrors over time, while those of La Virginia are stable. In accordance with the equation applied, it may be determined that water mirror loss totals approximately one hectare per year, per property.
Source: The authors.
Graph 1 Temporal variation in the wetland areas in several sectors of the zone studied (see Fig.5 for sector location).
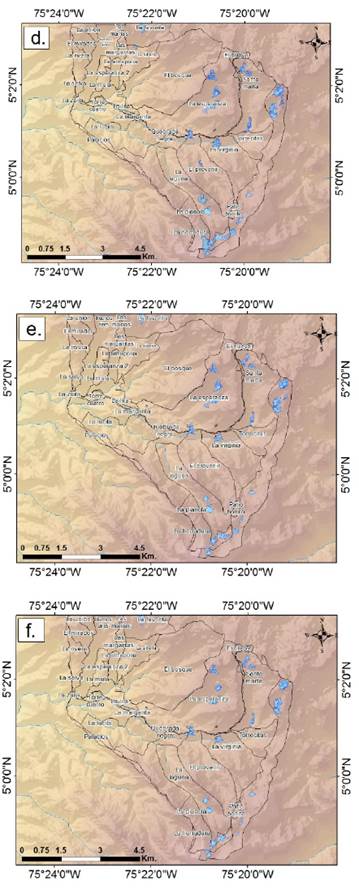
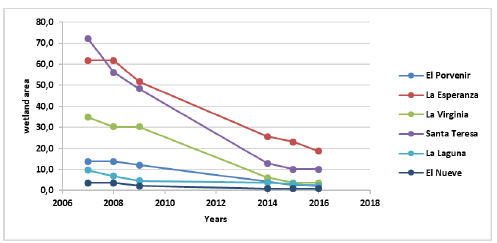
Radar images were more reliable for identification of bodies of water. Fig.2 shows the evolution of those wetlands within the area studied, using radar images from 2007-2016. Based on these results, a statistical analysis of the wetland variation behavior, as compared to the years studied, was carried out. Likewise, a linear regression analysis was performed, in order to determine the tendencies of each of the wetland areas toward water mirror or humid vegetation loss. Figures 3 and 4 show the results of said analysis. In the case of the Santa Teresa plot, as shown below, in accordance with the linear regression, wetlands are reduced by approximately six hectares annually. This is the area with the greatest risk of wetland ecosystem disappearance. The lagoon, which is among the most representative properties, as the Chinchiná River emerges therefrom, tends to diminish by 0.6 hectares annually.
Source: The authors.
Figure 3 Multitemporal wetland analysis in the area studied, using SAR images: a). ALOSPALSAR June 2007, b). ALOSPALSAR June 2008, c). ALOSPALSAR June, 2009.
Source: The authors.
Figure 4 Multitemporal wetland analysis in the area studied, using SAR images: d). Sentinel-1 A, 2014, e). Sentinel 1 A, 2015, f). Sentinel 1 A, 2016.
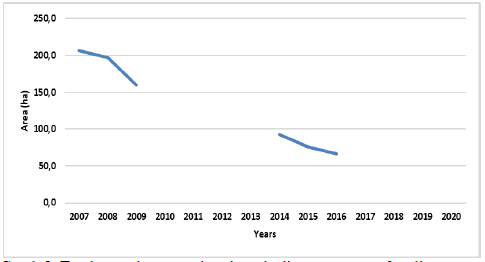
The annual total wetland areas of the wetlands studied were also calculated. Fig.4 shows the results and adjusted regression curve thereof. This figure reflects a significant loss in hectares of wetland in the area studied. In 2007, there were a total of 206.3 hectares of wetlands, which decreased to 66.2 hectares in 2016, a 67.9% loss in just nine years.
Source: The authors
Graph 2 Temporal wetland area variation by sector, based on radar image analysis. The dotted lines represent linear adjustment curves for each sector.
Source: The authors.
Graph 3 Total annual areas and projected adjustment curve for all wetlands studied.
With the sum of all evaluated, a graph for 2007-2009 and 2014- 2016 was obtained. This shows a significant decrease in water mirrors, and an exponential approximation permits the projection that, by 2020, there will be fewer than 50m2 of total water mirrors, and by 2030, they will have virtually disappeared. According to the results of this study, through the analysis of photographs and satellite and radar images, there is evidence of accelerated wetland decline in the area studied. One aspect to consider is the possible influence of the volcanic ash generated by the Nevado del Ruíz volcano’s activity, since 2012 [15], on the decline of wetland areas, an aspect that is not the subject of this investigation. The periods of time in which the images were captured must be considered, as the images from 2007, 2008, and 2009 were taken in June, or summer time, while the images from 2014, 2015, and 2016 were captured during the rainy season. This aspect will be considered later.
Fig.4 shows the projection for the trend of wetland loss with an adjustment curve. If this trend continues, wetlands in the area may disappear between 2019 and 2021, a fact which must be considered in environmental protection plans. The loss of the water mirrors analyzed is consistent with the report made by [16], regarding the state of the world's wetlands and the services which they provide. Therein, it is stated that wetlands are in global, accelerated decline, and it estimates a loss of between 64% and 71% of total wetlands in the past century. This loss percentage varies, depending on the location and the stressors present in each region, which influence wetland decline. There are regions where up to 90% of wetlands have been lost.
According to anthropogenic dynamics, it is important to analyze the stress factors which directly affect wetland ecosystems, and which may be the cause of the significant water mirror reduction in the wetlands contained in the area studied. These factors are directly related to anthropic and natural causes. However, the influence of phenomena such as volcanic ash emissions in the area studied, from the Nevado del Ruiz volcano, the greenhouse effect, solar brightness, among others, cannot be ignored, as they may affect wetland dynamics. For this study, the anthropic influence reflected in the loss of natural vegetation cover owing to the expansion of agricultural and livestock farming activities was analyzed, as were climatic variables such as precipitation, relative humidity, and temperature.
Although this investigation did not thoroughly analyze all of the possible causes of wetland ecosystem loss, it may be inferred that the productive activities performed in the area studied, including potato cultivation and livestock farming, as well as the different drying practices employed for soil tilling, may cause the accelerated deterioration thereof.
Among the anthropogenic activities that may cause wetland deterioration are those related to the existing production systems in the area studied. The traditional agricultural crop in this area potatoes. The largest impact is principally due to the expansion of agricultural practices, which have caused deforestation, especially of those forests which protect wetlands. This increases the probability of their disappearance, as does the use of agrochemicals which create runoff that may affect water quality.
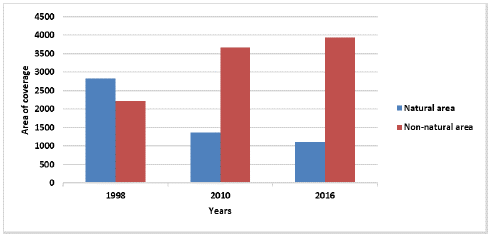
Another aspect which causes a significant impact on wetland areas is land clearing for farming, as this involves special tilling, performed either with oxen or tractors, which alter the physical properties of the soil, including texture, structure, and therefore, moisture retention and apparent density. They further decrease soil macroporocity and increase soil compaction. Note that this productive system is minimal, as compared to that of livestock farming. The area studied is mainly utilized for extensive livestock farming. After mining, this among the productive systems that has caused the most environmental damage, principally due to the expansion of its practice, causing intense deforestation and damage to water sources, owing to inadequate management, which causes soil compaction processes and wetland eutrophication, as well as loss of apparent soil density, and therefore loss of the infiltration which favors water resource regulation processes. Livestock farming is the productive system which has caused the most severe fragmentation of the landscape. Landscape anthropization and the influence of productive systems in the area studied may be consulted in Fig.4. This is a result of the reclassification of natural and non-natural ground cover. A significant change occurred in 1998, 2010, and 2016, with an increase in non-natural areas, which mostly correspond to the livestock farming and potato crop productive systems.
The amount of non-natural vegetation cover has increased. In 1998, it covered an area of 2,218.28 hectares, and in 2016, it covered 3,936.60 hectares. According to the multi-temporal water mirror analysis, in the 2007-2016 period, the wetlands decreased by 67.9%, which coincides with the decrease in natural vegetation cover.
Source: The authors.
Graph 4 Area variation in hectares of natural and non-natural cover in the area studied. Source: Author elaboration.
Source: The authors.
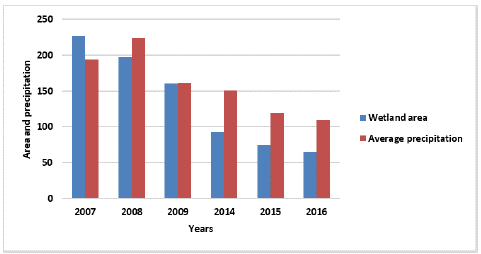
Graph 5 Relationship between wetland area and precipitation. Elaborated by authors, with data from Aguas de Manizales.
With the temperature-water mirror variation relationship results, it was determined that temperature variability does not allow for the establishment of a direct relationship with water mirrors. It is clear that 2014 and 2015 were critical for the wetland areas. Particularly, 2015 brought the El Niño phenomenon to Colombia. However, the previous figure shows that there is no relationship between temperature and wetland areas. Instead, in 2015, there is a decreasing temperature curve accompanied by a significant water mirror decrease.
The same occurred in the relative humidity (RH) analysis. No relationship was established between RH and water mirrors. That said, there was a relationship between 2010-2012. Further, in 2015, the RH diminished considerably, while water mirrors shrunk. The relationship between these parameters is clearer in 2015.
Fig.5 begs the conclusion that there is a relationship between lower rainfall and wetland area, over time. In 2008, although there was an increase in precipitation, there was no increase in wetland area. For the rest of the year, there was a steady decrease in water mirror area, and so there seems to be little positive influence of rainfall on wetlands, as they continue to decline, despite temporary precipitation increases.
In accordance with analyses of anthropogenic and climatic factors, there is a greater tension and variation in the wetland ecosystem caused by the anthropic factors, as echoed in the accelerated loss of natural areas, in favor of the establishment of productive systems. This must be controlled, in order to halt accelerated wetland decline of wetlands in the area studied.
In a study carried out by [17], in the Laguna de Fúquene, a drastic change in water mirrors, in which over half of them were lost in 1985, 2000, and 2015 was identified, it was also established that the temperature and precipitation analyzed in the various periods were not directly related to the changes in water mirrors. In the study carried out by [18], in the northern Chilean highlands, no significant correlation was found between wetland status and precipitation. However, there was a relationship between that and the El Niño and La Niña phenomena. Additionally, the study contributed by [16] mentions that, globally, over 70% of wetlands have vanished.
In Sousa’s [19] investigation, in the Doñana wetland located in Spain, where the effect of climate change on wetlands was analyzed, the author states that important changes in wetlands depend more on the amount, or seasonal distribution of rainfall , than on temperatures. They also suggest that this accelerated decline began in the 17th century, when the expansion of agricultural production was initiated, especially with fast-growing species, and which has been accentuated in recent years, as mirrored in a 70% wetland decrease. In [19], a decrease in other wetlands, of over 90% is shown, as is the case of the Lagunas Turbosas wetland in Rivatehilos Spain, where more than 1,800 hectares of wetlands disappeared between the 17th and 20th centuries.
Previous investigations confirm this investigation’s findings, which reveal no relationship between temperature or relative humidity with the decrease of water mirrors or their considerable degeneration over time. The largest decreases have occurred in recent years, and, according to the present study, anthropic actions have been among the major causes of wetland deterioration given mainly by the expansion of the agricultural and livestock farming practices, which, in this case, includes potato and livestock farming. These have led to a loss of natural groundcover and its possible decrease in wetland water regulation capacity.
Unlike previous authors, who have used optical images for wetland analysis, in this study, in addition to Landsat images, so too were radar images. The latter determine vegetation and water indexes, but the latter obtain greater clarity on water mirror evaluation, as cloud cover does not impede photo quality, and employs resolution. In Colombia, until recently, ecosystem interpretation work was performed using radar images.
According to Lira [20], one of the advantages of Synthetic Aperture Radar (SAR) image use is based on the interaction of electromagnetic radiation with atmospheric components. This is quite small, and permits image acquisition without obstruction by atmospheric conditions. This advantage permits work in any climatic conditions. As such, this type of image was appropriate for the present study, because the high Andean region of Colombia presents climatic conditions which make the study of the terrestrial surface difficult, due to the amount of cloud cover present. Tables 1 and 2 show a list of the images used in this study, as well as their characteristics.
4. Conclusions
Regarding the analysis of Rapiday and Landsat images, in accordance with anthropogenic and climatic factor analyses, there is great tension and variation in the wetland ecosystem caused by anthropic factors. This is reflected in the accelerated loss of natural resources and clearcutting of natural areas for the establishment of productive systems. This must be controlled, in order to halt the accelerated deterioration of wetlands in the area studied. Comparison of temperature and relative humidity parameters with water mirrors reveal no significant relationship therebetween, while a more direct relationship was found between water mirrors and precipitation.
In accordance with the Rapiday and Landsat image analysis, the wetland that shows the greatest temporal affectation is the Laguna Negra. Accelerated decline has been observed on said land, an assertion which has also been corroborated in the field.
In terms of water mirror change studies, radar images have greater viability, especially because the presence of cloudiness does not affect use of these sensors, while with the Landsat images, cloud cover is a limiting factor. Significant loss of wetland areas over time was established, as they have declined from a total area in 2007 of 206.3 hectares to 66.2 hectares in 2016, which represents a loss of 67.9% in nine years. The main factors that affect the wetland deterioration are anthropic, including the use of land for agriculture and livestock farming, in addition to possible natural factors, such as decreases in rainfall, and the presence of ash emitted by the Nevado del Ruiz volcano.
Satellite images permit extensive observation of the territory. An additional advantage of remote sensing systems is their periodic repetition of observations, as most available systems record spectral information at regular intervals. This is a very efficient alternative tool, in terms of research in territorial studies in environmental contexts, which facilitate the detection of the changes in and dynamics of different ecosystems. Additionally, by accompanying this technique with the use of satellite images and digital image processing techniques, it is possible to observe changes for the dates under study, in accordance with the objective to be achieved.


