1. Introduction
In 2008, Venezuela launched its first satellite, “Simón Bolívar”, into space. It is a telecommunications satellite located in the geostationary orbit at 78o W longitude and operates at C, Ku and Ka-bands [1]; hence, it is necessary to consider the impact of rain events on satellite links performance, which deteriorates the carrier-to-noise ratio (C/N) in the uplink and downlink, to the point that the system may become unavailable in case of being undersized or involved in an investment higher than necessary, if the system is oversized [1].
Rain affects telecommunication systems operating in frequencies above 10 GHz. At these frequencies, raindrop sizes have similar magnitude that signal wavelength, and one part of the electromagnetic wave energy is absorbed and dispersed, resulting in attenuation at the received power [1]. If these effects are not properly estimated, it may result in undersized/oversized links.
Previous studies have shown several models rain attenuation prediction for satellite communication systems, for example, Recommendation ITU-R P.618-13 [2], Ramachandran-Kumar model [3], Yeo-Lee-Ong model [4] and Rakshit-Adhikari-Maitra model [5]. These models depend on rain rate, R, so accuracy in predicting rain attenuation is mainly related to whether or not rain measurements exist in the locality of interest. Here, it is important to emphasize that the rain rate cumulative distribution to be used in rain attenuation models should be constructed from measurements performed with of very short temporal resolution, i.e., 1-min integration time or less [1,6,7]. This means that in countries, like Venezuela, where such statistics are not available, it is necessary to implement conversion methodologies (e.g., Recommendation ITU-R P.837-7 Annex 2 [6]) or analytical formulations (e.g., Rice-Holmberg model [8], refined Moupfouma-Martin model [9] and Recommendation ITU-R P.837-7 Annex 1 [6]) to obtain cumulative distributions of precipitation rate suitable for satellite links planning, from statistics with longer integration times (e.g., hourly, daily and monthly), considering local climate information.
This study continues the research initiated by Rujano-Molina et al. [10]. It develops, for the first time in Venezuela, contour maps of rain rate for various exceedance probabilities of time, p%, based on 1-min rainfall rate statistics at several locations of the country. These were obtained through Rice-Holmberg model, refined Moupfouma-Martin model and Recommendation ITU-R P.837-7 Annex 1. In addition, rain attenuation contour maps are also generated by the widely recognized and accepted ITU model (Recommendation ITU-R P.618-13), as well as by some models developed for tropical climates, i.e., Ramachandran-Kumar model, Yeo-Lee-Ong model and Rakshit-Adhikari-Maitra model. Both maps were created and based on local rain rate and rain attenuation estimated by these models. The interpolation spatial method known as Spline [11] was used because it offers good results for less uniformly distributed data, such as those for Venezuela.
It is important to point out this work, with or without contour maps, follows other similar studies developed in other countries, for example, Colombia [12], Nigeria [13], South Africa [14], India [15], Bangladesh [16], Brazil [17], and Libya [18], among others.
2. Rainfall rate conversion models
In Rice-Holmberg (RH) model, data related with short-term precipitations was extrapolated to generate rain rate cumulative distributions based on measurements made at the meteorological stations. The probability for a rain rate, R, with a 1-min integration time is mainly based on average cumulative precipitation over an annual period, M, the highest monthly precipitation in the period, M m , and average number of days, U, with storm or convective rains within the same year [8]. The complementary cumulative distribution function (CCDF) of the rain rate, P(r ≥ R), is given by
It is worth highlighting that the RH model makes a good estimate of the rain rate distribution for percentages of link unavailability (p%), from 0.01% to 0.1% [1,12,19]. Additionally, the RH model allows to estimate rain rate cumulative distribution from measurements with high integration times (e.g. a week, month, etc.) [12,19].
Since the implementation of RH model requires the knowledge of data that is not always available from the meteorological services of a country, such as that related with convective rains, refined Moupfouma-Martin (RMM) model [9,14] can be implemented. This model is used for both tropical and subtropical regions and approximates low rain rates to a log-normal distribution, while high rainfall rate is approximated by gamma distribution. The CCDF of 1-min rain rate in RMM model is defined by [1,9,14]
where λ and ү are factors that depend on the climate zone. For example, for tropical and subtropical climates λ = 1.066 and ү = 0.214 [9].
Eq. (3)-(5), show that the rainfall rate probability, P(r ≥ R), in refined Moupfouma-Martin model also depends on rain rate, R 0.01 , exceeded at 0.01% of time in an average year. This can be estimated using the Chebil-Rahman model [20], based on a power law for rain rate calculation with a 1-min integration time by using only annual cumulative average precipitation M, in conjunction with regression parameters, α and β, as follows
where ( and ( are regression parameters equals to 12.2903 and 0.2973, respectively.
Finally, Recommendation ITU-R P.837-7 Annex 1 [6] is a global rain prediction method that considers the impact of monthly predictions of rainfall rate cumulative distribution. Input data involves the geographic coordinates (latitude, longitude) of the specific site, monthly rain rate in an annual period, time percentage of interest and monthly ground temperatures (referred 2 meters above the surface). If temperatures are not available, bi-linear interpolation from digital maps with long-term reliable data provided by [21] can be used. The Recommendation ITU-R P.837-7 Annex 1 is based on the following two assumptions [7]: a) the monthly rainfall rate statistics are approximated by log-normal distribution, whose scale parameter, ( i , does not depend on the locality and is equal to 1.26; b) the monthly mean rain rate, r i , is a function of the monthly mean ground temperature, T i . The annual rainfall rate probability of exceedance is obtained by [6,7]
where N i represents the number of days in each month.
In Eq. (7), P i (r ≥ R) corresponds to the monthly CCDF of rain rate for the ith month, defined as
where Q and erfc are the well-known Q-function and complementary error function, respectively.
In Eq. (8),
 represents the monthly probability of rain, given by
where MT
i
is monthly mean total rainfall. If
 is greater than 70, then
 = 70 and r
i
is calculated by
Eq. (10), shows that, if reliable long-term local data is not available, MT i at the desired location can be determined performing a bi-linear interpolation from digital maps of mean monthly value of rainfall, provided as an integral part of Recommendation ITU-R P.837-7.
3. Rain attenuation prediction models in satellite links
Recommendation ITU-R P.618-13 [2] shows a method to predict rain attenuation in satellite links considering some of the following input data: operating frequency, f, effective radius of the Earth, R E , mean elevation above sea level of the earth station, h s , earth station elevation angle, θ, earth station latitude, (, and rain rate to 0.01% of the time in an average year, R 0.01 . The method estimates rain for any percentage of time (p%) and consists of ten (10) steps that include, among others, calculation of h R (i.e., average annual rainfall height above the mean sea level), inclined path, L s (depends on h s , h R , R E and θ) and horizontal projection of the inclined path, L G (depends on L s and θ). The algorithm of the Recommendation ITUR P.618-13 also includes specific rain attenuation calculation for 0.01% of the time, ү 0.01 , horizontal reduction factor determined for 0.01% of the time, r 0.01 and adjustment factor in the vertical direction for 0.01% of the time,v 0.01 . Finally, rain attenuation, A p , exceeded during percentages of time, p(%), other than 0.01%, from 0.001% to 5% range, is calculated through interpolation in function of p, A 0.01 (attenuation exceeded for 0.01% of the time), earth station elevation angle, θ, and earth station latitude, (.
Ramachandran-Kumar (RK) model was developed on rain attenuation measurements performed on Ku-band satellite in Fiji, a tropical region [3]. The model considers the existence of a breakpoint, related to a change in rain structure, in the decrease of complementary cumulative distribution (CCD) of precipitation rate and shows two adjusted expressions of Recommendation ITU-R P.618-8 (published in 2003): one for lower rainfall rates at the breakpoint and another one for higher rainfall rates. According to the model, rain rate breakpoint takes place in a exceedance probability of time, p R , approximately equal to 0.01%, while for attenuation, the percentage of time, p A , in which the breakpoint occurs, is 2.14 times higher than p R . Therefore, the attenuation, A 0.01 , of original ITU-R model, becomes A B , that is the attenuation exceeded for 0.021% of time, calculated by the original version. In general, rainfall attenuation given by RK model includes an expression for (0.021 ≤ p <1) that incorporates a correction factor, C f , for link elevation angle, θ, between 40o and 60o (consider crossed slant path with more than one cell), and another expression used to estimate rain attenuation for p ≤ 0.021.
Yeo-Lee-Ong (YLO) model [4] was developed on measurements carried out in six tropical countries (Thailand, Indonesia, Malaysia, Singapore, Papua New Guinea and Brazil). The method is similar to that of Recommendation ITU-R P.618-11 (published in 2013), with the following variants: a) use of a single path adjustment factor instead of the horizontal and vertical adjustment factors; this factor depends on θ, R 0.01 , f, h s and rain height H = h R ; b) the regression parameters, including factor (, from the exponent in the interpolation expression to calculate the attenuation in original ITU-R model, are readjusted on the measurements of the six tropical regions mentioned above.
Finally, Rakshit, Adhikari and Maitra (RAM) [5] developed a model for rainfall decay parameter Г, of Simple Attenuation Model (SAM) [22], using rain attenuation measurements carried out on Kuband satellite in Calcutta, India, a tropical climate region. By applying the numerical method known as bisection, the model offers values of the aforementioned parameter depending on point rain rate, R p , for the percentage of the time, p, in span window of 2 mm/h. In the model, rain decay parameter decreases to 25 mm/h, does not change significantly between 25 mm/h and 40 mm/h, and increases at the 40 mm/h interval.
The procedure for calculating the rainfall attenuation for a 1-minute integration time in each of the aforementioned models is shown in Appendix.
4. Rain rate contour maps in Venezuela using local climatological data
Venezuela is located in the inter-tropical zone from 0o to 13o latitude North and 59o to 54o longitude West. This country has an interesting variety of climates, namely, tropical rainforest, tropical savanna, tundra, desert, steppes, and so on. In this work, monthly precipitation rate measurements made along 30 years in 35 of the Venezuela’s meteorological stations is used for generating rain rate contour maps of the country to generate rain rate contour maps of the country. The measurements were supplied by the Instituto Nacional de Meteorología e Hidrología (INAMEH) [23] and initially explored by Rujano-Molina et al. [10]. Table 1 summarizes the information about the stations.
Table 2 shows rain rates converted to 1-min integration time for exceedance probability 0.01% (input parameter considered in various rain attenuation models) and 0.5% (a typical percentage in planning of satellite communication operating at frequencies above 10 GHz), using RH and RMM models and Recommendation ITU-R P.837-7 Annex 1.
Contour maps were constructed using the Spline method in the ArcGIS software [24] to interpolate in space the rain rate obtained through the aforementioned models. Figs. 1 and 2 show the results obtained when the RMM model was applied for both percentages of link unavailability, 0.01% and 0.5%, respectively.
As shown, for both exceedance probabilities the highest rain rates occur at southern sector (Amazon state), northeastern zone (Monagas state), western area (Táchira state, Córdoba municipality) and the most northwestern region of the country (Zulia state, Catatumbo municipality). These rates are expected because these areas correspond to regions of the country with tropical rainforest climate (i.e., Amazon), tropical savanna climate (i.e., Monagas and Tachira) and a high number of thunderstorms in an average year (i.e., Catatumbo). The lowest rain rates, on the other hand, occur at northwestern region (Falcón state) and Margarita Island, having both regions tropical desert climate. Figs. 1 and 2 and Table 1, also show that for the percentage of time equal to 0.5% the values of the precipitation rate obtained are lower than the values of such rate for 0.01% of the time. This is consistent with the well-known fact that high rainfall intensities correspond to short-duration time intervals, i.e., lower percentages of time for which rain is exceeded [1].
A similar result regarding the geographic behavior of rain rate in the country is observed in Figs. 3 and 4, if the RH model and Recommendation ITU-R P.837-7 are used, respectively, for 0.01% of time. However, the values varying between 40 mm/h and 136 mm/h (for RH model) and from 42 mm/h to 96 mm/h (for ITU-R P.837-7), are lower than those obtained with the RMM model for same percentage of time. Although the lack of measurements in Venezuela of rain rate for 1-min integration time not allow to indicate which rainfall conversion model implemented in this work shows the best performance in the estimation, the results obtained are quite valuable not only because they may be helpful when carrying out a future evaluation once when measurements could be available, but also because these results represent a very important input for the rain attenuation preliminary prediction in the country, for satellite and terrestrial links.
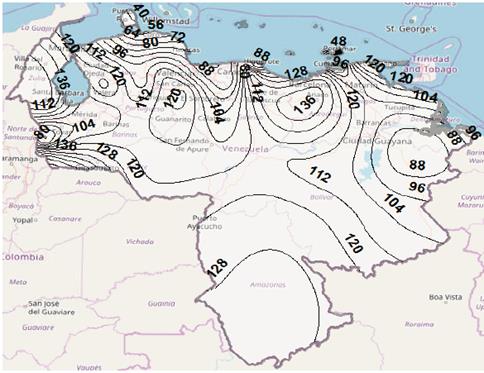
Source: The Authors.
Figure 4 Contour map for rain rate for p = 0.01%, using Recommendation ITU-R P.837-7.
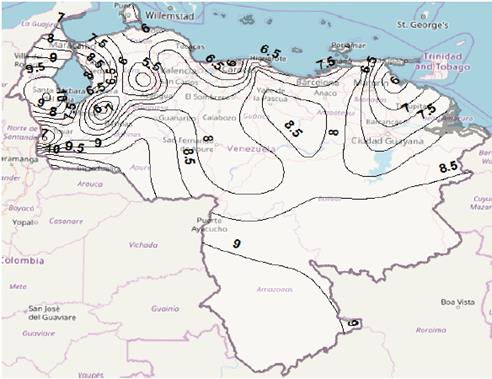
Source: The Authors.
Figure 5 Contour map for rain attenuation for p = 0.5%, using Recommendation ITU-R P.618-13 model, in Ku band.
5. Rainfall attenuation contour maps in Venezuela
Using rain rate values estimated in section 4 and implementing Recommendation ITU-R P.618-13, Ramachandran-Kumar (RK), Yeo-Lee-Ong (YLO) and Rakshit-Adhikari-Maitra (RAM) models, rain attenuation contour maps in Venezuela werw obtained. Attenuation was calculated for all meteorological stations of the Table 1, considering the downlink in Ku and Ka-bands (at 12 GHz and 20 GHz, respectively) with horizontal polarization.
As an example, based on rain rate results from Recommendation ITU-R P.837-7, Figs. 5 and 6 illustrate rain attenuation contour maps for Ku and Ka bands, respectively, when ITU-R P.618-13 model to attenuation prediction, with exceedance probability of 0.5%, is used. It can be seen that, as expected, rain attenuation is greater, in all locations, for the Kaband. Furthermore, it is observed that the highest attenuations occur at northwestern zone (Zulia state), western region (Táchira state) and southern regions (Amazonas and Apure states), while the lowest values occur at western center zone (Lara state), Andes mountains area (Mérida state), northwestern region (Falcón state) and center region (Distrito Capital). Here it is important to emphasize that attenuation also depends on mean elevation above sea level of the earth station, elevation angle, among other factors.
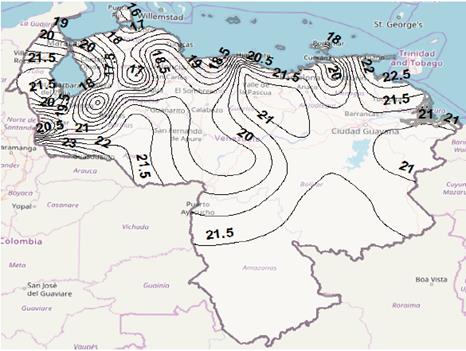
Figs. 7 to 10 show rain attenuation contours maps for 0.01% of time, Ku band, using the four models considered in the study. The difference found in rain attenuation values expected for the country is observed. It is observed a difference in the rainfall attenuation values estimated for the country, by depending on the model used for the prediction. Again, it is important to point out that although the lack of measurements, this time, of rain attenuation in satellite links in Venezuela, it is not possible to determine which of the rainfall fade prediction models has the best performance, the results obtained are the preamble for the future real evaluation in the country of those models, or even other models not analyzed in this study, in order to reduce undersizing or oversizing of the system.
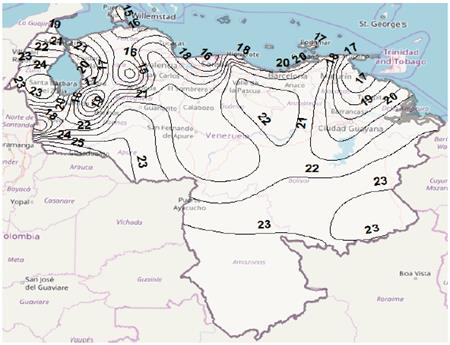
Source: The Authors.
Figure 7 Rain attenuation contour map for p = 0.01%, Ku band, using Recommendation ITU-R P.618-13.
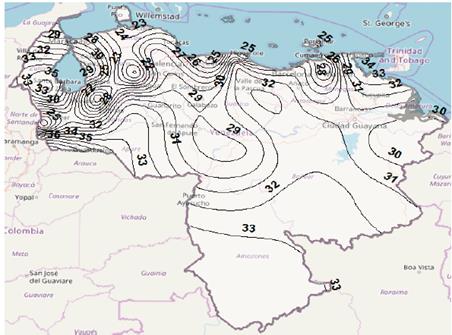
Source: The Authors.
Figure 8 Rain attenuation contour map for p = 0.01%, Ku band, using Ramachandran-Kumar model.
Source: The Authors.
Figure 9 Rain attenuation contour map for p = 0.01%, Ku band, using Yeo-Lee-Ong model.
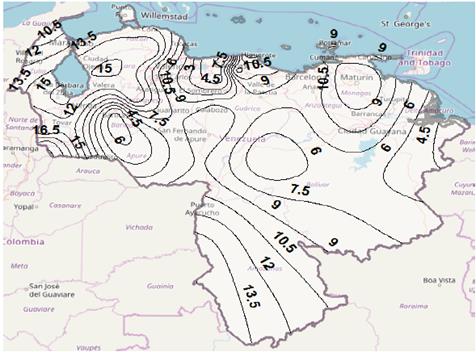
Source: The Authors.
Figure 10 Rain attenuation contour map for p = 0.01%, Ku band, using Recommendation ITU-R P.618-13.
Finally, by comparing Figs. 5 and 7, an increase in rain attenuation could be observed when the percentage of time unavailability decreases. This is another expected aspect that should be considered by system designers.
6. Conclusions
In this paper, contour maps of 1-min rain rates and rain attenuation for exceedance probability of 0.01% and 0.5% have been shown in detail for the first time in Venezuela. This was achieved by using the Rice-Holmberg model, refined Moupfouma and Martin model and Recommendation ITU-R P.837-7 Annex 1 in order to convert monthly rain rate statistics in the country to rainfall rates with 1-min integration time and using the Recommendation ITU-R P.618-13, Ramachandran-Kumar, Yeo-Lee-Ong and Rakshit-Adhikari-Maitra models to estimate rain attenuation. The maps generated may are useful for preliminary “Simon Bolivar” satellite links planning in the country, because they may provide information quickly about the rain rate and rain attenuation levels.
Nevertheless, measurements should be carried out in Venezuela in the future to evaluate performance of the models analyzed in this study, other models not included here, and also to develop rain rate prediction models and rain attenuation estimation models, adjusted to the climate characteristics of the country.


