1. Introduction
Soil quality is fundamental for the development of life, especially for its function of gradually retaining and releasing water for streams and rivers, as well as for plants. The capacity of the soil to retain water is assessed through the water retention curve (SWRC), which relates the potential matrix energy (ψm) with the volumetric moisture (Uv). It is used to analyze infiltration, profile redistribution, availability to plants and irrigation management [23].
SWRC is specific to each soil, being influenced by granulometry, mineralogy, organic matter content [14] and soil structure, which alter the distribution and size of pores. The structure, in turn, is modified during the drying of the soil, especially in those that have a retractable character, forming pronounced vertical cracks in the exposed face of the profile [7]. Retraction/expansion is a behavior observed more intensely in Vertisolos [2] but also in soils with a retractable character [20], which are representative, mainly in the Southern Region of Brazil [17,18,22]. These authors reported that drying reduced 40% of the volume of retractable soils in southern Brazil, and 50% in a Vertisol in Rio Grande do Sul [19]. This reduction in the volume of soil during drying can introduce an error in determining the volumetric moisture of the soil.
Therefore, it is necessary to quantify the contraction when the soil is subjected to drying during the analysis of SWRC. This can be accomplished by combining the determination of SWRC [3] with the soil retraction index [17,18]. Thus, for each ψm applied to the sample, the moisture (Uv) retained and the volume of the soil retracted are determined. The retracted volume is measured by filling the voids that arise during the retraction of the soil mass with fine sand, with a diameter less than 0.0425 mm [17,18].
The hypothesis of this work is that, in retractable soils, the soil moisture is underestimated at the lowest potentials of the SWRC, and thus, the available water is overestimated.
The goal of this work was to analyze the variations in the water retention curves in soils with retractable character and to propose a calculation procedure to adjust the SWRC that considers the retracted volume in each matrix potential (ψm) applied to the soil.
2. Material and methods
2.1 Soils and collection site
The A and B horizons of Oxisols and Nitosols previously identified with a retractable character and the horizon A of a Vertisol have been sampled, used as a comparison, since their retraction/expansion characteristic is known to come from the presence of type 2:1 minerals [1]. Location, identification and characterization of the analyzed soils are presented in the Table 1 and Table 2.
Table 1 Soil identification and location with the presence of retractable character and Vertisol.

*NBPai: Reddish-brown Nitosol - Painel/SC; LBVAC: Reddish-brown Latosol - Vacaria/RS; LVCN: Red Latosol - Campos Novos/SC; NBPS: Reddish-brown Nitosol - Ponte Serrada/SC; NBCUR: Reddish-brown Nitosol - Curitibanos/SC; LBVAR: Reddish-brown Latosol - Vargeão/SC; VESL Dark Vertisol - Santana do Livramento/RS
Source: The Authors.
Table 2 Identification, lithology, Group, geological formation (Serra Geral), chronology, altitude, local relief and primary vegetation of the analyzed soils.

* [6]; ** [5]; *** [13].**** NBPai: Reddish-brown Nitosol - Painel/SC; LBVAC: Reddish-brown Latosol - Vacaria/RS; LVCN: Red Latosol - Campos Novos/SC; NBPS: Reddish-brown Nitosol - Ponte Serrada/SC; NBCUR: Reddish-brown Nitosol - Curitibanos/SC; LBVAR: Reddish-brown Latosol - Vargeão/SC; VESL Dark Vertisol - Santana do Livramento/RS***** Chronology: J/K=Jurassic/Cretaceous; J/T= Jurassic/Triassic; C/I= Cretaceous/ Inferior
Source: The Authors.
In each soil, a profile has been exposed and horizons A and B have been separated, described [16] and samples with preserved structure have been collected in metal cylinders with a diameter of 0.06 m, height of 0.05 m and volume 0.0141 m3. At lab the soils in the cylinders have been prepared, removing the excess soil. Next, they have been saturated for 48 hours and submitted to the retraction and water retention analysis as described below.
2.2 Determination of soil retraction
In order to quantify the retraction, 21 samples have been collected in each horizon A and B in the six retractable soils plus 21 in the horizon A of Vertisolo (total of 273 cylinders). Shrinkage has been assessed using the sand ring method [17] [18]. Pre-tests demonstrated that the retraction only begun to be noticeable after ψm of -10 kPa, thus measuring the retracted volume in ψm between -10 to -1,500 kPa, as detailed below:
a) The volumetric cylinders have been saturated, weighed and placed on Richards' sand table and chamber (as determined ψm);
b) The applied ψm were of -10 kPa (on a sand table), -33, -100 -500, -1000 and -1,500 kPa (in Richards Chamber). After each ψm was applied, three samples have been taken from Richards chambers in order to determine the retracted volume [17,18];
c) After determining the shrinkage, the samples have been dried in an oven at 105ºC;
d) The retraction index for each ψm has been calculated [17] [18]:
Where: RI = retraction index; va = volume of the ring (cm3); and vr = retracted volume (cm3).
2.3 Soil water retention curve
In order to quantify the retraction, 21 samples have been collected in each horizon A and B in the six retractable soils plus 21 in the horizon A of Vertisolo (total of 39 cylinders).
a) The volumetric cylinders have been saturated, weighed and placed on sand table and next in Richards' chamber;
b) On the sand table [9] ψm have been applied at 1, -6 and -10 kPa;
c) Then, they were taken to Richards’ Chamber [15] at a ψm of 33, 100, 500, 1,000 and 1,500 kPa;
d) After each applied ψm the moisture reached equilibrium, and the samples have been weighed on a precision scale;
e) Afterwards, the samples have been dried in an oven at 105ºC, and the retained volumetric moisture in each ψm has been calculated.
The volumetric humidity, in each ψm, has been calculated using two procedures. First, the volume of retained water in each ψm has been divided by the initial volume of soil (equal to the volume of the volumetric cylinder = 0.0141 m3). In the second, the volume of retained water in each ψm has been divided by the volume of soil retracted (that is, a variable volume for each applied tension).
Thus, for each soil and horizon, two water retention curves have been adjusted and the parameters obtained: field capacity (FC), retained volumetric humidity at ψm of -10 kPa; permanent wilting point (PWP), retained volumetric moisture at ψm of -1,500 kPa; and available water (AW), retained volumetric humidity between ψm of 10 and -1,500 kPa.
To adjust the SWRC, the model proposed by [24] has been used:
Where: θ = volumetric humidity; θr = residual volumetric humidity; θs = volumetric moisture of the saturated soil; h = matrix potential (ψm); α, m, n = empirical parameters for adjusting the equation.
2.4 Granulometry
The determination of the granulometric distribution of the soil, for the quantification of sand (2-0.053 mm), silt (0.053-0.002 mm) and clay (<0.002 mm) has been performed using the Pipette method [4], with three replications.
2.5 Soil density and porosity
After collecting soil with the volumetric cylinders, the excess soil was removed, saturated for 48 hours, taken to the sand table at a tension of -6 kPa, and taken to the oven to dry at 105ºC until reaching constant weight. After each stage the samples were weighed. With these determinations (saturated mass, -6 kPa and kiln-dried) soil density (Sd), macroporosity (Macro), microporosity (Micro) and total soil porosity (TP) have been calculated [20]. The particle density (Pd) has been determined by volumetric flask procedure [20] in samples with altered structure and the ground soil in agate gral.
3. Results and discussion
3.1 Soil characterization
The studied soils are classified in the clayey and very clayey textural classes (Table 3), i.e., low sand content and high clay content, meeting the specifications for the retractable character. The granulometry has been influenced by the source material as well as by the weathering process that occurs in the analyzed soils.
Table 3 Textural classification and average levels of sand, silt, and clay from the analyzed soils.
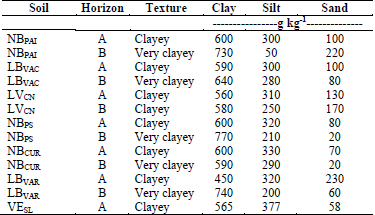
NBPAI: Reddish-brown Nitosol - Painel/SC; LBVAC: Reddish-brown Latosol - Vacaria/RS; LVCN: Red Latosol - Campos Novos/SC; NBPS: Reddish-brown Nitosol - Ponte Serrada/SC; NBCUR: Reddish-brown Nitosol - Curitibanos/SC; LBVAR: Reddish-brown Latosol - Vargeão/SC; VESL: Dark Vertisol - Santana do Livramento/RS
Source: The Authors.
The more clayey texture resulted in a lower density of retractable soils, between 0.80 and 0.96 g cm3 on horizon A and between 0.98 and 1.21 g cm-3 on horizon B (Table 4).
Table 4 Soil density (Sd), particle density (Pd), total porosity (TP), macroporosity (Macro), microporosity (Micro) of analyzed soils.
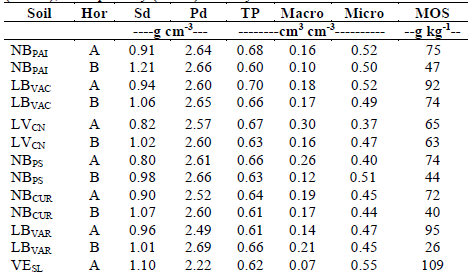
* NBPAI: Reddish-brown Nitosol - Painel/SC; LBVAC: Reddish-brown Latosol - Vacaria/RS; LVCN: Red Latosol - Campos Novos/SC; NBPS: Reddish-brown Nitosol - Ponte Serrada/SC; NBCUR: Reddish-brown Nitosol - Curitibanos/SC; LBVAR: Reddish-brown Latosol - Vargeão/SC; VESL: Dark Vertisol - Santana do Livramento/RS.
Source: The Authors.
In the Vertisol, the density of horizon A was of 1.10 g cm-3. We know that clay soils with densities less than 1.25 g cm3 hardly present restrictions to the growth and development of roots [12]. In the case of Vertissolo, even with density not restrictive to root growth, its mineralogical characteristics provide physical limitations such as cracking during drier periods, high plasticity and stickiness, and low hydraulic conductivity and infiltration rate [10].
The particle density (Pd) of horizon A varied between 2.49 to 2.66 g cm-3, in horizon B between 2.60 to 2.69 g cm-3 (Table 4), while in Vertisol it was lower, 2.22 g cm3. In general, Pd in horizon A was lower than in horizon B, because in those the MOS content is higher, a component that has a density around 1.20 g cm-3 [8] and acts in structuring of the soil. On horizon A of the LBVAR, which is the horizon with the highest SOM content, the Pd was lower, 2.49 g cm-3.
The TP of most soils and horizons was high, generally exceeding 0.60 cm3 cm-3 (Table 4), mainly in horizon A, due to the MOS content and the effect of this component on aggregation. With the exception of LBVar, which can be attributed to the predominance of strong, very small, granular structure (coffee powder) on horizon B of this soil. The high TP was due to the magnitude of the microporosity, which ranged from 0.41 to 0.51 cm-3 for Nitosols and from 0.37 to 0.52 cm3 cm-3 for Oxisols. Macro was smaller and varied between 0.10 and 0.30 cm3 cm-3, being generally larger in horizon A. The Vertissolo presents a high TP of 0.62 cm3cm-3, also with a predominance of Micropores (0.55 cm3 cm-3) in relation to macropores (0.07 cm3 cm-3), similar to that found by [11] for a Vertissolo from RS.u
3.2 Characterization of soil retraction
The retraction differed among the soils as shown in Fig. 1. The Vertissolo RI was higher than the other retractable soils, a characteristic already visually observed during the description of the soil in the field. Within soils with a retractable character, the horizons A of NBPS and LBVAC presented higher RI, while horizons A and B of the LVCN presented lower RI. According to [21], the mineralogical composition of horizons A and B of the clay fraction was similar for the analyzed soils, in general with intense reflexes related to kaolinite, and with less intensity related to the presence of type 2:1 clay minerals or chlorite and oxides, goethite and/or hematite.
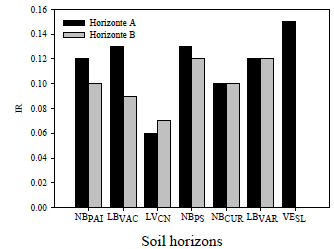
* NBPAI: Reddish-brown Nitosol - Painel/SC; LBVAC: Reddish-brown Latosol - Vacaria/RS; LVCN: Red Latosol - Campos Novos/SC; NBPS: Reddish-brown Nitosol - Ponte Serrada/SC; NBCUR: Reddish-brown Nitosol - Curitibanos/SC; LBVAR: Reddish-brown Latosol - Vargeão/SC; VESL: Dark Vertisol - Santana do Livramento/RS. Source: The Authors.
Figure 1 Soil* retraction index, determined using the ring filling method with sand - RI.
While analyzing the retraction evolution with drying, it has already been detected at ψm -10 and -100 kPa, with the exception of Vertissolo. On soils NBPAI A, LBVAC B, NBCUR A e B and NBPS A and B, it has been detected at a ψm of -10 kPa, while soils LBVAC A and LBvar A and B have been detected at a ψm of -100 kPa. In the case of Vertissolo, the retraction was only noticeable at 1,000 kPa (Table 5). Upon reaching a ψm of -1,500 kPa, retraction varied between 3,7 (LBVACA) and 8,7% (NBPS B). The greatest retraction occurred in ψm below -1,500 kPa, as can be observed by the large difference between the retracted volume between -1,500 kPa and the dry soil at 105°C. The soils LBVAC A and NBPS A showed the largest retracted volume at the end of drying, close to 46%, while LVCN A and B presented the lowest retraction, close to 20%.
As shown by Table 5, we observed that the retraction started at a macroscopic level, that is, when the water is retained between a ψm from -10 to -100 kPa. However, it gets intensified in ψm less than -100 kPa, suggesting that the retraction is related to processes that occur in soil microstructures, more precisely when the removal of water occurs in pores smaller than 0.2 µm in diameter, normally related to the pores drained at voltages above -1500 kPa. It is important to note that the water retained can be located in capillary pores (with equivalent diameters mentioned above), as well as adsorbed on the surfaces of mineral and organic particles.
Table 5 Soil retraction (%) as a function of water matrix potential during the drying of the analyzed soils.
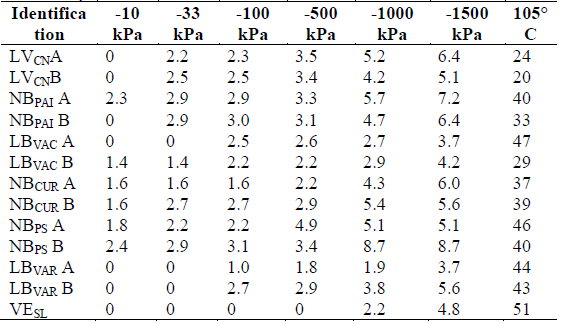
* NBPAI: Reddish-brown Nitosol - Painel/SC; LBVAC: Reddish-brown Latosol - Vacaria/RS; LVCN: Red Latosol - Campos Novos/SC; NBPS: Reddish-brown Nitosol - Ponte Serrada/SC; NBCUR: Reddish-brown Nitosol - Curitibanos/SC; LBVAR: Reddish-brown Latosol - Vargeão/SC; VESL: Dark Vertisol - Santana do Livramento/RS
Source: The Authors.
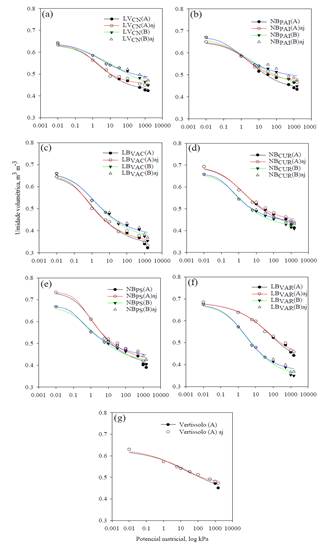
As noted above, all soils have retracted, to a lesser or greater degree. Thus, the water retention curves calculated by the standard procedure differed from the adjusted retention curves considering soil retraction (Fig. 2). The water retention curves calculated by the two procedures begin to differ from each other in ψm less than -100 kPa. However, in Vertisolo this difference occurs only for ψm less than -1000 kPa, that is, in the driest branch of the curve.
Source: The Authors.
Figure 2 Soil water retention curves adjusted by standard method (LVCN(A)) and adjusted by volume of soil retracted (LVCN(A)adj).
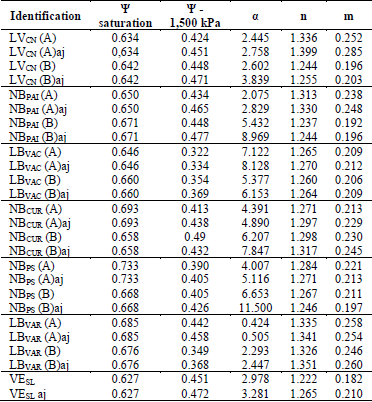
Table 6 Parameters of the water retention curve of van Genuchten model, for horizons A and B of the analyzed soils, adjusted by the standard method and adjusted by the method that considers the volume of soil retracted.
Source: The Authors.
We suggest that the change in the mass of the retractable soils is related, at first, to the soil structure, in a rearrangement of the microporosity. In the Vertissols, the retraction of the soil mass occurs close to -1000 kPa and, therefore, is related to very small pores, possibly formed by very small clay particles, which may be related to its mineralogy, since smectite has smaller dimensions than kaolinite [2].
The adjustment parameters of the van Genuchten equation α, n and m were higher in standard SWRC than in adjusted SWRC considering soil retraction. This increase indicates that there has been a reduction in water loss at the highest Ψm (highest α value), that is, the SWRC is less inclined than the larger Ψm, and that the water content decreases more rapidly at the end of the SWRC (values of n and m greater) that is, it is more inclined (Fig. 2). It is clear that, with the adjustment, considering the volume of soil retracted, the humidity in the PWP (-1,500 kPa) is higher and consequently the AW is lower, since the field capacity is not altered.
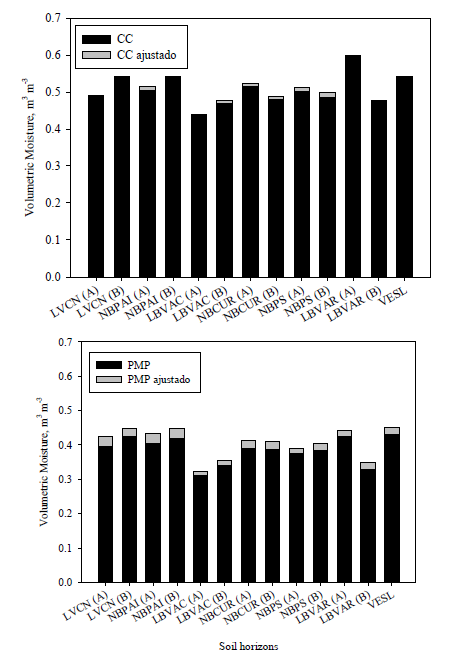
While comparing the curves obtained using the standard method with the adjusted curves considering the volume of soil retracted (Fig. 2), the FC of some soils have not differed or differed little (Fig. 3).
Source: The Authors.
Figure 3. Volumetric humidity in the field capacity (FC) and in the permanent wilt point (PWP) for horizons A and B of the retractable soils, calculated by the standard method in relation to the method adjusted by the soil retraction.
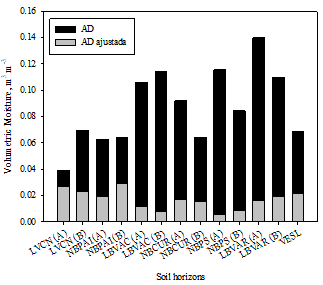
However, we observed that for PWP these differences were greater than for FC. The smallest difference in FC occurs, as the retraction of the soil begins to become noticeable only after Ψm of -10 kPa, and expands in the drier branch of the curve, close to the PWP. As a result, the higher PWP in the adjusted SWRC causes the available water content (AW) to decrease (Fig. 4). In some soils, the difference between methods was up to 40% in AW. This is more important when the crops are experiencing a period of water deficit or when the crop is more susceptible to water shortages.
Source: The Authors.
Figure 4 Available water content calculated by default method and calculated by the method adjusted by the soil retraction, expressed in content, for horizons A and B of retractable soils.
For those who are irrigating and keeping the soil more humid, the difference in the adjustments is smaller, because in potentials between -10 and -100 kPa the difference between the curves is small. However, for crops without irrigation, when the soil is drying out, the amount of water available should be calculated considering the volume of soil retracted, which is less than the default method. Thus, for retractable soils, we suggest adjusting the water retention curve considering the volume of soil retracted (adjusted method), in order to obtain the volumetric humidity closer to what would actually be available to the plants.
4. Conclusions
The water retention curves differ depending on soil retraction, a difference that starts around -10 kPa and increases in the drier branch of the curves. The most pronounced shrinkage starts with the water leaving the pores smaller than 2 µm and intensifies in the porosity range close to 0.1 µm.
In soils with a retractable character, the SWRC must be adjusted considering the volume of soil retracted. With this adjustment procedure, the field capacity remains similar to the default method, however the permanent wilt point is higher and the available volumetric humidity is lower.


