INTRODUCTION
Antiplatelets are drugs with property of inhibiting platelet and thrombus aggregation and formation, without significantly interfering with other segments of the coagulation cascade. Although clinically efficacious, they have some limitations, since platelet inhibition is relatively weak and can cause systemic side effects, such as irreversible inhibition of cyclooxygenase, which may lead to peptic ulcer, caused by the administration of aspirin, or the administration of ticlopidine, associated with agranulocytosis [1].
The discovery of the glycoprotein IIb/IIIa receptor (GP IIb/IIIa) as a common final pathway of platelet aggregation generated interest in the investigation of antagonists for this site, aiming for more specific effects and minimizing adverse reactions.
Receptors can be blocked and/or antagonized by various therapeutic agents, such as abciximab (monoclonal antibody), eptifibatide (synthetic heptapeptide), and tirofiban (non-peptidic intravenous mimetic of the sites of the amino acid sequence Arginine-Glycine-Aspartic Acid (RGD)) [2].
Tirofiban (figure 1) is a non-peptidic GP IIb/IIIa receptor antagonist derived from tyrosine. It mimics the geometry, stereoactivity and electrical characteristics of RGD, interfering with platelet aggregation [1, 2]. Due to its specific action, it was quickly adopted as treatment of acute coronary syndrome and became the most widely used drug for intravenous treatment [3]. Currently, the drug (tirofiban hydrochloride -Agrastat®) is marketed in Brazil due to the partnership between the pharmaceutical industries Aspen Pharma and Merck Sharp & Dohme, in the injectable pharmaceutical form (0.25 mg.mL-1).
Whereas even small changes in pharmaceutical formulations can lead to significant changes in the safety of the medicinal product, constant updating of analytical methodologies is required to ensure their quality and effectiveness. To ensure consumer safety, the methodologies developed should be stability-indicating and enable the identification and determination of levels of the main pharmaceutical impurities (figure 1) and degradation products in commercial formulations [4-6].
There are reports in the literature of methods using HPLC for the determination of tirofiban in pharmaceutical form [7-14] and biological matrix [15-21]. However, there is a lack of papers on the determination of tirofiban hydrochloride in the presence of synthetic impurities and degradation products. The drug was evaluated for the presence of tyrosine [14], however, an analytical method is necessary to determine different impurities, since different synthetic routes for the design of the same drug can generate different impurities [22]. In addition, methods that can assess tirofiban hydrochloride in the presence of its degradation products are required, which are also impurities, but obtained from the decomposition of the drug.
In this sense, the present work proposes the development and validation of a stability-indicating HPLC method for the determination of tirofiban and synthetic impurities, as well as to perform a stability preliminary study under forced conditions.
MATERIAL AND METHODS
Chemicals
For the method development was used the chemical reference substances (RS) of tirofiban, hydrochloride (Toronto Research Chemicals-TRC, Canada), impurity A (debutilpiperidine tirofiban or LN-butylsulfonyl-p-hydroxyphenylalanine) (TRC Canada) and impurity C (N-butanosulfonyl)-O-[4- (4-pyridinyl)butyl](S)-tyrosine) (TRC, Canada). The following reagents were also used: acetonitrile HPLC grade (Tedia, OH, USA), citric acid (Vetec, RJ, Brazil), hydrochloric acid (Synth, SP, Brazil), phosphoric acid (Vetec, sodium dihydrate (Vetec, RJ, Brazil), sodium chloride (Alphatec, Brazil), sodium hydroxide (Alphatec, Brazil), methanol HPLC grade (Panreac, OH, USA) and triethylamine (CRQ, SP, Brazil).
Chromatographic conditions
For the methodology development was used a high efficiency liquid chromatography Thermo Scientific Ultimate 3000 (Dionex), consisting of quaternary pump (LPG-3400SD), automatic sampler (WPS-3000 TSL), column compartment with temperature controller (TCC-3000RS), column C18 (4.6x250 mm, 5 µm-Agela Technologies, Promosil) and diode arrangement detector (DAD-3000) at 226 nm. Data acquisition and analysis were performed by Chromeleon software version 6.8 (Dionex, Thermo Fisher Scientific Inc.).
The mobile phase was composed of an aqueous phase of triethylamine 0.1%, acidified with phosphoric acid to pH 5.5, and an organic fraction composed of acetonitrile. The mobile phase was filtered with 0.45 fun membrane (Analytica, SP, Brazil).
The gradient system was used for mobile phase elution, with a proportion of 22% acetonitrile in the period between 0.0 and 2.5 min, varying to 25% in the period between 2.6 and 5.9 min, 35% in period between 6.0 and 16.9 min, returning to 22% until the end of the chromatographic run, in 20 minutes. The flow rate was maintained at 1 mL.min-1 and the injection volume was 20 µL. All samples were filtered with nylon syringe filter (0.45 µm; 13 mm) prior to chromatographic analysis.
Validation of the method
The validation of the analytical method was performed according to the International Conference on Harmonization of Technical Requirements for Registration of Pharmaceuticals for Human (ICH Q2R1) by analyzing the following analytical parameters: specificity, linearity, precision, accuracy, robustness, limit of detection (LOD) and limit of quantification (LOQ) [23].
The tirofiban hydrochloride RS and the impurities were dissolved in methanol and sonicated for 5 minutes in an ultrasonic bath to obtain the stock solution. Tirofiban is highly soluble in methanol [19]. Subsequent dilution in methanol was performed to obtain the working solutions of200 µg.mL-1 for tirofiban and 10 µg.mL-1 for impurities A and C. The tirofiban commercial form working solution was prepared by diluting it in methanol and sonicated for 5 minutes in an ultrasonic bath to obtain the final concentration of 200 µg.mL-1.
The method specificity was evaluated against the confirmation of the absence of interferents inherent in the formulation excipients and satisfactory separation of the degradation products formed in the preliminary degradation study with respect to the pharmaceutical and its impurities. The placebo was composed by sodium chloride (8 mg.mL-1), sodium citrate dihydrate (2.7 mg.mL-1) and citric acid (0.16 mg.mL-1), on an aqueous basis, using ultra purified water [24].
The determination of the LOD and LOQ was performed from the signal-noise of the analytical run, verified through the baseline, where the solutions were prepared at the calculated concentrations and evaluated experimentally for the drug and impurities.
The linearity of the method was established with calibration curves of 160, 180, 200, 220 and 240 µg.mL-1 for tirofiban hydrochloride, and 0.1; 1.5; 5.0; 10.0 and 12.0 µg.mL-1 for the impurities A and C. The results were plotted in graphs of the areas obtained as a function of the respective concentrations. Linearity was evaluated from the correlation coefficient (r) and analysis of variance by Anova, where the linear regression and linearity deviation of three curves obtained on different days for each analyte were verified.
The precision of the methodology was determined by repeatability (intraday) and intermediate precision (interday) tests. For the evaluation of the repeatability, six samples (n = 6) of concentration 200 µg.mL-1 for tirofiban hydrochloride and 10 µg.mL-1 for impurities A and C were prepared under the same conditions by the same analyst, in a short period of time. For the determination of intermediate precision, six samples, at the same concentrations above, were prepared under the same conditions, for three different days, by two different analysts (n = 18). The analysis of the results was performed by calculating the relative standard deviation between the determinations.
Accuracy was determined by the percent recovery of tirofiban hydrochloride and impurities, by adding known concentrations of drug reference chemical (160, 200 and 240 µg.mL-1) and impurities A and C (8, 10 and 12 µg.mL-1) in the placebo, being evaluated the percentage of recovery in each level of concentration.
Robustness was evaluated from the determination of the drug and its impurities by small changes in the nominal chromatographic conditions of the developed method. Six factors were selected and were evaluated by a Plackett-Burman factorial design (n = 12). The effect (E) of each factor and the estimated experimental error (EE) [25] were calculated. Changes in the pH of the mobile phase (± 0.3 units), flow rate (± 0.05 units), acetonitrile in the mobile phase (± 2%), wavelength (± 2 nm), column temperature (± 3 °C) and column mark, were valuated.
From the statistical evaluation, a numerical limit value was obtained, which defines if the modification effected interfered in the quantitative analysis. This value is usually derived from the test analytical method t, according to equation 1:
Here, Ex = effect of each factor, SEe = estimated experimental error. The effect is considered significant if it results in t > t critical.
Forced degradation study
The study of forced degradation of tirofiban hydrochloride was carried out by means of hydrolytic conditions (acidic and basic), oxidative, thermal and photolytic [26]. The acid hydrolysis occurred by addition of hydrochloric acid to the tirofiban hydrochloride solution, with final concentration of 1 mol.L-1, for 2 h. The basic hydrolysis, by addition of NaOH to the solution of tirofiban hydrochloride with final concentration of 1 mol.L-1, during 8 h. After the exposure period, the samples submitted to hydrolytic stresses were neutralized. Oxidative stress was performed by adding hydrogen peroxide 30 volumes to tirofiban hydrochloride at room temperature for 24 h. Thermal degradation occurred through the submission of tirofiban hydrochloride at 75 °C in a forced circulation oven 24 h. Photolytic degradation occurred by exposure of tirofiban hydrochloride to UVA radiation for 1 h. In all stress situations the final working concentration of tirofiban hydrochloride was 200 µg.mL-1. After the stress periods had ceased, to the determination of the specificity was added to the samples impurities A and C, both in the final concentration of 10 µg.mL-1. All samples were filtered and submitted to chromatographic analyse. The analyses were performed in triplicate in each condition tested.
RESULTS AND DISCUSSION
The determination of the maximum absorption band of tirofiban hydrochloride was evaluated in the analytical standard and dissolved in three different solvents: ultra-purified water, methanol and acetonitrile, by spectral sweeping, in the visible ultraviolet region using the photodiode arrangement detector. The absorption maxima were 226 and 276 nm, without distinction among the solvents used, even when compared to those reported in the literature in aqueous media [11]. However, it was observed that when acetonitrile was used as the diluent, the absorptivity was lower when compared to the other solvents. Impurities exhibited absorption maxima of 226 and 276 nm for impurity A and 226 and 255 nm for impurity C. Due to the results, 226 nm was used as the detection wavelength for determination of tirofiban hydrochloride and synthetic impurities A and C.
For methodology development, mobile phase proportions between 50:50 and 90:10, consisting of triethylamine 0.1%:acetonitrile were tested, and the pH of the aqueous constituent was analysed between 3.0 and 6.0. Elution in the isocratic mode was not satisfactory for the determination of tirofiban hydrochloride in the presence of impurity C, factor corrected using gradient.
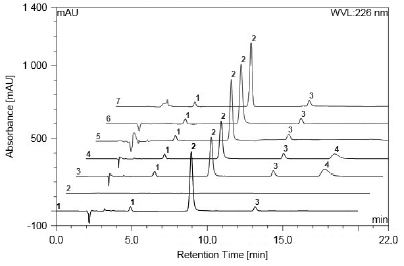
Gradient use provided good resolution between the compounds analysed. The working chromatographic condition was established in the proportion of 78:22 between 0.0 and 2.5 minutes; 75:25 between 2.6 and 5.9 minutes; 65:35 between 6.0 and 16.9 minutes, with the initial proportion returning between 17.0 and 20.0 minutes. The flow remained constant at 1 mL.min-1 and the injection volume was 20 µL. Retention times for impurity A, tirofiban and impurity C were 4.72, 8.38 and 12.88 minutes, respectively (figure 2), showing efficiency in the separation of the compounds, as well as specificity to differentiate structurally similar products. The chromatographic system was adequate, with resolution, symmetry and number of theoretical plates, according to the recommended in the literature [27, 28].

Figure 2 Chromatograms: 1 Impurity A (10 µg.mL-1 - peak 1), tirofiban (200 µg.mL-1 - peak 2) and impurity C (10 µg.mL-1 - peak 3); 2 Placebo; 3 Acidic degradation: tirofiban (peak 2), impurity A (peak 1), impurity C (peak 3) and degradation product (peak 4); 4 Alkaline degradation: tirofiban (peak 2), impurity A (peak 1) and impurity C (peak 3) and degradation product (peak 4); 5 Photolytic degradation: tirofiban (peak 2), impurity A (peak 1), impurity C (peak 3); 6 Oxidative degradation: tirofiban (peak 2), impurity A (peak 1), impurity C (peak 3); 7 Thermal degradation: tirofiban (peak 2), impurity A (peak 1), impurity C (peak 3).
The specificity of the method was assessed by absence of excipients interference and degradation products formed under different stress conditions. The tirofiban hydrochloride pharmaceutical form is marketed in Brazil in citrate buffer, in this way an SSE on an aqueous basis, was analysed in triplicate.
Based on the chromatogram, shown in figure 2, it is possible to verify no interference of the SSE, both with respect to the drug and its impurities. The specificity of the analytical method was also evaluated in relation to the degradation products generated by exposure of tirofiban hydrochloride to stress conditions.
The results showed susceptibility to hydrolytic reactions. Acidic degradation, for example, showed a greater influence, leading to degradation of 19.63% of the initial concentration in 2 h of exposure, whereas in basic media degraded 14.39% in 8 h of exposure (figure 2).
In both hydrolysis reactions, it was possible to detect a degradation product with the same elution time (16.8 minutes) and the same ultraviolet absorption spectra, suggesting that the same PD occurs in acidic and basic hydrolysis.
The tirofiban was also susceptible to photolysis, with a decrease of 11.07% of the concentration when exposed to UVA light for 1 h, however, the developed methodology was not able to detect the products from this degradation.
The drug did not present a decrease of the concentration, nor the appearance of degradation product during the 24 h analysed under drastic conditions of thermal and oxidative stress, being considered practically stable to these conditions [26].
The method was selective, in other words, it was able to determine the drug and impurities A and C in the presence of the degradation product formed (figure 2). The peak purity analysis, evaluated by the equipment software, using the photodiode array detector, suggests that in all cases the peaks analysed were of adequate purity. Considering the data, it can be confirmed that the developed method presents the stability-indicating capability capacity indicative of the stability.
LOQ and LOD levels were respectively 2.12 and 1.00 µg.mL-1 for tirofiban, 0.09 and 0.07 µg.mL-1 for impurity A and 0.08 and 0.06 µg.mL-1 for impurity C. The value of LOQ found for impurities was lower than the respective threshold of notification established by ICH [29] and, therefore, the methodology developed serves its purpose.
The linearity of the method was established by triplicate assay, individually for tirofiban and its impurities. The correlation coefficients (r) obtained for the analytical curves presented values of 0.9999, 0.9999 and 0.9999 for tirofiban hydrochloride, impurity A and impurity C, respectively. These results demonstrated a high correlation between the analytes concentration analysed and the equipment response, according to the literature [23]. In the ANOVA statistical analysis, the results were significant for linear regression and not significant for linearity deviation, at a significance level of 5%, thus proving a linear correlation between the variables.
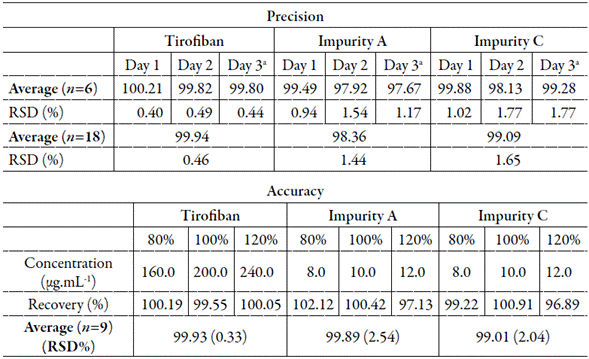
The precision of the method was determined by repeatability (intraday) and intermediate precision (interday) tests. The results obtained (table 1) show that the precision of the developed method is within acceptable limits since it presented a relative standard deviation (RSD) of less than 2% in both repeatability and intermediate precision analyses [27, 28].
Table 1 Results obtained for evaluation of precision and accuracy of the analytical methodology for determination of tirofiban and impurities A and C.

aAnalyst 2; RSD= relative standard deviation.
Accuracy was determined through the recovery test, by the method of addition of standard in the matrix, relating the observed and nominal concentration. The obtained averages are described in table 1. A satisfactory recovery content for tirofiban hydrochloride and its impurities A and C, of 99.93%, 99.88% and 99%, respectively, it was observed, corresponding to works of the literature admitting a variation of 2% for the finished product [27, 28], although some authors allow the expansion of this content by up to 20% for synthetic impurities [27, 28].
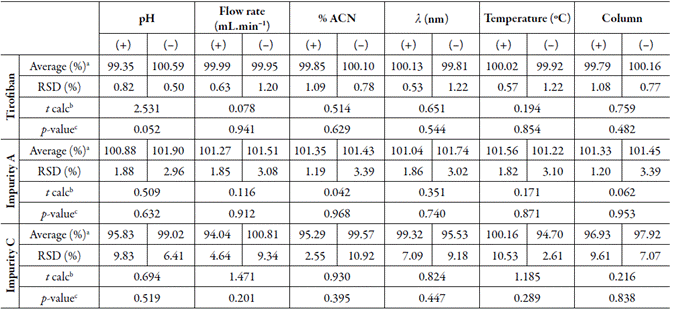
The robustness of the method was evaluated from the determination of the drug and its impurities by small changes in the nominal chromatographic conditions of the developed method. Table 2 presents the factorial design and statistical analysis. The results show no statistically significant difference using the Student's t-test for p = 0.05 (critical t = 2.57).
Table 2 Parameters evaluated and results obtained in the robustness test.

aAverage n=6
b Not significant for p=0.05 (p critical = 2.57)
c Statistical responses of the Student T test application by comparing the parameters evaluated with the nominal parameter
% ACN= percentage of acetonitrile in the mobile phase composition; %M= average percentage; λ= wavelength; RSD= relative standard deviation; t calc= t-value calculated from Student’s t-test.
Considering the results obtained, the method developed and validity by HPLC-DAD showed to be specific, selective, sensitive, linear, precise, accurate and robust to quantify tirofiban hydrochloride and synthetic impurities A and C, in the presence of the products of degradation. In this way, it can be used as a stability-indicating method in the quality control of the raw material of tirofiban hydrochloride, as well as of the finished product.


