Introduction
Rainfall significantly influences agricultural production. Rain supply, as well as frequency and duration of drought period, contribute to decision- making in the cropping season (Keller-Filho et al., 2006), among other management activities. In the north of Mato Grosso, Brazil, economy is based on beef cattle. The implementation or renewal of pasture, regrowth and sealing of the grass, as well as the whole cattle management calendar depend on rainfall amount and distribution. The occurrence of floods are also aspects to be considered, given the many watercourses, which often make it difficult to access the back roads. Not to mention the importance also for the design of dams and spillways for the construction of Hydroelectric Power Plants (CGHs) in the Arinos and Juruena rivers, as well as the operation of Small Hydroelectric Power Plants in the region (e.g.: Semi plant, in the Paranorte district).
The economic model of land use in northern Mato Grosso is based on deforestation for the expansion of agricultural activities. The removal of native vegetation causes changes in some soil surface properties, such as increased reflectance surface (albedo) as well as in the increase reflectance surface (albedo). These changes have the potential to influence rainfall. For each percentage of deforestation in the Amazon, it is estimated that the onset of rainfall will be delayed by 0.12 to 0.17 days (Leite-Filho et al., 2019). The general circulation of the atmosphere also directly influences the volume of rainfall. One of the main causes of the variation in rainfall is attributed to the Southern Oscillation El Niño (ENSO) and La Niña, and intensity (weak, moderate, strong) (Souza et al., 2018).
In the related literature, there are many works developed to investigate the rainfall regime, either in macro regions, orienting the study to some state of the Federation (e.g.: Keller-Filho et al., 2006; Gomes and Cruz, 2002; Pertussatti, 2014; Oliveira et al., 2015), or microregions specifically oriented to some municipalities (e.g., Delgado-Assad and Rodrigues-Castro, 1991; Silva et al., 2005; Souza-Lima et al., 2008). The methodology varies according the aim of the study, being common geostatistical analyses, with semivariograms graphs as a function of time (Silva et al., 2005; Souza-Lima et al., 2008). They are often intended to generate information about rainfall volume and distribution (Campelo Jr., 1993; Silva et al., 2005), drought frequency and duration (Delgado-Assad and Rodrigues-Castro, 1991; Silva et al., 2005; Pertussatti, 2014). Some studies also seek to establish a causal relationship of changes in the hydrological cycle with deforestation (e.g., Leite-Filho et al., 2019) and with the El Niño Southern Oscillation - ENOS (e.g., Oliveira et al., 2015).
The present study aimed to generate information about the rainfall regime in a region south of the Amazon rainforest, more precisely in the district community of Paranorte, with administrative headquarters in Juara-MT. Specifically, it aimed to identify the beginning and end of the rainy season, as well as the frequency and intensity of rainfall. It also aimed to investigate causal relationships between ENSO phenomena and rainfall in the region.
Material and methods
In this study, the rain data obtained at a collection station located near the district of Paranorte (10°17’55 “S, 57°37’11” W) with administrative headquarters in Juara-MT, were analysed. It is located in the marginal depression of the Southern Amazon (Ross, 2011) with an approximate altitude of 380 m a.s.l., in a transition region between tropical monsoon climates (Am) and tropical savannas (Aw / As), according to the Koppen/Geisen (Kottek et al., 2006).
Data are rainfall measurements, expressed in height of water column (mm), and correspond to a time series of 16 years (2002/2003 to 2017/2018) defined as the period between August and July of the next year. Rainfall measurements are coming from a collection station, centralized on a gap between the five agrometeorological stations in the region (Juína, 159 km; Juara, 98 km; Cotriguaçú, 108 km; Apiacás, 98 km; e Alta Floresta, 191 km). A plastic rain gauge with a millimetre scale and a maximum volume of 150 mm was used. The meter has been installed respecting the necessary technical precautions, mentioning a height of 1.5 m and a distance greater than twice the height of the nearest obstacle. The measurements were done at six in the morning. The database contains, for the first five years, accumulated records of each month, and, for 2007/2008, records of daily readings.
The rainfall measures were worked in order to obtain the following variables: (1) accumulated annual precipitation; (2) accumulated monthly precipitation; and (3) dry day count. The variables ‘accumulated annual precipitation’ and ‘accumulated monthly precipitation’ were subjected to exploratory analysis, and descriptive statistics were estimated. The adherence of the empirical distribution to the normal distribution was also verified through graphical analysis and the Shapiro-Wilk test (a = 5%). The variable ‘dry days count’ was used to study the frequency and duration the drought period. These have been defined as an unbroken sequence of dry days, understood here as days without appreciable rainfall. More precisely, the drought was defined as a period greater than five dry days, considered days without precipitation greater than 5 mm. Data were considered only from the months of the rainy season (September to May), as there was no agronomic sense to perform these analyses during the dry season (June, July, August).
The accumulated monthly precipitation (average of sixteen years) was represented in a column chart with the respective confidence intervals of the average. These intervals were estimated in order to proceed to the test of comparisons between means, two-tailed, with α = 5%, such that,  , from the Student t distribution with n-1 degrees of freedom.
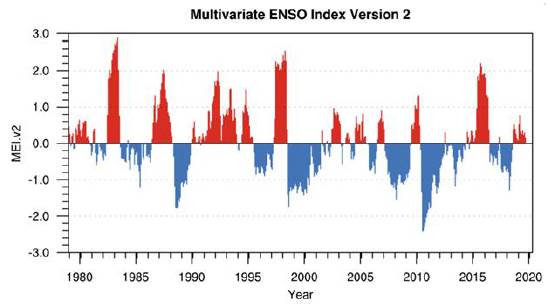
Rainfall measurements were compared with atmospheric and oceanic indexes, which has been used in different studies (eg, Lopes et al., 2007; Schossler et al., 2018) as a way to synthesize information about the occurrence and intensity of the rainfall. The index, called MEI (Multivariate Enso Index), combines five oceanic and atmospheric variables: (1) sea level pressure, (2) Pacific surface temperature, (3) zonal components of surface winds, and (4) southern components surface wind, and (5) longwave radiation. These variables were measured in an oceanic region comprised between latitudes 30°S and 30°N, and longitudes 100°E and 70°W, known as the Niño 1 + 2 region. The MEI index was estimated with overlap for twelve months of the year, from December/January to November/ December. The method for obtaining the MEI index involves principal component analysis (PCA), applied to the five oceanic variables previously mentioned. Variables are normalized before ACP application. The index therefore corresponds to coordinates of the first unrotated principal component (CP1). Data were obtained from the Physical Sciences Division website (NOAA, 2019), which gives new MEI estimates each month, making them available for download (Figure 1).

Figure 1 Temporal oscillation of the MEI index (Multivariate ENSO Index), indicating the occurrence of El Niño (red) and La Niña (blue) phenomena. Source: <https://www.esrl.noaa.gov/psd/enso/mei/>.
The degree of association between rainfall (bimonthly average of 16 years) and MEI index was assessed through Pearson correlation estimates, which were interpreted according to Lopes et al. (2007), and are significant at the 5%, 2% and 1% significance levels, respectively. The analyses were implemented using the computer application ‘R’, version 3.6.0 (R Core Team, 2017), with GNU E-Macs application support to build the programming lines, necessary for the implementation of the analysis. We also used packages from the CRAN-R repository, including pastecs (descriptive statistics), ggplot2 (graphs) and fitdistrplus (adjustments to distributions), among others.
Results and discussion
Accumulated annual precipitation
In the north of Mato Grosso there is a very rainy core with annual rainfall that accumulate up to 2750 mm (Rosa et al., 2007). The target region of this research, in the district of Paranorte, Juara-MT, is in this nucleus of high precipitation. Year averages accumulated volume was 2562 mm. Although rainfall varies greatly (3350 mm in 2013/2014 and 1500 mm in 2015/2016) (Figure 2), approximately 95% of assessed years had accumulative annual rainfall between 2322 and 2720 mm.
Accumulated monthly rainfall precipitation
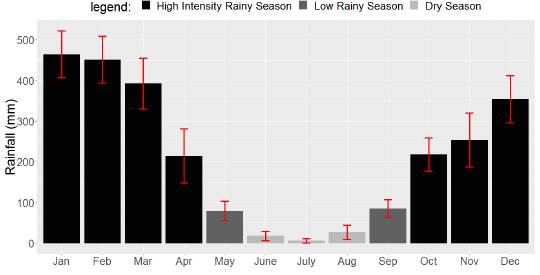
The average of accumulated rainfall volume for each month showed that rain increases from September, stabilises in January and February, and decreases in March. The months with increasing volume of rainfall have lower accumulated rainfall than the months when rainfall is decreasing, indicating that rainfall recovery in the rainy season is a slower process (Figure 3).

Figure 3 Precipitation accumulated in the months of the year. Each column represents the month average, obtained in sixteen years of measurement, with the respective confidence interval (α = 95%).
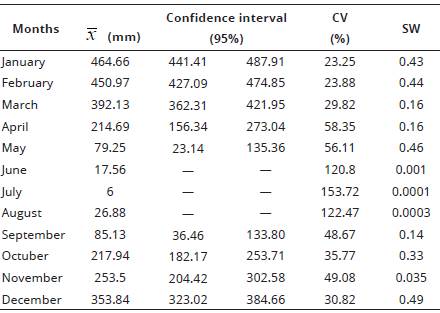
For the three driest months of the year (June, July and August), rainfall occurred sporadically, with extreme valúes  , which inflated the variation in the data (120.8% <CV <153.72%). This variation is a source of uncertainty about the expected volume of rainfall, which can range from rain lessness to sparse rainfall events (Table 1). The referred increase in variation rainfall is also reported by other authors, who attribute it to the fact that the average is greatly influenced by extreme values, which include, for example, zero (Delgado-Assad and Rodrigues-Castro, 1991; Silva et al., 2005).
Table 1 Descriptive statistics of the variable accumulated monthly precipitation (mm), measured at a collection station near Paranorte district, between 2002 and 2018.

 : estímate of rainfall average; CV: coefficient of variation (%); and SW is the p-value test of Shapiro Wilk (5%).
Two distinct seasonal periods were identified, according to accumulated monthly precipitation, with a 95% reliability. The year can be divided into a dry and a rainy season. The rainy season runs from September to May, with low rainfall  , and October to April with high rainfall
  . In turn, the dry season occurs from June, to August
  (Figure 3). Related literature (e.g., Souza et al., 2013; Oliveira et al., 2015) shown that the rainy period in the state, occurs form October to April, and September and May are considered both dry or rainy months. As mentioned, the present study considers these months as rainy, but of low rainfall.
There are many factors that influence the periods of rain and drought in regions of Amazon rainforest. At least nine factors can be listed (Serrao et al., 2015). Among these, the southern displacement of the Inter Tropical Convergence Zone (ITCZ) is crucial (Alves, 2010; Serrão et al., 2015). In the summer solstice, the ITCZ is determinant for the presence of rainfall in South America, while in the winter solstice, this same region receives little or no rain (Alves, 2010). Therefore, the ITCZ largely explains the drought in June, July and August.
The empirical distribution of data adhered to the normal distribution by the Shapiro Wilk test (α = 5%) in almost all months of the year, except for the dry season months (Table 1). From this, some inferences were possible. In January, the average rainfall is not less than 441.41 mm in 95% of the years. The rainfall forecast for the other months of the year, considering a 95% confidence interval, is shown in Table 1.
Occurrence of drought events
The definition of dry days varies in literature. The most reasonable criterion is to establish daily evapotranspiration as the limit value of precipitation, which depends on many factors, such as the predominant plant species in the landscape. Some authors (Delgado-Rojas et al., 2004; Silva et al., 2005; Muniz et al., 2014) report evapotranspiration values close to 5 mm.day-1 in pasture cultivated areas. In turn, longer than five dry days has the potential to cause damage to agricultural activity (Delgado-Assad and Rodrigues-Castro, 1991). Therefore, the definition of drought adopted in the present study (sequence of five days with precipitation not exceeding 5 mm) is adequate, considering that the target region is predominantly occupied by pasture.
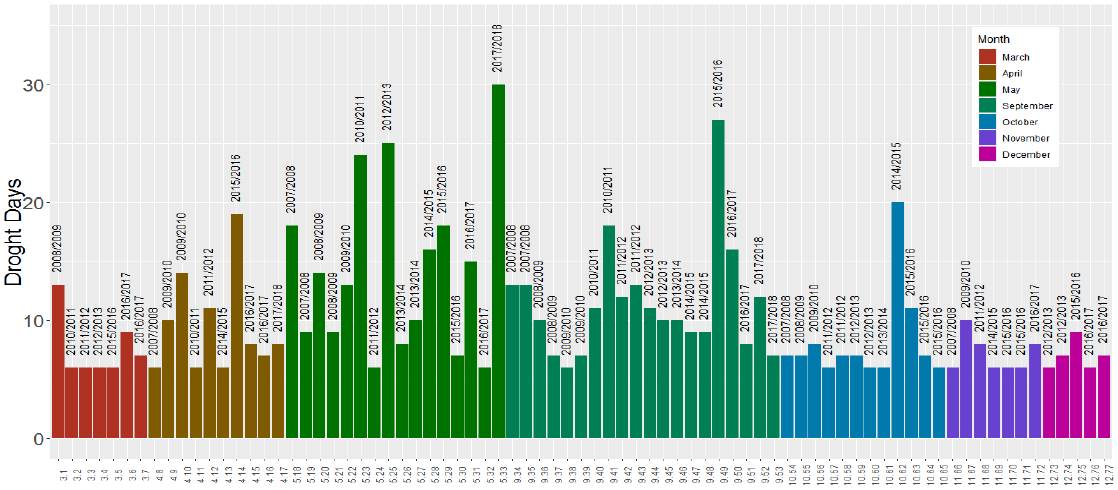
June, July and August were disregarded for constituting the dry season of the year. January and February had no drought events in any of the eleven years studied. Drought events occurred most often in the months that open the rainy season (20 drought events in September) and close (16 drought events in May). They are also more intense, often lasting more than 10 days and sometimes longer than 20 days. In March, April, October, November and December, shorter periods of drought predominate (Figure 4).

Figure 4 Months and years with occurrence of drought in the rainy season, as well as their duration, in number of dry days (precipitation not exceeding 5 mm). The evaluation period comprises eleven years (2007/2008 to 2017 / 2018).
Drought events are expected in months with lower volume and worse rainfall distribution. The number these events correlated negatively and moderately with accumulated monthly rainfall (r = -0.52), confirming the perception that its occurrence is associated with a low volume of rainfall. In fact, the years with the lowest accumulated precipitation presented minor drought problems. The occurrence of droughts can also be associated with the distribution of rainfall, as observed by Sleiman (2008). The coefficient of variation of daily precipitation measurements for each month provides useful information about rainfall distribution. In this case, a moderate but positive correlation was found between dry days and the coefficient of variation (r = 0.41). These results indícate that droughts occur more frequently in months with lower volume and worse rainfall distribution.
The state of Mato Grosso has three biomes. The rainfall in the north, where the Amazon biome predominates (2000 to 3000 mm year- 1), may be more than double the rainfall in the Pantanal biome (1250 mm year-1). In a general way, the droughts events are longer in October and November (Pertussatti, 2014). However, this is information that may vary widely in regions as contrasting as rainfall. In the target region of the present study, drought events occurred more frequently and more rigorously during the months of May and September.
ENSO Phenomenon and their implications on rainfall
ENSO phenomena cause changes in rainfall patterns in the southern hemisphere, some regions being more influenced than others (Oliveira et al., 2015). In some microregions, such as the Juruena River basin, where Paranorte is located, the La Niña phenomenon can significantly influence annual precipitation, even at moderate intensity. In turn, the strong El Niño causes a reduction in the cumulative volume of the year, especially in the low regions that form the mouth of the Juruena (Souza et al., 2018). In the present study, the year with the lowest cumulative rainfall (2015/16) showed the strongest El Niño, indicating that warming in the Pacific waters may exert influences the rainfall regime in this region.
From the correlation estimates between the MEI index and the bimonthly mean rainfall, the relationship between ENSO phenomena (Niño 1 + 2) and rainfall in the target region of this research was investigated. In some studies (eg, Lopes et al. 2007), rainfall is confronted with the temperature of the ocean two or three months before rainfall. This refinement is due to the fact that the rains are the result of the ocean/atmosphere interaction that occurred in a past period, which precedes by some months the recorded rains. However, in the present study, the regression of rainfall as function MEI indices, lagged at two (r2), three (r3) and four (r4) months, did not result significant changes in correlation estimates (r2 = -0.0068, r3 = 0.0482, r4 = -0.0198). Thus, the possible association between El Niño and La Niña with rainfall in the region was investigated without use of this refinement. The correlation between these variables, in a pairing involving all bimester between 2002 and 2018, was weak and negative (r = -0.1908ns), not reaching the significance level. Therefore, it is not possible to state that anomalies in Pacific temperature, particularly in the Niño 1 + 2 region, cause any changes in rainfall of target region of this research.
Through linear regression performed separately to each bimester, using bimonthly precipitation averages (e.g., Jan/Feb, mean of sixteen years), a significant correlation was observed for the following bimesters: October/November (r=0.49**), November/December (r= 0.77**) and December/ January (r = 0.25*) (Table 2). This result indicates that, between October and December, Pacific temper ature abnormalities in the Niño 1 + 2 region may significantly influence rainfall in Paranorte, during spring. This result agrees with the literature reported for other Brazilian regions. According to Berlato and Fontana (2019) spring and early summer (autumn, November and December) is one of the most influenced by ENSO phenomena in southern Brazil. Therefore, although anomalies in Pacific temperature influence regions differently, the rainfall regime seems more vulnerable to changes in the spring, in regions of high or low latitudes.
Implications on agricultural activities
The rainfall regime in Paranorte is capable of ensuring the annual production of pasture to feed the cattle herd. The exploitation of any other plant species finds no impediment in regard to the rainfall regime. Coffee, for example, is found in Juara and neighbouring municipalities, such as Colniza, Nova Bandeirantes, Castanheira, among others. The region offers good conditions for both planting and coffee development. Lazzarotto et al. (2005) mentions that planting should always be under conditions of long rainy periods (such as November, December and January in Paranorte).
Considering the possibility of soybean and corn cultivation, the region offers opportunity for two harvests. Sowing in the second half of September would position the harvest at the end of December. Unlike corn, whose grains are protected by layers of straw, soybeans are extremely sensitive and intolerant to excess rainfall at harvest, and can lead to losses ranging from grain depreciation (sour grain) to total loss (grain germinating in the pods). It would be advisable to position soybean cultivation so that harvesting takes place at the end of the rainy season (April) to avoid risk of crop loss. Thus, considering only the risk of harvest losses, sowing in January would be recommended.
In the case of maize, cultivation for grain production has been restricted, in most producing regions, to months with decreasing rainfall. It is called second crop corn or safrinha corn. In Paranorte, both first and second crop cultivation may be recommended. If cultivated in the first crop, the month of September (second fortnight) has sufficient rainfall for the installation of the crop, which would be harvested four or five months later; ie, in December or January. During these months, there may be problems with excessive rainfall, making it difficult the outflow of production.
Therefore, there is the opportunity to grow corn in the first crop and soybean in the second crop, provided that using cultivars with indeterminate growth or long juvenile period. Additionally, it is mentioned that the positioning of corn in first crop and soybean in second crop offers the opportunity to better price the harvested product, because the harvest would be concentrated in off-season months.
Conclusions
The rainfall regime in the north of Mato Grosso, especially in Paranorte, Juara-MT, has the following characteristics:(1) the accumulated annual precipitation ranges from 2322 to 2720 mm; (2) there are two seasonal periods: a dry season (June, July and August) and a rainy season, subdivided into low intensity (May and September) and high intensity (October, November, December, January, February, March and April); (3) prolonged droughts occur most often at the beginning (September) and end (May) of the rainy season; and (4) the El Niño South Oscillation phenomenon influences rainfall in the spring months.


