INTRODUCTION
Characidae is the most diverse fish family within the order Characiformes 1,2. Among these, the genus Bryconamericus, with more than 80 species, groups small fish that form schools and feed on invertebrates and particles suspended in the water column 2. Because the food that fulfill these characteristics are so abundant, Bryconamericus species have developed multiple trophic strategies that have allowed the syntopy with other groups within their geographical range 3.
The study of trophic habits of fish through the analysis of stomach content is a tool that provides direct information on important aspects of the natural history of the species 4. To know what a species consumes give insights on both the behavioral patterns of the species and its position in the trophic web 5-8. Likewise, to understand the trophic interactions of predators is crucial to develop conservation and strategies for sustainable management 9. Currently, seven species of Bryconamericus have been described from the Cauca-Magdalena River basin in Colombia 10,11. There are, however, few studies that provide ecological information on their conservation status. In fact, data on habitat, diet and reproduction are only available for B. caucanus, which has a wide distribution in the Cauca-Magdalena and Sinú river basins 10,12,13, see discussion. Specifically on the reproduction of Bryconamericus species there are studies by Román-Valencia & Muñoz 14 for B. galvisi, observations by Kramer 15 on B. emperor, Flecker et al 16 and Taphorn 17 for B. cismontanus and B. alpha, in addition to Román-Valencia & Muñoz 12 for B. caucanus (see discussion).
This work analyzes the diet and reproduction of B. caucanus La Venada creek, Río Quindío, Alto Río Cauca, in the Central Andes of Colombia. In particular, we provide basic information is provided that allows the conservation of both the species and its habitat. The impact of exhaustive agriculture, the construction of hydroelectric power plantsplants in adjacent areas and the development of exhaustive mining plans in the Andes of Colombia are considered.
MATERIALS AND METHODS
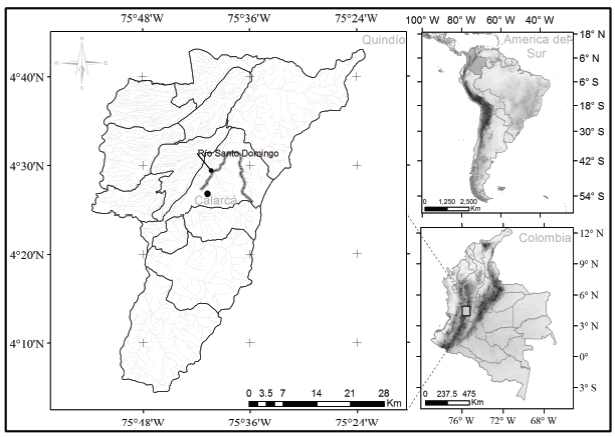
Study area. The samplings conducted in the middle and lower areas of La Venada creek, tributary of the La Negra stream, Santo Domingo River drainage, Quindío River in the Upper Cauca, Calarcá, Quindío, Andes of Colombia. The creek is located between 4°26’47.4”N -75° 40’44.3” W (1,661 masl) and 4°26’54.9 “N -75° 40’48.8” W (1,307 masl, Figure 1). The area is classified as a Tropical Humid Forest 18, with two rainy periods between March-May and September-November, accompanied by two dry periods between June-August and December-February 18,19.
The La Venada stream is a source of water for more than 500 inhabitants of the corregimiento Negra municipality of Calarcá and neighboring farms (Quindío, Colombia). Throughout its course, this creeks is heavily intervened by cattle and intensive farming activities, which involves the direct or indirect discharge (e.g., run-off) of toxic agrochemicals into the creek. The social and economic context in which this creek is immersed is quite hostile and rough so the survival of fish populations, macroinvertebrates and other organisms that coexist there have been significantly affected. Additional data on the physical-chemical characteristics of the La Venada stream has been previously reported in Román-P et al 19 for the years 2011-2012.
Data collection. Monthly, between January and December 2013, specimens of B. caucanus were captured using trawl net of 2m × 0.5m and a 0.5cm eye mesh. To delay the enzymatic degradation of the stomach contents, fishes were preserved in situ in a polyethylene box with ice and transported immediately to the Ichthyology Laboratory at the Universidad del Quindío, Armenia, Colombia (UQ). Specimens were deposited in the scientific collection of the same institution (IUQ).
In the laboratory, uroventral dissections were performed for the extraction of the digestive tract (stomach, pyloric blind gut and intestine) and reproductive structures. Biometric measurements were taken using a Mitutoyo calibrator (± 0.01 mm). The total length (LT), standard length (LS), of the digestive tract were also recorded, in addition to the length of the intestine (Li), length of the stomach (Le), and width (Ae). The total weight of each specimen, gonads and stomach were also registered using an Adventurer-Ohaus H226 scale (± 0.0001 g).
Reproduction. The ratio between the sexes in the population compared to the ratio of an expected ideal population (1:1) was evaluated by applying a chi-square test (X2).
The Gonadosomatic index (IGS) was used to analyze the temporal variation according to sex during the sampling period. According to Vazzoler 20, the IGS is defined as IGS = (Wg/WC) x100, where, Wg represents the weight of the gonad and Wc the weight of the body.
It is assumed that the peaks explain periods of high reproductive activity in the species. The average size of sexual maturity was calculated from the graphic method as Ls 50%, that is, the size at which 50% of the individuals of the population are sexually mature. The criteria to define the stage of gonadal maturity has been previously described by Vazzoler (20) and Román-Valencia 21.
The fecundity and the diameter of oocytes were determined through the dry subsample method 22. The equation Fa = Σn°/N° was followed, where n° is the number of oocytes per gravid female and N° the total number of females. The average diameter of the oocytes was calculated using a millimeter sheet. This method has been previously described in detail by Morales and Garcia-Alzate 23.
The condition factor (K) was calculated to evaluate the feeding condition and the energy reserves of the species. The equation K =Wt*105/LS3 is applied. Where: Wt corresponds to the total weight of the sample and LS to the standard length.
Digestive tract morphology. The biometric variables recorded were analyzed using linear correlations using the cor function in statistical package R. Linear association between pairs of variables with significant correlation coefficients greater than 70% (r> 0.7) was assumed. The quotient standard length (Ls) / intestine length (Li) was estimated as an initial approximation to the trophic habits of the species.
Trophic structure. The representativeness of the samplings was estimated using a randomized accumulation curve of the prey or food items compared to the number of sampled stomachs. This analysis was performed in estimateS version 8.2 24. Chao I and II were used as richness estimators. Our results are specifically based on Chao II because it is a less to small samples. This analysis assumes that the increase in the size of the sample (i.e. number of stomachs) generates a decrease in the trophic richness variance. The curve therefore tends to an asymptote consequence of the less frequent appearance of new prey. All prey were identified to the lowest possible taxonomic category using dichotomous keys.
Once the food items were determined, the numerical importance of each prey was estimated using the numerical percentages (% N) defined as: (ni / Np) * 100. Where ni is the total number of representatives of prey i; Np is the total number of prey consumed. The volumetric percentages (%V) and frequency of occurrence (% Fo) were also estimated. The volume of each item was approximated to an ovoid spheroid (19). Each of these measures explains different aspects of the trophic habits of a taxon. Abundance is informational according to feeding behavior. The occurrence includes the trophic strategy at the population level and the volume reflects the nutritional value of the prey 8.
A more exhaustive analysis of these three indexes at a populational level was done the three-dimensional chart proposed by Cortes 8, as a modification Costello’s method 25. In this, each point represents the percentage of occurrence and abundance of a particular category of prey. Analysis allow to discern between (i) dominant and rare prey, (ii) specialized or generalist feeding strategies, in addition to (iii) the contribution (volumetric or numerical) of each item. The percentage value of the relative importance index (% IRI) proposed by Pinkas et al 26, was also calculated which incorporates the three indices described above in a non-linear way (% N,% V,% Fo).
A Principal Components Analysis (PCA) was performed based on transformed volumetric values using log (x+1). This approach to the characteristics of the trophic niche was made for the following groups: weather season (low and high rainfall), sex (males and females) and stage of development (juveniles and adults). Statistical differences were evaluated between the groups (time, sex and stage) by applying a non-parametric multivariate analysis of variance (i.e. PERMANOVA) implemented in the vegan statistical package 27 under the adonis2 function. Finally, the niche amplitude values were estimated for each group and the overlap between pairs was compared, using in both cases the Levins index implemented in the spaa package 28.
RESULTS
Reproduction. A total of 162 specimens were captured (13.5 individuals / month). Among these, 73 were females, 69 males and 20 were immature. The sex percentages did not show statistical differences (X2 = 0.072, gl = 1, p = 0.3). However, there was a slight predominance of females in the population (1.05 females: 1 males). In total, 21 mature females were registered during the sampling. The values of Gonadosomatic index for them varied between 0.2 and 2.6. Likewise, females also showed higher values in the gonadosomatic index throughout the sampling months, except in May and between December and January, where they were lower than the records for males (Figure 2). The maximum for females were registered during both rainy periods (March-April and September to November). Spawning periods are inferred for the months following the IGS peaks. The males exhibited consistently low IGS values compared to the females. However, throughout the year, some maximum precede the equivalents in females (e.g., February and August). Males had a lower average size at sexual maturity (LS50% = 56.11 mm) than females (59.1 mm, Figure 3). A sexual maturation size for the population of 58.0 mm of standard length was estimated.
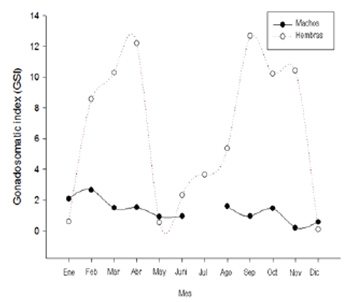
Figure 2 Variation of the gonadosomatic index by sex of Bryconamericus caucanus along an annual cycle in the La Venada creek, Quindío River, Alto Cauca, Colombia.
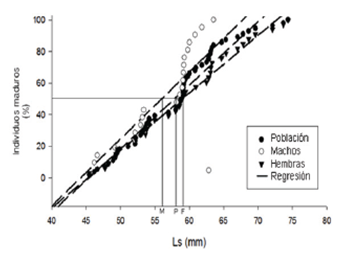
Figure 3 Size of first sexual maturity for the studied population of Bryconamericus caucanus in La Venada creek, Quindío River, Alto Cauca, Colombia. February - December 2013, January 2014. Ls: Standard length; M: males; F: Females and P: Population
Fecundity and diameter of oocytes. The mean absolute fertility (Fa) was 1.252 oocytes (±768, n=21). Gravid females presented a maximum of 3.864 and a minimum of 314 oocytes per female. The average diameter of the mature oocytes was 0.60 mm (±0.005).
Condition factor (K). The condition factor varied noticeably during the sampling. Females and males presented similar trends in the index during the first months, but after August, they became evidently dissimilar (Figure 4). It is suggested that this may be an annual pattern for the initial (first months) and terminal (last months) form of the graph. The males showed lower values compared to the females during most of the samplings (except in March). The females exhibited the highest values of condition factor in coincidence with the maximums for IGS. Finally, a decrease in the K-index values during the dry season is evident.

Figure 4 Mean values for the condition factor (K) in the studied population of Bryconamericus caucanus, La Venada creek, Quindío River, Alto Cauca, Colombia. February - December 2013, January 2014.
Morphology of the digestive tract. The stomach of B. caucanus registers four pyloric caeca arranged laterally. It shows an elongated tendency with an average length of 10.7 mm (SD ±1.71) and an average width of 5.6 mm (±1.14). The intestine has an average length of 43.6 mm (±12.3), without significant correlation regarding total length (r=0.24, p =0.078). The relation standard length and length of the intestine was positive and significant (r=0.3, p=0.032). For B. caucanus there is an average ratio between the standard length and the length of the intestine of 1.42 mm (±0.44).
We found high and significant correlation values (ie r> 0.7, p <0.05) between the pairs of variables total weight (Wt): gonads weight (Wg), total length: body weight (Wc), total weight (Wt): body weight (Wc), standard length (Ls): body weight (Wc), standard length (Ls): total weight (Wt), and total length: standard length. The weight of the stomach is not significantly correlated with any of the biometric variables considered.
Diet. Bryconamericus caucanus is a predominantly insectivorous fish. The chosen richness estimators presented expected values between 29.59 and 37.49 food items (Chao I and II respectively), that is, a corresponding representativeness between 64% and 81.4% of the trophic richness (Figure 5).

Figure 5 Accumulation curve of preys regarding the number of sampled B. caucanus at La Venada creek, Quindío River, Alto Cauca, Colombia.
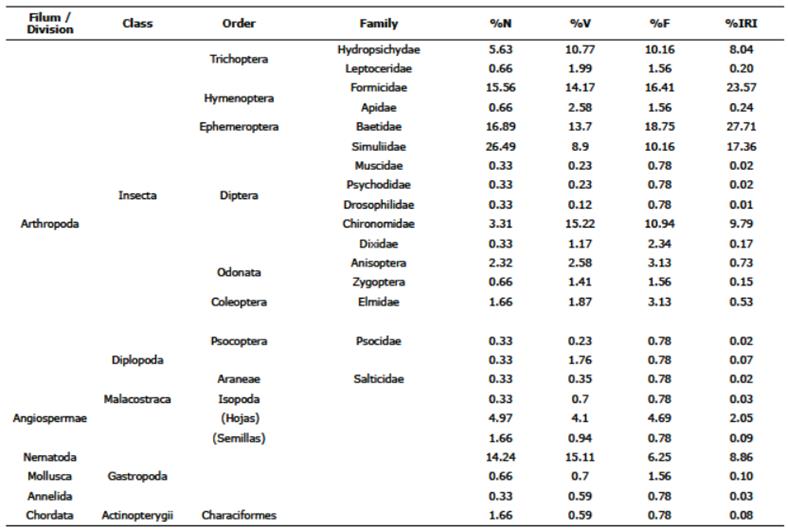
24 food items were found in the diet of B. caucanus (Table 1). Both stones and nematodes are excluded from the analyzes. Among the remaining items, Ephemeroptera (Baetidae: 27.71%), Hymenoptera (Formicidae: 23.57%), Diptera (Simuliidae: 17.36%, Chironomidae: 9.79%) and Trichoptera (Hydropsychidae: 8.04%) presented the highest values of the relative importance index (% IRI). On the other hand, both Ephemeroptera (Baetidae) and Hymenoptera also showed the highest observed frequency (Fo = 18.75%, 16.41% respectively). Diptera (Simuliidae), Ephemeroptera (Baetidae) and Hymenoptera (Formicidae) had the highest relative abundance corresponding to 26.49%, 16.89%, and 15.56% respectively. Diptera (Chironomidae) and Nematoda registered the highest volumetric percentages: 15.22% and 15.11%. Allochthonous items such as arachnids, psocoptera, adult diptera (Drosophilidae and Muscidae), annelids, isopods are considered accidental or circumstantial food because of their low values (0.03% IRI). Characid scales were also found in three of the stomachs reviewed.
Table 1 B. caucanus diet during the sampling seasons. % N = numerical percentage, % V = volumetric percentage,% Fo = percentage of frequency of occurrence,% IRI = food importance index percentage value. Stone items (Fo = 77.1%) are excluded from the analysis because they do not represent nutritional value in the diet of the species. Nematodes are included even though they are common parasites of Characids in the Neotropics
The diet of B. caucanus is mostly represented by baetids (% N = 16.89,% V = 13.7 and% Fo = 18.75) and formicids (% N = 15.56,% V = 14.17 and% Fo=16.41). Both items showed the maximum values in the trophic descriptors considered (i.e. volume, abundance and frequency, Figure 6). The remaining prey were considered rare because they are closer to the origin of the three axes in Figure 6. These prey also have the lowest abundance, volume and frequency values compared to the remaining items. The greatest contribution in the abundance of prey was contributed by baetids. On the contrary, chironomids have a greater volumetric contribution than in abundance. In this sense, their consumption is restricted in terms of volume and not by the amount of individuals ingested.
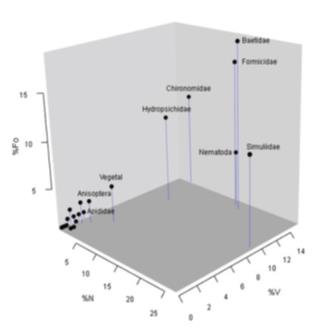
Figure 6 Three-dimensional dispersion diagram for the indices of items consumed by Bryconamericus caucanus at La Venada creek, Quindío River, Alto Cauca, Colombia.
The first three axes of the main component analysis were selected and explained ~76.60% of the variance. Principal component one (CP1) contained 45.88% of the variance, while two (CP2) 22.87% and three (CP3) 7.85%. The first component was found to be dominated on the positive axis by chironomids (Loadings 0.9771). The negative axis of the same presented the lowest eigenvalues for hydropsychids, simulids and plant material (-0.0584, -0.0320 and -0.0238, respectively). The second main component showed dominance for baetids in the positive axis (Loading 0.0.2341), and in the negative axis for formicids and hydropsochids (Loadings -0.7283 and -0.5906).
Males presented a higher numerical consumption of apids, chironomids, simuliids, plant material and anisopters. Females exhibited a more homogeneous trend in the distribution of the volume of prey in the diet, with maximum for hydropsichyds, formicids, diplopods and baetids. The amplitude analysis for trophic niche revealed a greater volumetric exploitation on different items by males (females: 6.99, males: 9.53). The overlapping of trophic niche between sexes was 0.709 according to the Levine index (0.509-0.922 bst). No statistical differences were detected between the groups (PERMANOVA: F = 0.9487, p = 0.453).
When analyzing the diet in relation to the states of maturity (Figure 7), adults exhibit a dispersion associated to CP1. This indicates a higher volumetric consumption of chironomides, baetids and dixids. Immature specimens also consume high Baetid volumes, as well as plant material and baetid. The largest niche amplitude was recorded for mature stages (adults: 8.75, juveniles: 7.41). The trophic overlapp between stages is higher than that registered between sexes (0.85, 0.652-0.991 bst). There are no statistical differences between maturity stages either (PERMANOVA: F = 0.3326, p = 0.956).
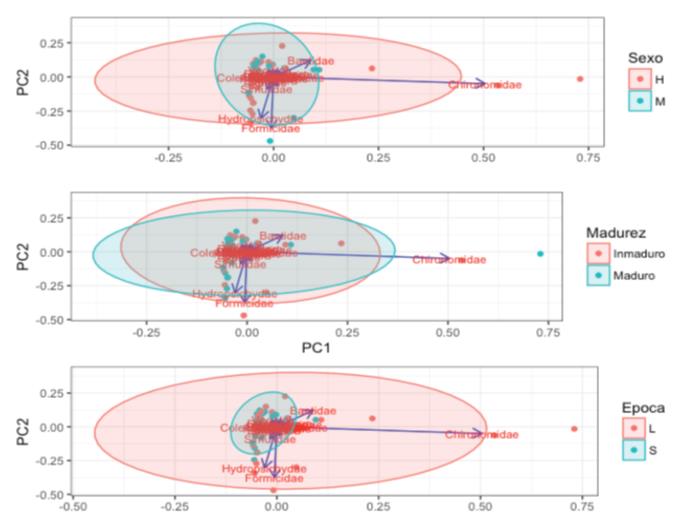
Figure 7 Principal component analysis for the diet of Bryconamericus caucanus in La Venada Creek, Quindío River, Alto Cauca. Three different types of groupings are shown based on sex (above), stage of maturity (medium) and time of collection (below). Stones and scales are excluded from the graph. H: Females, M: Males, L: Rains, S: Drought.
A lower trophic amplitude during the dry season was found compared to all the food items found during the rainy season (Figure 7). These differences are statistically supported (PERMANOVA: F = 2.2998, p = 0.022). During rainy periods, B. caucanus explores new items that become more abundant in the stream (e.g. Formicidae, Hydropsichidae, Chironomidae). The Levins index supports this pattern (drought: 6.75, rains: 10.22) and also suggests the lowest value of overlap between periods in relation to sex and stage of maturity (0.66, 0.4-0.89 bst).
DISCUSSION
This work describes the trophic and reproductive characteristics of Bryconamericus caucanus in the La Venada creek affluent of the Quindío River, Calarcá, Quindío, Colombia. Information on dietary and reproduction aspects for species of the genus Bryconamericus have been previously published by Román-Valencia and Muñoz 14 for B. galvisi, Taphorn 17 for B. cismontanus and B. alpha. There are three previous works focused on describing the diet of B. caucanus12,13,29. However, the incorrect identification of samples of specimens collected and examined by Román-Valencia & Muñoz 12, has implied the erroneous description of the characteristics of natural history for this species 30. The morphological limits between B. caucanus and multiple species of Hemibrycon have therefore confused the diet and reproduction for B. caucanus30. This work is only based on material from B. caucanus and therefore lacks the previously identified issues.
Bryconamericus caucanus is a predominantly insectivorous fish. This species mainly preys on ephemeroptera, trichoptera, larvae of diptera and ants that fall on the water surface. Although there are differential trends in the capture of prey in relation to sex, no statistical support was found for variable. Females however, consume a more restricted trophic spectrum than males. A similar pattern is evident for juveniles and adults. Adult stages consume a greater variety of prey, which is a reflection of both morphological characteristics (e.g. oral diameter), as well as behavioral aspects. On the other hand, seasonality has a notorious impact on the composition of the diet in the species. During periods of high rainfall, B. caucanus has access to resources that are scarce during the drought period. The trophic overlap between climatic periods is therefore, less than between sexes or stages of maturation, which is related to the novel appearance or the accelerated increase (in terms of volume) of specific prey available in the stream. In this sense, the volumetric contribution of prey such as ants and chironomids dominates the difference between weather periods.
The reproductive characteristics of the species are similar to the data previously reported for species of the same genus 12,13,29. The spawning periods established here for B. caucanus coincide in general with those reported for the species in the Upper Cauca. Periods of high reproductive activity occur twice a year during the beginning of the rainy periods (i.e. May-June and September-October). On the other hand, the IGS and K values suggest that during the reproductive period, this species tends to feed more than in other months. It is also evident that there is a greater feeding frequency during the beginning of this phase derived from the similarity between the peaks of the gonadosomatic index (IGS) and the condition factor (K). If reproductive information is related to trophic data, prey with greater volumetric representation during periods of rainfall (e.g. chironomids, ants) contributes significantly to the nutritional gain of individuals 29.


