Introduction
Exercise prescription for older adults is often based on relative intensities of measured variables such as heart rate (HR), oxygen consumption (VO2), a maximal muscle repetition, and cognitive measures such as ratings of perceived exertion (RPE) (American College of Sports Medicine, 2018; Chodzko-Zajko et al., 2009; Zaleski et al., 2016). These parameters are measured during a graded exercise test (GXT) and provide objective and accurate information for practitioners. However, these indicators are usually difficult to measure, require trained staff, medical supervision, and expensive equipment. Therefore, alternative measures such as the rating of perceived exertion (RPE), are recommended as perceptual measures associated to physiological stress.
The RPE might represent a biomarker of fatigability associated with the progressively lower physical activity occurring with aging (Wanigatunga et al., 2018). There are numerical and pictorial RPE scales for children and adults (Chen, Chiou, Tzeng, Lu, & Chen, 2017; Eston, Parfitt, Campbell, & Lamb, 2000; Robertson et al., 2000; Williams, Eston, & Furlong, 1994); however, the first RPE scale developed was Borg’s (Borg, 1970, 1990). This scale was developed assuming a linear association between physiological markers (e.g., HR, blood lactate) and the participant’s effort perception at any given exercise intensity (Borg, 1970).
The validity of Borg’s RPE has been questioned since inconsistencies in the strength of the association were found between this perceptual measure and physiological markers (Chen, Fan, & Moe, 2002). The strength of the association between HR, blood lactate, VO2, maximal attained VO2 (VO2max), highest attained VO2 (VO2peak), respiratory exchange ratio (RER), and other markers measured during exercise ranged between 0.57 and 0.64. These correlation coefficients were lower than the 0.80 to 0.90 reported before; therefore, moderator variables such as previous fitness, type of exercise protocol, population, and others must be taken into consideration when assessing RPE during a GXT (Chen et al., 2002).
Aging is strongly associated to cognitive decline, which is partially explained by cardiovascular health and other associated disease risk factors (Barnes, 2015). One of the most noticeable physiological change during aging is a decrease in VO2max (Wilson & Tanaka, 2000), which declines at a rate of 5% to15% per decade after 25 years of age in sedentary males and females regardless of their ethnic background (Åstrand, Bergh, & Kilbom, 1997; Schiller, Casas, Desouza, & Seals, 2001). The study of cardiovascular function is relevant since a high VO2max is related to a lower reduction in cortical tissue density in the brain (Colcombe et al., 2003) and an increased brain volume (gray and white matter regions) (Colcombe et al., 2006); thus, the brain might become more efficient, plastic and adaptive to exercise training, reducing the normal cognitive decline associated with the aging process (Colcombe et al., 2004; Kramer & Colcombe, 2018).
Aerobic exercise training has been positively related to a delayed cognitive impairment (Fiuza-Luces, Garatachea, Berger, & Lucia, 2013) through positive changes in brain structure and function (Firth et al., 2018; Kennedy, Hardman, Macpherson, Scholey, & Pipingas, 2017). Similar brain responses have been reported for resistance training exercise in older adults with mild cognitive impairment (Tsai, Ukropec, Ukropcová, & Pai, 2018). However, changes in cognition in the aging brain might influence RPE during GXTs, a topic not extensively reported in the literature. Equivocal results have been found in the scarce evidence regarding the association between physiological measures and RPE in adults over 60 years old. For instance, positive correlations were found between HR and RPE during a cycle ergometer GXT in female (Shigematsu, Ueno, Nakagaichi, Nho, & Tanaka, 2004) and male and older female adults (Guidetti et al., 2011). However, no associations were found in an arm training GXT on a sample of older female adult participants (Grange et al., 2004). The evidence also suggests that RPE is trainable (Grange et al., 2004; Groslambert & Mahon, 2006).
Although, others have reported on the association between RPE and physiological responses during cycle ergometry GXT in older adults (Shigematsu et al., 2004). To the best of our knowledge, no study has reported the associations between metabolic, physiological and cognitive variables and RPE during a stage-by-stage treadmill GXT in older adults. Therefore, the purpose of the study was to explain the contribution of metabolic, physiological and cognitive variables on RPE during a GXT in older adults. Two research questions led our work; first, what would be correlation between RPE and physiological variables during submaximal (i.e., stage-by-stage) and maximal effort? Secondly, what would be the RPE predictors during submaximal and maximal GXT? We hypothesized that RPE would be moderate-to-highly related to HR, VO2, RER at both, maximal and submaximal (i.e., stage-by-stage) effort. In addition, we hypothesized that RPE could be predicted by physiological and cognitive variables during submaximal and maximal GXT.
Methods
Participants
Two data sets were analyzed from an ongoing comparative study in older adults from Kansas and Costa Rica. For the maximal effort analysis (study 1), volunteers were 100 older adults who were given a testing appointment at the Alzheimer’s Disease Center at the University of Kansas. For submaximal or stage-by-stage analysis (study 2), volunteers were 79 older adults who were given a testing appointment at the Human Movement Sciences Center at the University of Costa Rica, Costa Rica.
In both testing sites, the respective medical team determined whether volunteers were eligible for the study based on their personal health history, a physical examination and an interview. All participants were screened and allowed to participate if they were at least 60 years old, scored in the unimpaired range on the cognitive status screen, and had visual, auditory, and physical abilities sufficient to complete the cognitive and exercise assessments. For safety precautions, volunteers with severe electrocardiographic, intellectual, metabolic or gait abnormalities were excluded from participating in the study. Participants read and signed a written informed consent previously approved by the Institutional Review Board at the University of Kansas and the Scientific Ethics Committee at the University of Costa Rica.
Instruments
For study 1 and study 2, the same neurocognitive battery was applied through a personal interview, performed by licensed psychologists. The highest education level attained was asked as part of the demographics interview. The neurocognitive battery assessed different cognition domains, including a cognitive screen, simple speed of processing, spatial visualization, visuospatial processing (fluid ability), episodic memory and verbal abilities, executive functioning and cognitive control, and working memory (simple attention) tasks.
The cognitive screen was the Mini-Mental State Examination (MMSE; Folstein, Folstein, & McHugh, 1975). The simple speed of processing was measured with the Stroop test (Stroop, 1935), which was used to assess executive function. The spatial visualization was measured with the Space Relations Test (SRT; Bennet, Seashore, & Wesman, 1972). The visuospatial processing/fluid ability was measured with the Block Design Test (BDT; Wechsler, 1997). The Digit Symbol Substitution Test (DSST; Wechsler, 1997), was used to assess cognitive processing ability. The Trail-making Test (TMT) forms A and B (Armitage, 1946), was used to assess information regarding visual search, scanning, speed of processing, mental flexibility, and set switching as an executive function. The episodic memory and verbal abilities were measured with the Boston Naming Test (BNT; Goodglass & Kaplan, 1983), a measure of visual confrontational word retrieval using black and white line drawings of progressive difficulty. Logical and delayed memory (Wechsler, 1997) were measured by a prose recall of short narrative passages immediately after the auditory presentation the story (reading out loud), and then prose recall of short narrative passages after a 20-min delay of the auditory presentation the story (reading out loud). The executive functioning and cognitive control were measured with the TMT (form B) and the Stroop Test (interference task), were used to assess executive function and cognitive control. In addition, verbal fluency (Goodglass & Kaplan, 1983) was measured by a verbal test which consists of saying as many words as possible from a category in one minute. Finally, the working memory (simple attention) was measured with the Digit Span forwards and backwards (DSF involves reciting back a list of numbers to read to the subject, DSB involves reciting back a list of numbers in reverse order) and the Letter Number Sequencing (LNS) tests was used to assess working memory (Wechsler, 1997).
Anthropometric measures recorded were body height (cm), weight (kg), body fat mass (%) and bone mineral density (BMD) by dual-energy X-ray absorptiometry (DXA), using a Lunar Prodigy Advance equipment (GE Medical Systems, Madison, WI). The measurements were obtained following international standards (American College of Sports Medicine, 2018; International Society for Clinical Densitometry, 2015). Aerobic power as determined by VO2, HR, and RER (VCO2/VO2) were measured during the GXT with metabolic carts (TrueOne 2400, Parvomedics, Sandy, UT, for study 1 and Jaeger CPX, CareFusion Corp., San Diego, CA, for study 2). The RPE was assessed by the 6-20 Borg’s scale (Borg, 1970, 1990) during each stage of the GXT.
Procedures
Participants were recruited by word of mouth and telephone calls in both testing sites. For the neurocognitive assessment, the psychologists received participants in quiet rooms, where they sat quietly and were given the option to drink a beverage and eat a light snack during the length of the testing session, which lasted approximately 90-min, allowing for breaks when needed. The individual cognitive dimensions measured were transformed in z-scores and participant’s mean performance z-scores on each dimension were computed to create a comprehensive index of global neurocognitive performance called cognitive function total score (CFTS). This composite score was used as a predictor for statistical purposes.
Body height was measured to the nearest 0.1 cm using a stadiometer and body mass was measured in kg on a digital platform. For DXA assessment, participant’s scans were performed and analyzed on each testing facility by the same-trained operator (Exercise Science specialist), according to a standard protocol (International Society for Clinical Densitometry, 2015; Lewiecki et al., 2016; Morgan & Prater, 2017). In both testing locations, exercise was performed at room temperature ranging from 22°C to 25°C between 7:00 am to 9:00 am.
The VO2, HR, and RER were measured by a GXT using a modified Cornell treadmill protocol. Exercise science specialists and physicians asked participants to walk at 2.73 km/h at 0% incline and expired gases were collected breath-by-breath on the metabolic cart. The treadmill grade, speed or both increased every 2-min until VO2peak was achieved (Hawkins, Raven, Snell, Stray-Gundersen, & Levine, 2007). At the end of each GXT stage, RPE was asked to participants, and a physician continuously monitored the 12-lead electrocardiogram to measure HR and detect any rhythm abnormalities. Systolic (SBP) and diastolic (DBP) blood pressure were measured at each stage of the GXT, and mean arterial pressure (MAP) was calculated as follows: 0.33 x SBP + 0.66 x DBP.
Statistical analysis
Statistical analysis was performed with the IBM-SPSS Statistics, version 22 (IBM Corporation, Armonk, New York). Descriptive statistics are presented as mean and standard deviation (M ± SD), unless otherwise noted. For all inferential statistical analyses, the level of significance was set a priori at p ≤ 0.05 and 95% confidence intervals around the estimate were computed. For study 1 (i.e., maximal exertion), a non-parametric independent samples Mann-Whitney U test was computed on RPE at maximal exertion. Based on this analysis, Pearson correlations were computed between RPE and HRmax, VO2peak, RER, CFTS, and education level. Stepwise multiple linear regression analysis was computed using RPE as the criterion variable, and HRmax, VO2peak, RER, CFTS, and education level as predictor variables. For study 2 (i.e., stage exertion), non-parametric independent samples Mann-Whitney U tests were computed on each stage of the GXT on the dependent variable RPE. Based on these analyses, Pearson correlations were computed between RPE and physiological variables HR, SBP, DBP, MAP, VO2 and RER by gender at each GXT stage. Finally, stepwise multiple linear regression analyses by gender at each GXT stage were computed using RPE as the criterion variable, and HR, VO2, RER, CFTS and education level as the predictor variables.
Results
Descriptive statistics for older adults from Kansas and Costa Rica are presented in table 1. For study 1, participants were 65 female and 35 male older adults. The median RPE values were similar between males (Mdn = 18, range = 7) and females (Mdn = 17, range = 8) at maximal exertion (p = 0.288); therefore, data from male and females were collapsed for further analyses. A significant correlation was found between RPE and RER (r = 0.22, p = 0.029), and non-significant correlations were found between RPE and HRmax (r = 0.18, p = 0.068), VO2peak (r = 0.18, p = 0.077), CFTS (r = -0.02, p = 0.825), and education level (r = 0.06, p = 0.581). The stepwise multiple linear regression analysis showed that RPE was explained only by RER (Standardized β = 0.21, p = 0.039, CI95% = 0.27, 10.52, SEE = 1.74, R2 = 0.03). Predictors HRmax (p = 0.153), VO2peak (p = 0.211), CFTS (p = 0.774), and education level (p = 0.422) did not explain RPE scores.
Table 1 Descriptive statistics for Kansans and Costa Rican older adults. Values are M ± SD

BMI = Body Mass Index; BMD = Bone Mineral Density; CFTS = Cognitive Function Total Score.
Source: Own elaboration.
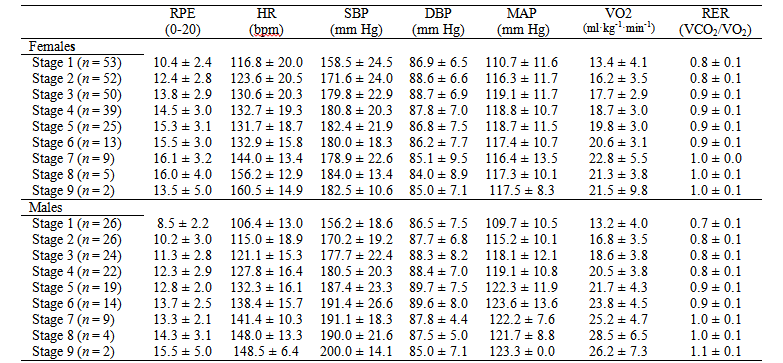
For study 2, participants were 53 female and 26 male older adults (Table 1). Descriptive statistics for physiological and perceptual variables at each GXT stage are presented in table 2.
Table 2 Descriptive statistics (M ± SD) by gender for each GXT stage in Costa Rican older adults

RPE = Rating of Perceived Exertion; HR = Heart rate in beats per minute (bpm); SBP = Systolic Blood Pressure; DBP = Diastolic Blood Pressure; MAP = Mean Arterial Pressure; VO2 = Oxygen Consumption; RER = Respiratory Exchange Ratio.
Source: Own elaboration.
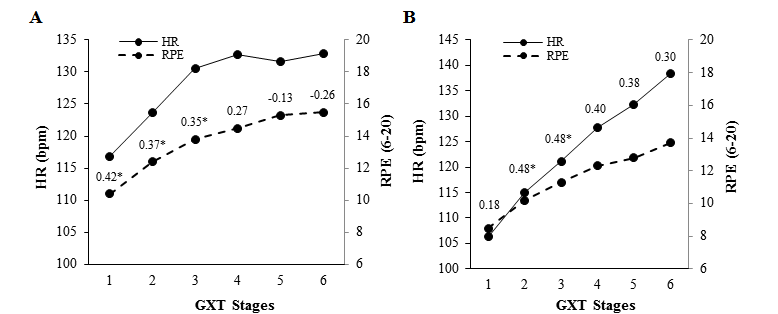
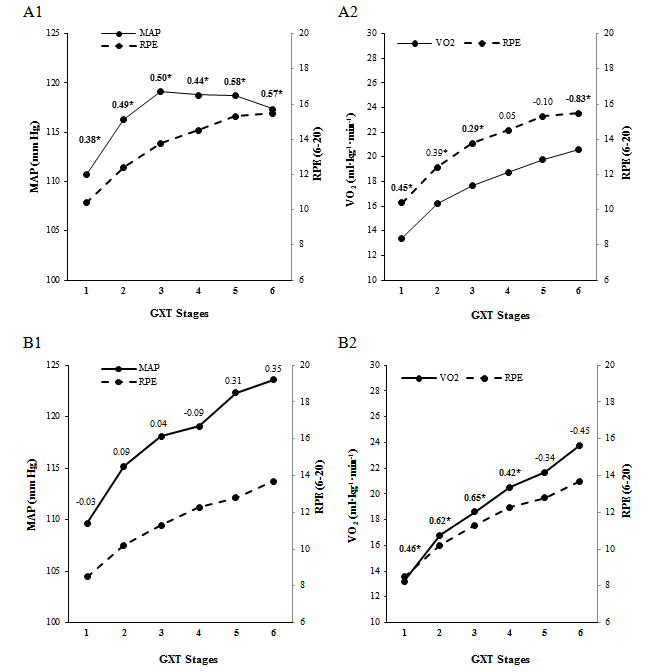
Significant differences were found between male and female older adults on RPE scores on GXT stage 1 (p = 0.006), stage 2 (p = 0.001), stage 3 (p = 0.003), stage 4 (p = 0.008), and stage 5 (p = 0.005). RPE scores were similar between males and females on stage 6 (p = 0.120). No between-gender comparisons were computed on stages 7, 8 and 9 given the small sample size (Table 2). Pearson correlation coefficients between RPE and physiological variables by gender are shown in figures 1 and 2.

Source: Own elaboration.
Figure 1. Pearson correlation coefficients between heart rate (HR) and ratings of perceived exertion (RPE) at each stage of a gradual maximal exercise test (GXT) in Costa Rica female (A) and male (B) older adults. *p ≤ 0.05.

Source: Own elaboration.
Figure 2. Pearson correlation coefficients between mean arterial pressure (MAP), oxygen consumption (VO2) and ratings of perceived exertion (RPE) at each stage of a gradual maximal exercise test (GXT) in Costa Rican female (A1, A2) and male (B1, B2) older adults. *p ≤ 0.05.
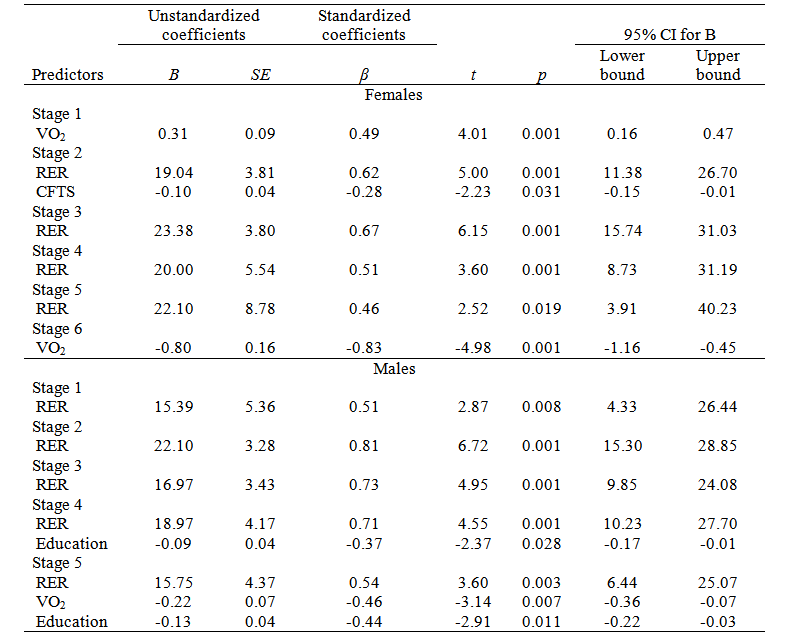
Significant multiple regression predictors of RPE for females were VO2 (R2 = 0.24) for stage 1 and stage 6 (R2 = 0.69), RER (R2 = 0.28) and CFTS (R2 = 0.07) for stage 2, and RER for stages 3 (R2 = 0.45), 4 (R2 = 0.26), and 5 (R2 = 0.22). For males, the significant multiple regression predictors of RPE were RER for stages 1 (R2 = 0.26), 2 (R2 = 0.65), and 3 (R2 = 0.53), RER (R2 = 0.42) and Education level (R2 = 0.13) for stage 4, and RER (R2 = 0.33), VO2 (R2 = 0.18) and Education level (R2 = 0.18) for stage 5 (Table 3).
Table 3 Multiple linear regression coefficients on physiological, metabolic and cognitive predictors of ratings of perceived exertion in Costa Rican female and male older adults

VO2: oxygen consumption; RER: respiratory exchange ratio; CFTS: cognitive function total score; Education: Education level.
Source: Own elaboration.
Discussion
The aims of the study were to determine the association between RPE and physiological and cognitive variables, as well as to identify RPE predictors at submaximal and maximal effort during a treadmill GXT. We analyzed samples of older adults from Kansas for maximal effort (study 1) and Costa Rica for submaximal or stage-by-stage GXT (study 2).
The main finding in the older adult sample from Kansas (study 1) was that RPE at maximal exertion during the GXT was similar between males and females. In addition, only the metabolic variable RER was a significant predictor of the RPE scores. Other physiological (i.e., HRmax, VO2peak) and cognitive (i.e., CFTS, education level) predictors were unrelated to RPE scores at maximal exertion.
The lack of association between RPE and physiological variables is consistent with previous meta-analytic findings (Chen et al., 2002). Several potential moderators might impact the strength of the association between HR and RPE; for instance, fitness level, exercise type, and exercise protocol (Groslambert & Mahon, 2006). According to Chen et al. (2002), a stronger association between HR and RPE has been found on sedentary persons, compared to healthy but inactive, and active and highly fit individuals. However, others have found a lack of association between HR and RPE in sedentary participants (Grange et al., 2004). In addition, higher correlation coefficients between HR and RPE have been also found on swimmers compared to track runners, treadmill exercise, and cycle ergometry participants. Finally, lower correlation coefficients between HR and RPE have been found on random intermittent protocols compared to progressive continuous or intermittent protocols, submaximal and maximal exertion protocols (Chen et al., 2002). In the present study, we assessed mostly sedentary older adults on a treadmill to maximal exertion; therefore, we expected to find a strong correlation between HR and RPE; however, we did not find it at maximal exertion.
The RPE scales are useful since participants learn how to relate physiological and metabolic responses with a felt whole-body perception of effort, decreasing the need for frequent HR measurements (Powers & Howley, 2018). Grange et al. (2004), suggest that sedentary older adults could not perceive their body sensations (e.g., muscular strain, aches and fatigue) properly or that they are less accurate at rating them during intensive exercise such as the maximal GXT used in the present study. However, RPEs are changed following six-weeks of arm training, which might be explained by the older adult’s ability to enhance their muscular sensory cues in the perception of effort (Grange et al., 2004). The changes might have been mediated by increased blood perfusion to the brain and the action of a family of neurotrophins and neurotransmitters associated to brain plasticity and cognitive function (e.g., brain derived neurotrophic factor – BDNF, dopamine, serotonin) (Jimenez-Maldonado, Renteria, Garcia-Suarez, Moncada-Jimenez, & Freire-Royes, 2018).
Others suggest that in older adults the differences in perceptual responses may not be present as long as variations in aerobic power are taken into account (Groslambert & Mahon, 2006). This impaired kinetic perception hypothesis explanation is plausible as supported by a body of correlational studies on the reduced sensory and sensorimotor abilities occurring during normal aging (Li & Lindenberger, 2002; Schneider & Pichora-Fuller, 2000). However, more experimental studies are required to determine the causal effects of aging on perceptual responses using different theoretical approaches such as the information degradation hypothesis (Monge & Madden, 2016) and the teleoanticipation hypothesis (Hampson, St Clair Gibson, Lambert, & Noakes, 2001).
The main finding in the older adult sample from Costa Rica (study 2) was that RPEs were significantly lower in males compared to females during the first five out of six stages of the GXT analyzed. In the last stage, scores between males and females were similar. Only a few older adults completed stages seven, eight, and nine (Table 2); therefore, the data were not analyzed to avoid low statistical power. The analyzed data suggested that males and females perceive exertion differently during submaximal exercise, and the difference is lost at or near-maximal effort. The lower RPE in males might be explained by a sociological concept of machismo in that men, in following stricter roles of traditional masculinity, may be more influenced to prove effortlessness, virility and emotional toughness compared to women (Gibbons & Luna, 2015). There is evidence showing that male athletes have higher mental toughness compared to female athletes (Newland, Newton, Finch, Harbke, & Podlog, 2013; Nicholls, Polman, Levy, & Backhouse, 2009).
Inconsistent low-to-moderate significant correlation coefficients were found between HR and RPE at initial stages of the GXT in males and females (Figure 1). Low- to-moderate significant correlation coefficients were found between MAP and RPE only in female older adults (Figure 2, A1), and between VO2 and RPE in male and female older adults (Figure 2, A2, B2).
In conclusion, in the present study in older adults from Kansas and Costa Rica, we expected a strong correlation between HR and RPE based on literature suggesting such an association (Groslambert & Mahon, 2006). However, we did not find that association at maximal exertion in older adults from Kansas. We found low-to-moderate correlation coefficients between HR and RPE at the initial stages of the GXT in the Costa Rican sample of older adults. In addition, the RPE were different between males and females at or near maximal effort.
Aerobic exercise is strongly recommended to older adults given the positive impact on brain tissue preservation and plasticity (Colcombe et al., 2003; Colcombe et al., 2006; Colcombe et al., 2004; Firth et al., 2018; Kramer & Colcombe, 2018). The RPE is recommended for monitoring aerobic exercise intensity in the absence of objectively measured variables, such as HR (Groslambert & Mahon, 2006). However, in the older adults in this study, RPE was inconsistently related to HR, yet, consistently related to the metabolic parameter RER, which can only be measured by expensive laboratory equipment. Therefore, the validity of the RPE may not be as high in older adults as it might be for other populations, and its widespread use should be carefully evaluated.
The respiratory rate (breaths×min-1), a highly correlated variable to RER, could be the best indicator of physical intensity or exertion since meta-analytic evidence has shown coefficients above 0.70 when correlated to RPE (Chen et al., 2002). Respiratory rate might be used for tracking exercise intensity and exertion since breaths are easy to count (Chen et al., 2002), and are closely related to RER. Hyperventilation or increased respiratory rate occurs when hydrogen ions are elevated due to a progressive exertion, which is explained by excessive CO2 loss from the body’s CO2 stores. Since RER is defined as the ratio of CO2 produced to the O2 consumed (VCO2/VO2; Powers & Howley, 2018), then respiratory rate should be considered a valid and reliable estimator of exercise intensity and exertion in older adults regardless of their fitness status. Thus, new scales for monitoring different exercise modalities (i.e., aerobic, anaerobic) need to be developed to properly control the training progression and safety in older adults (e.g., Colado et al., 2018).


