


 English (pdf)
 Article in xml format
 Article references
 Send this article by e-mail
 Cited by SciELO
  Cited by Google
  Similars in
SciELO
Similars in
SciELO  Similars in Google
 Permalink
Introduction
Landslides are a major geological hazard due to their long runout distance, high mobility, and entrainment effect (Evans et al.,2007; Zhang M& McSaveney,2017; Yin et al.,2009). In recent studies, due to the tremendous economy losses and casualties every year, catastrophic landslides have been addressed as environmental disasters (Gao et al., 2020; Warrick et al., 2019; Igwe O, 2018; Zhang et al., 2016). This research work has primarily concentrated on the following aspects (Fan et al., 2018; Hu et al., 2018; Wang et al., 2018; Zhao et al., 2018): First, potential landslide identification plays an important role in disaster prevention. Methods for landslide identification include field surveys, aerial investigations (such as interferometric synthetic aperture radar, unmanned aerial vehicle, and light detection and Ranging), acoustic emissions, and micro-seismicity. These methods have been used to analyze the deformation process of potential landslides. Furthermore, landslide susceptibility mapping (LSM) has been used to predict potential landslides, such as in the alternating decision tree-adaptive boosting model and the recurrent neural network model. These new technologies could offer the necessary information (coordination and volume) (Wang et al., 2020; Wu et al., 2020; Wang et al., 2019; Althuwaynee et al., 2014). In addition, a considerable amount of indoor testing of landslide mechanisms has been performed (Wang et al., 2018; Huang et al., 2019).
Currently, the analyses and prediction of landslide hazards are based on indoor tests, field geological survey methods, and LSM (Huang et al., 2009; Wang et al., 2019). These tests and methods are essential for identifying and preventing landslides, and for providing security for emergency rescue and disaster relief (Fan et al., 2018; Wang et al., 2018). However, these methods cannot precisely calculate the hazardous effects of catastrophic landslide dynamics or conduct risk assessments such as the run-out distance, impact force, and entrainment that are basis for the design of remedial engineering measures. Additionally, numerical simulation methods provide more disaster information because they are able to compute landslide motion parameters, such as flow speed, deposit thickness, and the danger zone. The numerical methods primarily include discrete element methods and the continuum method (McDougall, 2017). The discrete element methods simulate a sliding mass as a muster of particles. According to Newton's second law, the interaction force among granules can be computed. This is appropriate for debris flow, such as the particle flow code (Itasca, 2008) and MatDEM (Liu & Pollard, 2013). The continuum method is mainly based on the mass and momentum equations that incorporate the earth pressure theory and simulate the dynamic features of a sliding body (Pudasaini & Hutter, 2003; Hungr, 2004). The continuum methods have been successfully applied in the simulation of geological hazards, such as landslides, avalanches, and debris flows (Jeong et al., 2018; Liu et al., 2014). The continuum methods have evolved into different models, such as D-Claw (Iverson & George, 2014), Sassa-Wang (Wang & Sassa, 2002), and DAN (Hungr & Evans, 1996). Based on the motion equation and fluid continuity equations, Hungr established the Dynamic Analysis software of Landslides (DAN-W) along with different rheological models, such as the frictional model, the plastic model, the Bingham model, and the Voellmy model. In addition, a sliding body is regarded as an equivalent fluid for analysis in DAN-W. In this research, a numerical dynamic simulation analysis of the 2017 Xinmo landslide in Maoxian, Sichuan, China was conducted. It was characterized by its rapid velocity and long runout distance. According to field survey data, DAN-W was used to simulate the entire landslide process. In previous work, a comparison of the motion features of several similar long runout and highspeed landslides in the western areas of China was conducted. These studies examined the dynamics of the Sanxicun landslide (Yin et al., 2016), the Panjin landslide (Yang et al.,2019) and the Wenjiagou landslide (Xing et al., 2017). In this study, it was shown that the frictional model was capable of a more accurate inverse analysis of the entire landslide process. The parameters and the numerical model scheme of this research can help precisely compute the motion features of similar potential landslides.
Methods
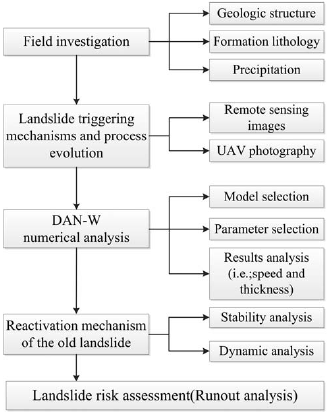
We conducted field geological surveying in the Songpinggou area before and after the landslide hazard, and analyzed the geological conditions of the Xinmo landslide, including the geologic structure, formation lithology, and precipitation. We also used the multi-temporal remote sensing images before the hazard from the IKNOS sensor (resolution = 1.0 m), as well as the GF-2 sensor (resolution = 0.8 m). We use these images to find the key structures and the pre-sliding geomorphology before the landslide. According to the field geological survey data, unmanned aerial vehicle(UAV) photograph, and the multi-temporal remote sensing images, the landslide area was divided into a landslide source zone, a debris avalanche zone, and an accumulation zone. In addition, DAN-W, a landslide dynamic model, and multiple groups of rheological models were used to simulate the entire movement process of the Xinmo landslide and to analyze its dynamic characteristics (i.e., movement velocity, movement distance, and thickness of the accumulation body). The reactivation mechanism and the disaster effects of the old landslide in the 1933 Diexi earthquake were also analyzed. Finally, it was determined that DAN-W and the frictional-frictional-frictional (FFF) model could effectively provide a reference for similar studies regarding the dynamic disaster effects of catastrophic rock landslides. The flowchart of this study can be described as shown in Figure 1.
The Xinmo landslide
A catastrophic landslide hit Diexi Township, Mao County, Sichuan Province, at 05:38:58 on June 24, 2017. Located at the left bank of the firstgrade tributary of the Minjiang River, Songpinggou, the Xinmo landslide lay at E103°39' 03.4", N32°04' 09.4", approximately 44.75 km from Mao County (Figure 2). The elevations of the landslide at the back and front edges were 3450 m and 2250 m, respectively. The elevation difference was 1200 m, the horizontal distance was 2800 m, and the volume of the accumulation body was 1640 χ 104 m3. Xinmo Village was directly destroyed by the landslide, leading to 83 deaths. This landslide, which featured good concealment, a high altitude of initiation, and a huge impact, led to serious casualties and property losses.

Geologic conditions
The Xinmo landslide was located in Longmenshan tectonic zone, which belongs to active area of tectonic movement (Chen et al., 2015; Jiang et al., 2002; Wang et al., 2000; Tang et al., 1991). The Fugui mountain where the Xinmo landslide was located was an earthquake-induced shattered mountain that formed in the epicenter zone of the 1933 Ms7.5 Diexi earthquake (with an intensity level of X) and the strong motion zone of the Ms 8.0 Wenchuan earthquake (with an intensity level ofIX) (Figure 3). In terms of regional geology, this area has undergone S-N compressional tectonic stress several times (Yin et al.,2017). The mountain slope behind Xinmo Village is in a dip slope, where the emergence strata consist of blocky, moderately thick and thin to moderately thick metamorphic quartz sandstone with phyllite and slate of the Middle Triassic Zagunao Formation (T2z), the occurrence of which is 184° Δ 53°. The strata show an undulating deformation because of compression. The steep-dip structural planes, such as phyllite and slate, constitute a weak sliding zone. According to a field geological survey and the remote sensing image analysis (Figure 4), there were two major preferred structural planes in the mountains of the sliding source area: (1) 100° Δ 70° and (2) 350° Δ 40°. The two sets of structural planes cut the rock into a grid on the plane and combined it with the weak structural plane of the bedding layer to separate the rock into a medium-thick layer and a thick layer of massive cataclastic rock. This caused the formation of readily sliding geological blocks.

Figure 3 Regional seismic intensity map of the Xinmo landslide.1 The location of the Xinmo landslide, 2 City, 3 Province, 4 Provincial boundaries, 5 Intensity contour of the Diexi Ms 7.5 earthquake in 1933, 6 Intensity contour of the Wenchuan Ms 8.0 earthquake in 2008.
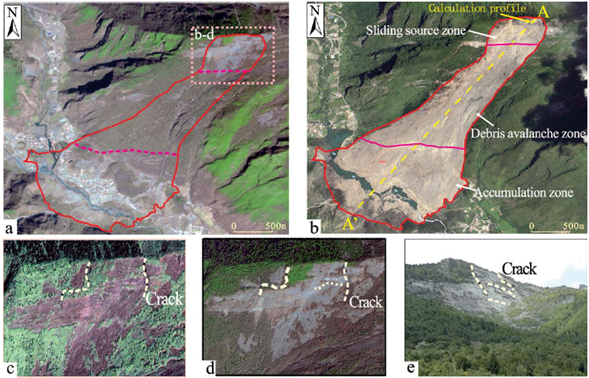
Figure 4 Characteristic zoning and comparison of the multi-temporal remote sensing images of the Xinmo landslide(Yin et al.,2017,modified). a Overview zoning before sliding; b Overview zoning after sliding; c-d Remote sensing images before sliding, c-July, 2005 (IKNOS, R=1.0 m), d--- April, 2017 (GF-2, R=0.8 m). e The photography before sliding(2017-06-22,to the northeast).
According to the rainfall data provided by the Meteorological Bureau of Mao County (2011-2016), the multi-year average precipitation is 490.7 mm (Figure 5) and the maximum daily precipitation is 75.2 mm. Rainfall is concentrated from May to September when the cumulative precipitation can reach 353.3 mm or 72% of the annual precipitation. In 2017, data collected from meteorological stations at Songpinggou and Diexi Township near the landslide showed that the cumulative precipitations from May 1 to June 23 exceeded 210 mm. The rain infiltrated along the mountain rocks and thus led to an increase in the hydrostatic pressure, which intensified the landslide failure.

Zoning characteristics of typical chain disasters
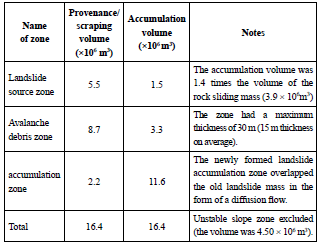
According to the movement and accumulation characteristics of the slide body, the landslide area was divided into a landslide source zone, a debris avalanche zone, and an accumulation zone (Figures 4 and 6, Table 1). An analysis of the remote sensing images before and after the landslide and a field survey indicated that the total area of these zones was 143.1 χ 104 m2. The area's longitudinal length, horizontal distance, elevation difference, maximum width in the front edge, and minimum width in the rear edge were approximately 3000 m, 2800 m, 1170 m, 1500 m, and 300 m, respectively.

Figure 6 Engineering geological section of the Xinmo landslide before and after sliding (Yin et al., 2017, modified). (a) Longitudinal profile before sliding, (b) Longitudinal profile after sliding. 1 Stratum of Triassic Zagunao, 2 accumulation area of the old landslide, 3 residual sliding mass of the old landslide, 4 accumulation area of the new landslide, 5 debris flow accumulation area, 6 sandwiched phyllite or schist, and 7 typical point.
Landslide source zone
Figure 7 shows the landslide source zone for the Xinmo landslide. Based on the field geological survey, the plane shape of the slip source region was approximately "rectangular". The landslide source zone had a dip length of approximately 400 m. The zone had a maximum thickness of 40 m (20 m thickness, on average), a width of 320 m, and a size of 320*104 m3. However, the rock mass in the landslide source zone could have increased up to 1.4 times its original volume when it cracked and broke up (Yin et al., 2010). The mother rock strata were composed of blocky thick quartz sandstone, slate, and phyllite of the Middle Triassic Zagunao Formation. The elevation of the landslide source zone at the rear edge was 3450 m, the toe of the landslide source zone was about 3100 m, and horizontal distance of the landslide source zone was 350 m. The landslide source zone contained a group of nearly NNE-SSW large joints or fracture zones that shared the same direction as the sliding direction, which provided the bulging deformation and the sliding of the rock mass with dominant surfaces of weakness.
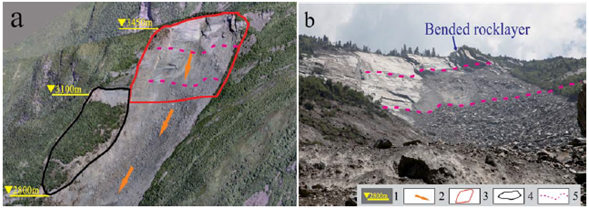
Figure 7 Characteristic of the sliding source zone of the Xinmo landslide at the ridge-top. 1 Elevation, 2 slip direction, 3 boundary of the sliding source zone, 4 the unstable slop zone, and 5 reverse fractured belt.
In addition, a deformation body lay on the west of the source area, with a volume of approximately 450 χ 104 m3 (Figure 7a). It was composed of bedding rock mass and an old residual slope accumulation, and it slid downward for 40 m. The inner part of the deformed body was broken, and its front and east sides were free faces. There was a small collapse that occurred in the front boundary of the deformed body.
Debris avalanche zone
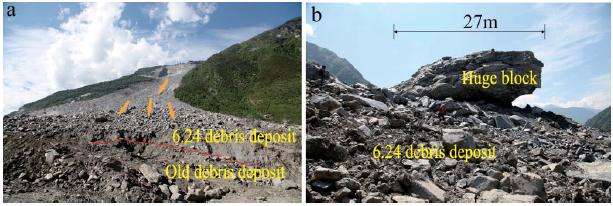
Figure 8 shows the debris avalanche zone of the Xinmo landslide. According to a field survey, the original deposits on the slope were the residual accumulation body of an old landslide that was triggered by the Ms7.5 Diexi earthquake that took place in 1933, and the clastic debris cone was formed by the action of gravity from the top (Cheng et al., 2008). This zone formed along the gully, and it was a pipeline-type debris avalanche for which the slope angle was 27°. The highest elevation of the debris avalanche zone was 3450 m, the toe of the debris avalanche zone was about 2400 m, and horizontal distance of the landslide source zone was 750 m. The zone had a maximum thickness of 30 m (15 m thickness, on average). The exposure of bedrock at a height between 2700 m and 2750 m divided the accumulation body into upper and lower sections, for which the upper section was about 540 χ 104 m3 in size. The lower section was about 330 χ 104 m3 in size. In total, the volume of this accumulation body was 870 χ 104 m3.
Accumulation zone
According to the remote sensing image analysis and a field survey (Figure 8), the accumulation zone had a dip length of approximately 900 m, a width of 350 m, a maximum thickness of 50 m (20 m thickness on average), and a size of 580*104 m2 in size. The accumulation area was located at an elevation between 2440-2290 m. The accumulation zone fanned out and primarily accumulated on the left bank of Songpinggou. It washed up on the right bank, where a landslide dam formed that had a gentle slope. The rock strata in the accumulation zone were composed of blocky thick quartz sandstone and slate. Rock blocks in the accumulation zone were even in lumpiness and were generally cuboids whose side lengths were 0.5-1.5 m. The newly formed landslide accumulation zone overlapped the old landslide mass in the form of a diffusion flow. The old landslide mass was estimated to have an 80 m average thickness and a size of200*104 m3. As a result, the total volume of the accumulated body in this zone was the volume of the avalanche debris body and that of the old landslide mass, for a total volume of 780 *104 m3.
The initiation mechanism and post-failure behavior of the landslide
The catastrophic landslide was analyzed by combining the geological conditions and the different zone characteristics as follows:
There were multiple groups of discontinuous structural surfaces at the rear edge of the Xinmo landslide, which cut the thick blocky rock mass into cataclastic rock blocks and formed a visible fracturing bulging zone at an elevation of 3150-3450 m. Rainwater infiltrated the rock mass through the visible fracture cracks. The medium weathered quartz sandstone belonged to the Middle Triassic Zagunao Formation (T2z). This kind of rock is susceptible to strength reduction induced by rainwater infiltration. In particular, there were two groups of anti-dip joint zones that led to a ridge-top cutout. A sliding surface could then be easily formed. The rock was more broken, and the mountain surface of the sliding source area was much looser under the action of the Wenchun earthquake. Under the action of the gravity on the cataclastic rock mass, some collapses appeared in the sliding source prior to the landslide. The impact loading of the landslide mass resulted in the activation of an accumulation body. In this case, the accumulation body that formed after 1933 became unstable and changed into a pipeline-type debris avalanche after it broke up. When the avalanche debris slid downward toward the old landslide accumulation body at high speed, diffuse avalanche debris accumulation was formed due to the open terrain and the gentle slope in the front. A direct hit by the avalanche debris in the middle pushed the old landslide accumulation body to the top, buried Xinmo Village, caused 83 deaths, pushed dilapidated houses forward 200 m to the southern bank of Songpinggou, and formed a landslide dam. A dispersed accumulation, together with the air blast impact, was formed by the avalanche debris on the eastern and western sides. Shrubs at the front edge were flattened outward.
The Xinmo landslide was activated at the top of Mount Fugui, 3450 m above sea level. The landslide slid for 2.8 km, reached 1637 * 104 m3, and formed a landslide dam after it blocked Songpinggou. It was a typical chain disaster of avalanche debris triggered by a ridge-top landslide, which was similar to the Sanxi Landslide in Dujiangyan, Sichuan Province (Yin et al., 2016) and the catastrophic landslide in Southern Leyte, the Philippines (Catane et al., 2007).
DAN-W numerical simulation analysis
DAN-W, a model used to study landslide dynamics developed by Hungr (1995), can be used to simulate an entire landslide movement process. In this study, the 3D numerical DAN-W model was developed based on the two-dimensional conditions shown in the A-A' profile in Figure 6. The sliding path widths were confirmed according to field survey data (Figure 9). Following the theory of the Lagrangian analytical solution of the Saint-Venant equation, a sliding mass is considered to be an "equivalent fluid," and it is divided into several blocks made up of certain materials. The equilibrium equation and physical equation of each block are built in the curvilinear coordinate system with their solutions to obtain the movement characteristics of a landslide, such as the movement velocity and the sliding distance (Hungr et al., 2004). This is shown in Equations (1) - (6):


Figure 9 The 3D numerical DAN-W model employed for the landslide along the two- dimensional sliding pathway illustrated by section A-A' in Figure.6
where F is the sliding force, γ is the unit weight of the sliding mass, H represents each block height, B represents each block width, ds is the nominal length of each block, α is the slope angle, P is the internal tangential stress, T is the base resisting force, and i represents each block index:

where V is the new velocity of the sliding mass movement. The new speed at the end of a time step is gained from v¡, that is, the old velocity, g is the gravitational acceleration, At represents each time step, M is the momentum flux, and the other parameters are consistent with Equation (1):
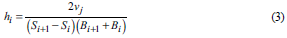
where h is the average thickness of the sliding mass, j represents each block boundary index, i represents each block index, S is the value of the curve displacement, and the other parameters are consistent with Equation (1):
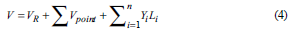
where V is the entire volume of the rock landslide deposit, V R is the volume of the initial rock landslide, V point is the volume of the unstable mass, Y is the yield rate, L represents the length of each block, and i represents each block index:

In the expression, D represents the erosion depth. The other parameters are consistent with Equations 1-4. D depends primarily on the thickness of the loose layer in a sliding path. In this work, previous digital elevation and post digital elevation models were established by superimposing a 1:2000-scale pre-event topographic map onto a post-event unmanned aerial vehicle mage map (Figure 10). The post-event source depths were subtracted from the previous DEM to assess the thickness of the sliding rock mass that was scraped during runout. The initial volume of the Xinmo landslide was estimated to be approximately 500 * 104 m3, the thickness of soils was approximately 25- 120 m, and the maximum erosion depth was approximately 6 m.

Dynamic model description
The velocity of the sliding mass and the height of the landslide accumulation mass were calculated using Equations (1)-(5). In addition, the amount of resisting force that was encountered was determined using different types of rheological models. DAN-W provides different rheology relationship models, which, in most cases of landslide movement analysis, are the frictional model and the Voellmy model (Hungr & McDougall, 2009). The former is primarily used for landslides when there is no turbulence, and the particle sizes of the residual body are large. The latter is suitable for the simulation of landslides with fractured particles where there is a visible liquidized layer in the sliding mass (Aaron et al., 2017).
In the frictional model, it is assumed that the flow of a sliding mass is subject to effective normal stress acting on each block. Its resistance, τ, is denoted as follows:

where γ μ is the pore pressure coefficient, that is, the ratio of the pore pressure to the total pressure, φ is the internal friction angle, σ is the total stress perpendicular to the direction of the sliding path, and τ is the resistance at the bottom of the sliding mass.
The shear stress of the Voellmy model can be expressed as follows:

where f is the friction coefficient of the sliding mass, γ is the unit weight of the materials, ν is the migration velocity of the sliding mass, ξ is the turbulence coefficient, and τ is the resistance at the bottom of the sliding mass.
Model selection and input parameters
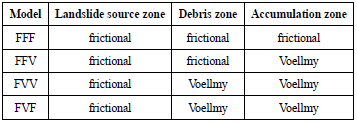
The movement track of a sliding mass, the appropriate rheology relationships, and the material parameters are three key factors that influence a numerical simulation of a landslide. First, the pre-landslide form line, the post-landslide form line, and the movement track of the sliding mass (Figure 4b) were determined based on a field geological survey and data acquired by UAV (unmanned aerial vehicle) photography. The rheological model that was best suited to the field geological conditions was selected from different models based on the characteristics of the Xinmo landslide during various movement stages. It was appropriate to use the frictional model because the particle size of the residual body in the landslide source zone was large, there were noticeable marks of friction on the sliding surface, and the sliding velocity was low in the landslide source zone. The frictional (F) and Voellmy (V) models were applied to the avalanche debris zone and the accumulation zone. According to the range of the avalanche debris, the simulation through three regions (the landslide source zone, the debris avalanche zone, and the accumulation zone) followed the frictional-frictional-frictional(FFF), frictional-Voellmy-Voellmy(FVV), frictional-frictional-Voellmy(FFV), and frictional-Voellmy-frictional(FVF) models, respectively, as shown in Table 2. The numerical results that were obtained for different model combination were compared to the runout distance of the actual event. From these results, we could conclude that the FFF model was the more practical model (see the "Rheology model comparison" section).
The result of the landslide dynamic analysis greatly depended on specialized knowledge of the authors and the data used (Hungr & McDougall, 2009). As a result, a trial-and-error method was used to perform considerable numerical calculations while following the findings of Hungr and other researchers (Hungr & McDougall, 2009; Sosio et al., 2008; Xing et al., 2015) to probe the dynamic characteristics of the Xinmo landslide. According to the results of previous research (Hungr & Evans, 1996; McDougall & Hungr, 2004), suitable values for the rheological model parameters were primarily found through trial and error. In the frictional model, the excess pore water pressure rose due to rainfall infiltration (Musso, 2004; Federico & Cesali, 2017), and the γ μ value was set to 0.6 through trial and error (with values ranging from 0.5 to 0.8). The dynamic friction angle ib =17° (with values ranging from 10° to 30°) according to the literature (Xing et al., 2015). Subsequently, for the Voellmy model, the friction coefficient f=0.3 (tan 24°) and the turbulence coefficient ξ = 450 m/s2 (equivalent in the range of 200-500 m/s2) were investigated. The erosion depth was set to 6 m, which was approximately the maximum erosion depth in the debris avalanche zone based on the field geological survey data. The longitudinal stress in the sliding mass was influenced by the internal friction angle, Finally, using the engineering analogy method, the typical strength testing index was <p i =21° and the density was γ =20 KN/m3. The primary choices for values were due to previous experience and due to trial and error. In addition, individual values were chosen, which appropriately utilized the actual motion characteristics of the Xinmo landslide based on the field geological survey data. As shown in Table 3, the parameters and models were chosen based on the trial and error method and chosen in order to achieve simulations that mimicked the movement characteristics of the landslide.

Results analysis
Analysis of movement velocity
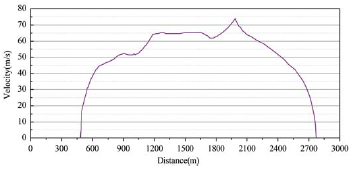
The movement velocity of the sliding mass was analyzed according to the results calculated by the FFF model in DAN-W. If the activation speed of the landslide in the source zone was zero, the movement velocity of the sliding mass showed an undulating increase at a horizontal distance of500-2000 m (Figure 11). The movement velocity of the sliding mass increased sharply upon the activation of the landslide, but the rate decelerated and even declined under the effect of friction against the sliding surface. However, the movement velocity of the sliding mass soared at horizontal distances of 1200 m and 1800 m, for which the friction decreased sharply and the slope steepened due to bedrock exposure. When the sliding mass reached a horizontal distance of 2000 m, the movement velocity peaked at 74 m/s, while the sliding mass provided continuous loading on the old landslide accumulation and pushed its upper portion to move. The sliding mass decelerated on the open terrain, but it still moved at 49 m/s when it destroyed and buried Xinmo Village at a horizontal distance of 2400 m. The sliding mass did not stop until it rushed to a horizontal distance of 2780 m.
Movement distance and thickness of the accumulation body
As shown in Figure 12, the numerical simulation of the Xinmo landslide was performed using the FFF model. Subject to the fracturing bulging effect, the shear displacement of the landslide occurred at a horizontal distance of 400 m. In 34.5 seconds, the front edge of the landslide reached a horizontal distance of 1900 m, which was on top of the old landslide accumulation. The front edge of the landslide continued to move forward, scattered, and accumulated along the way when the terrain was open with a gentler slope, which lasted for 85.5 seconds. It finally stopped moving at a horizontal distance of2780 m.

The shear displacement of a rock mass with a size of 550 χ 104 m3 was triggered with the action of the fracturing bulging effect in the landslide source zone (Figure 12a). It reached a horizontal distance of 600 m and rushed to the upper part of the accumulation body on the slope in 9.7 seconds (Figure 12b), scraping the slope surface at a depth of 2 m (the red line in Figure12). When the sliding mass moved to the tail end of the upper part of the accumulation body on the slope at 17.2 seconds (Figure 12c), the total volume of the landslide reached 1010.4 χ 104 m3. The sliding mass entered the lower part of the accumulation body at 20.22 seconds after it moved horizontally for 1000 m (Figure 16d) and continued to scrape the slope surface at a depth of 3-5 m. The sliding mass increased to 1390 χ 104 m3 when it reached a horizontal distance of 1800 m (Figure 12e). When it moved 100 m forward horizontally to 1900 m at 30.54 seconds, the sliding mass started loading on the upper part of the old landslide slope and pushed it, moving it along. After the sliding mass moved to a horizontal distance of 2400 m at 42.61 seconds (Figure12f), Xinmo Village was buried by the sliding mass, with some of the houses pushed forward 100200 m. Then the sliding mass moved forward and finally stopped at 2780 m at 60 seconds after the landslide took place. The sliding mass in the avalanche debris zone and the accumulation zone continued to scatter and accumulate at 60-120 seconds. The total volume of the landslide reached 1579.6 χ 104 m3 at 120 seconds. In the end, the average thickness of the accumulation body was 20 m and the volume of the residual body reached 309.0 χ 104 m3 in the landslide source zone, as shown by Figure 12h. The average thickness and the volume of the landslide-avalanche debris accumulation zone were 18 m and 1270.2 χ 104 m3, respectively. The total volume of the landslide was 1579.2 χ 104 m3, whereas the total volume of the landslide shown by the field survey and the UAV aerial photography was 1637.6 χ 104 m3. The failure to fully reflect the complex topography in DAN-W led to a deviation between the calculated result and the field geological survey, but the error was still acceptable.
Speed and characteristic analysis of typical points
Based on the actual situation as assessed during the field investigation, four points with horizontal distances X of 400 m, 1000 m, 1900 m, and 2400 m were selected as typical points for the analysis, as shown in Figure 6.
(1) The point with a horizontal distance X = 400 m was located at the landslide shear outlet (Figure 6). During the period from 0 to 10 seconds, the speed of this point increased abruptly, reaching 22.5 m/s at 10 seconds. This indicated that the landslide was initiated with an accelerated shear in a very short period of time (Figure 13a). From 10 seconds to 120 seconds, the speed of this point decreased, and the rate of decrease became larger. This was because the residual sliding body was hindered by the negative topography. In the final steady state, the deposit could become 15 m thick (Figure 13b).
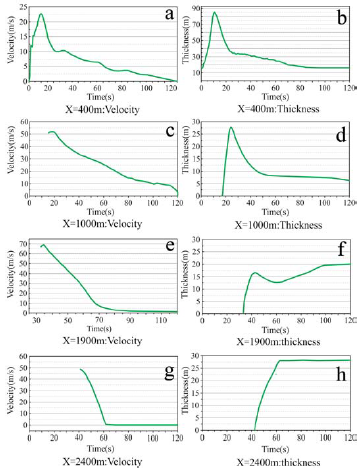
(2) The point with a horizontal distance X = 1000 m was located at the end of the upper portion of the old landslide (Figure 6). The point began at 17.2 seconds (Figure 13c). Because the bedrock at this point was exposed, the sliding body was less hindered, leading to a speed as great as 52.5 m/s. From 20 seconds to 120 seconds, the speed gradually decreased. At 25 seconds, the deposit thickness at this point could be as great as 27.5 m. In the final steady state, the thickness of the deposit at this point could reach 6.5 m (Figure 13d).
(3) The point with a horizontal distance X = 1900 m was located at the end of the lower portion of the old landslide (Figure 6). From this point, the terrain became wider and the slope became gentler, resulting in a maximum speed of 69 m/s at this point, and the speed remained high with very slow attenuation (Figure 13e). The deposit thickness at this point reached 16 m from 34 seconds to 42 seconds and reached 20 m in the final steady state (Figure 13f).
(4) The point with a horizontal distance X = 2400 m was located in the Xinmo Village (Figure 6). At approximately 40 seconds, the front edge of the sliding body reached the Xinmo Village with a speed close to 50 m/s (Figure 13g). At the same time, due to the blockage by houses, the deposit thickness reached 27.5 m in 10 seconds (Figure 13h), which was sufficient to cover seven-story houses, causing devastating damage to Xinmo Village.
Discussion
Rheology model comparison
The diagram of the Xinmo landslide speed variation with slippage obtained using different rheological models is shown in Figure 14. The diagram of the Xinmo landslide speed variation with slippage that was obtained using different rheological models is shown in Figure 14. It can be seen that the runout distances of the FFV model and of the FVV model were relatively large. The sliding distances of the landslide that were calculated using both models exceeded 3 km, which disagreed with the measurement data. The FFF model and FVF model results were more accurate. When estimating the sliding distance and the movement velocity of a landslide that was in the range of millions or even tens of millions of cubic meters in size, the average speed calculated using the sled model of the Xinmo landslide reached 68 m/s (Yin et al., 2017). The calculation of the sled model was similar to that of the FFF model, whereas the movement liquidation effect of the sliding mass in the avalanche debris zone was considered in the FVF model, which resulted in a smaller result. The collision and friction marks between the blocks in the debris flow area that were found in the field geological survey were obvious, and the blocks displayed the state of the fragments. In addition, according to the reports of local residents, there was a gully in the debris flow area with a depth of approximately 1 m. The water in the gully dried up two years before the landslide occurred. There was no loose liquefaction layer on the surface of the debris flow region based on the field survey. Therefore, the frictional model was more of a good fit than the Voellmy model for the avalanche debris zone. What is more, the Voellmy model included a turbulence term to account for velocity-dependent resistance (Eq. 7). The Voellmy model limited flow velocity. In contrast, many studies have shown that the Xinmo landslide was a high-speed and long-runout landslide. As indicated by the result (Figure 15), the FFF model was used to simulate the entire movement process of the Xinmo landslide.


Figure 15 Maximum extent of the Xinmo slope runout for different rheological models in DAN-W . 1 Calculation profile in DAN-W. 2 The runout distance for different models, in m. 4 The actual maximum runout distance, in m. 4 The boundary of the Xinmo landslide.
Numerous studies have been conducted on the Xinmo landslide. Xu and Ouyang analyzed the dynamic disaster effects of the Xinmo landslide using a number of numerical simulation software programs and the corresponding models. These included PFC software and the linear elastic rheology model, MatDEM software and the linear elastic rheology model, MassMov2D software and the Voellmy rheological model, and Massflow software and the Coulomb frictional model. The movement speed and deposit thickness of the Xinmo landslide were calculated. The results showed that the landslide movement speeds that were calculated using Massflow and MassMov2D were relatively slow, under 50 m/s, and the landslide movement speeds that were calculated using PFC and MatDEM were in the range of 35-70 m/s (Scaringi et al., 2017; Ouyang et al., 2017; Xu et al.,2017). Chen et al. used DDA software to simulate the dynamic disaster effect of the Xinmo landslide and they analyzed the speed of the landslide movement to Xinmo Village (Chen et al., 2018). Unlike these earlier studies, this study was based on the features of the frictional model and the Voellmy model, and the different disaster characteristics ofthe sliding source area, the debris flow area, and the deposit area were considered. Appropriate models were selected for different locations along the landslide path. The FFF model was found to be accurate at representing the dynamic disaster characteristics of the Xinmo landslide. The results also showed that the FFV and FVV models led to calculation results, which indicated that the liquefaction phenomenon of the Xinmo landslide was weak. Hence, these models were not suitable for simulating the movement characteristics of the Xinmo landslide. The FFF model recommended in this study for the calculation of the Xinmo landslide had a total movement time of 120 seconds and an average speed of 57 m/s. In addition, the results showed a maximum movement speed of 74 m/s at a horizontal distance of 1950 m for the sliding body. Furthermore, the speeds at four characteristic points, such as the landslide shear outlet and Xinmo Village, were analyzed quantitatively, and the deposit thickness at each point was simulated. Additionally, the scraping effect of the landslide was quantitatively analyzed and the scraping depth was calculated across a range of 3 m to 10 m during landslide movement. The FFF model that was used in this study to simulate the Xinmo landslide and its parameters can also be used to simulate the dynamic disasters of similar high-position rock landslides in the Songpinggou region where the Xinmo landslide was located and in other regions.
Investigation of the reactivation mechanism and the disaster effects of the old landslide in the 1933 Diexi earthquake
The Diexi landslide in Xinmo had a volume of 330 χ 104 m3 due to its high position shear sliding. The continuous loading and deposition on the upper portion of the old landslide caused the upper portion of the old landslide to be reactivated. Thus, the volume of loading that caused the old landslide body to be reactivated required investigation. In this study, the stability of the upper portion of the old landslide body was calculated using Geostudio-slope/W. The upper portion of the old landslide body was modeled separately (Figure 16) using the Moor-Coulomb model. The bedrock and cover layer were treated as two different materials, and the parameters were those shown in Table 4. For the sake of computational convenience, the loading method was simplified by applying the force to the middle and rear portions of the old landslide body to simulate the loading in the calculation.

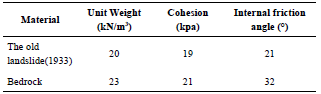
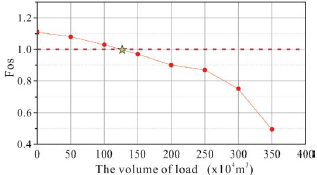
The results showed the safety factor of the old landslide body prior to the disaster occurrence to be 1.15. After continuous loading, the safety factor of the upper portion of the old landslide body decreased gradually. When the load reached 125 χ 104 m3, the safety factor (Fos) was less than 1.0, and the upper portion of the old landslide body became unstable and slid. The relationship between the specific loaded volume and the safety factor is shown in Figure 17.
Next, DAN-W was used to conduct the dynamic simulation of the old landslide body only. There are many similar old landslide deposits in strong earthquake zones, and their reactivation is not caused by continuous loading only, but rather may also be induced by other factors, such as rainfall and earthquakes. For this reason, the sliding volume of the sliding source area was not considered in the calculation for this study, and the friction model was used. The parameters are shown in Table 3. The results showed that the entire process of the old landslide movement lasted 80 seconds. The maximum movement speed was obtained as 53 m/s at a horizontal distance of X = 1900 m with a scraping depth of 3 m (Figure 18a and b). At 42 seconds, the front edge of the sliding body reached Xinmo Village at a speed of 45 m/s with a deposit thickness of 45 m (Figure 18c and d). The speed and the deposit thickness were sufficient to cause enormous damage to Xinmo Village. After the Wenchuan earthquake, shattered mountains provided sources of material for landslides. Therefore, it is very necessary to study the stability of old landslides in populated areas, calculate the scope of disaster mitigation for old landslides, and take the corresponding measures to prevent similar disasters.

Figure 18 Dynamic disaster effect of the old landslide. (a) Scenario of the 2D depth profile of the rockslide-debris run-out of the old landslide, (b) Graph showing the velocity variation of the old landslide with slippage change, (c) velocity variation of the spot at Xinmo village, and (d) thickness variation of the spot at Xinmo Village.
Conclusion
On June 24, 2017, a landslide struck Xinmo Village, Mao County, Sichuan Province, buried the village, and caused 83 deaths. By focusing on the disaster-formation mechanism of the Xinmo landslide based on a field geological survey, remote sensing satellite images, and probing the dynamic characteristics of this landslide using DAN-W and geological rheological models, the following conclusions were reached:
1. On the basis of the field geological survey, the zoning characteristics of the Xinmo landslide were analyzed by investigating the regional geological environmental conditions, such as the strata structure, easy-sliding structure, precipitation, and hydrogeology. Accordingly, the landslide was divided into a landslide source zone, a debris avalanche zone, and a landslide-avalanche debris accumulation zone.
2. The entire movement process of the Xinmo landslide was primarily divided into three stages: (1) the ridge-top landslide being sheared out, (2) the dynamic impact and the accumulation loading induced high-speed long-distance sliding of the residual soil body on the slope, (3) scattered accumulation along the western and eastern sides of the avalanche debris falling zone and the pushing of the upper portion of the old landslide accumulation body in the middle.
3. The movement characteristics of the Xinmo Landslide were successfully simulated using the landslide dynamic software DAN-W and the FFF rheological model. According to the calculation, the movement duration, maximum velocity, and average thickness of the accumulation body of the Xinmo landslide were 120 seconds, 74 m/s, and 10-25 m, respectively. The reactivation initiation mechanism and the dynamic disaster effect of an old landslide under the continuous loading conditions were analyzed quantitatively. Hence, DAN-W and the FFF model can effectively provide a reference for similar studies regarding the dynamic disaster effects of ridge-top rock landslides.

