


 English (pdf)
 Article in xml format
 Article references
 Send this article by e-mail
 Cited by SciELO
  Cited by Google
  Similars in
SciELO
Similars in
SciELO  Similars in Google
 Permalink
Introduction
The Cesar-Ranchería basin (Figure 1) fulfills all the requirements for hydrocarbon expulsion, generation, and migration (Barrero et al., 2007; Hernández & Jaramillo, 2009; Mesa & Rengifo, 2011), and it is also considered to hold the most extensive coal bed methane (CBM) potential in Colombia (García-Gonzaléz, 2010). Although the mid-Cretaceous calcareous succession and the Barco Formation has been considered the primary target reservoir in the area (García et al., 2007; Mesa & Rengifo, 2011), new core data and episodes of expulsion and probable remigrations in the Miocene time (Ayala, 2009; Sánchez & Mann, 2015) turns the Cenozoic clastic rocks into an attractive exploratory section to evaluate its potential as a hydrocarbon reservoir

Figure 1 A). Regional tectonics of the Caribbean-South American plate boundary and geological setting of the Cesar-Ranchería basin (CRB). B). Location map of the study wells in the southern part of the Cesar sub-basin. Modified from Bayona et al. (2009) and SGC (2015). C) seismic line GM-81-07 from Mora & García (2006), showing the geological setting of the ANH1, ANH-2 wells, located in La Loma syncline, D) Schematic diagram based on surface and well's information of ANH-3 well, located next to the Perija range foothills.
The southern part of the Cesar sub-basin is considered a prospective area for the hydrocarbon industry. It preserves several tens of meters of reservoir units, the most significant thickness of the Cenozoic clastic section compared to the other sub-basin sectors (Martinez et al., 2012; Sánchez & Mann, 2015), offering an excellent opportunity to apply well log interpretation techniques. This allows the estimation of petrophysical parameters, such as total porosity, effective porosity, permeability, water, and oil saturation, acquiring a quantitative perspective and providing accurate and essential information in reservoir evaluation (Rider & Kennedy, 2011; Wu & Grana, 2017).
In this context, by examining the relationship among the petrophysical rock properties, petrophysical rock types, and hydraulic flow units, this research aims to provide data to understand the petrophysical behavior while contributing to the knowledge of hydrocarbon accumulation potential in bypassed reservoir units within Cuesta, La Loma, and Los Cuervos formations. Such new data should be considered when studying the feasibility of future exploration projects in the area.
Geological Framework
The hinterland Cesar-Ranchería basin, located at the northern part of Colombia, is bounded by the Santa Marta Massif (SMM) to the west, the Perijá range (PR) to the east and the northern termination of the Santander massif to the south (Figure 1A). The geological evolution of these three mountain systems controlled the geodynamics of sedimentation and subsidence of the Cesar-Ranchería basin (Ayala et al., 2009, Bayona et al., 2011, Sánchez & Mann, 2015). Presently, the basin is divided into two sub-basins by the Valledupar high the Ranchería sub-basin to the north and the Cesar sub-basin to the south (Figure 1A).
The analyzed ANH-1 and ANH-2 wells are located in the southeastern sector of the Cesar sub-basin in both flanks of La Loma syncline. Which is a structural low with 5 km of structural relief that preserves the major thickness of Cretaceous and Cenozoic units, limited at the western by La Loma Fault, a NW-SE striking thrust, and at the eastern by the Tigre Fault an eastward-dipping, NW-SE striking thrust with ca 1-1.5 km slip (Sánchez y Mann., 2015) (Figure 1B,1C). Whereas ANH-3 well is located farther south at the foothills of the junction of the northern Santander massif and the southern part Perija range. This area constitutes another tectonic block in the hanging wall of the Tigre fault where most of the late Cretaceous and upper sections are truncated by Eocene unconformity and shows a complex faults pattern with a NE-SW main fault trend, and a secondary fault trend composed of EW and NW-SE impacting fault populations (Sánchez & Mann., 2015) (Figure 1B,1D).
Cesar Sub-basin
Volcano-sedimentary rocks from the lower Jurassic La Quinta Formation are the oldest sedimentary rocks drilled in the Cesar sub-basin (Mesa & Rengifo., 2011), studies report the existence of an extensional domain, accompanied by intense volcanism and the consequent development of volcano-sedimentary units (La Quinta Formation) (Maze, 1984, Zuluaga et al., 2015). This configuration prevailed until the Early Cretaceous, allowing the deposition of post-rift sediments (Rio Negro Formation) (Cáceres et al., 1980, Ayala, 2009). With the start of a passive-margin regime in the Aptian-mid Campanian the depositional environment changed to marine environments from internal to external carbonate platforms, giving way to the development of limestones, mudstones, and calcareous shales which are occasionally rich in organic matter (Cogollo Group and La Luna formations) (Cáceres et al., 1980, Gómez, 2001, Ayala, 2009). There is evidence of high tectonic subsidence in the Maastrichtian as there is a major unconformity separating La Luna from Molino Formation (Martínez & Hernandez, 1992). The anoxic-sulfidic settings of La Luna Formation were transitionally replaced by post-oxic conditions in Molino Formation (or Colon Formation) when aerobic environments were established in the upper Maastrichtian (Martínez & Hernandez, 1992). The Molino Formation is divided into Tres Esquinas and Socuy members at the base, marked by two major paleobathymetric fluctuations. The accumulation in the lower Tres Esquinas member is mainly chemical with precipitation of glauconita. The upper Socuy member records a definitive regression with increasing oxygenation and the input of synorogenic (metamorphic and plutonic) and siliciclastic detritus mixing with calcareous shales (Martinez 1985; Martinez & Hernandez, 1992).
The marine sequence is followed by the presence of transitional to continental Cenozoic deposits, whose sediments mainly came from the southeastern flank of the SMM (Bayona et al., 2007, Ayala et al., 2009), represented in the Cesar sub-basin by Paleogene sandy Catatumbo and Barco formations that changed up-section to sandy-muddy lithology of the Los Cuervos Formation with the presence of associated coal seams (Ayala et al., 2009). Coarse-grained fluvial and alluvial fan deposits of lower Eocene age have been reported by Mora et al. (2006) and Ayala et al. (2009) as La Loma unit. Sandy continental deposits of Miocene age (Cuesta Formation) are found between two angular unconformities present in the basin of Eocene Middle-Oligocene and upper Miocene-Pliocene age (Sánchez and Mann, 2015) (Figure 2).

Figure 2 Generalized stratigraphic column of the Cesar sub-basin. Modified from Mora & García, 2006.
Material and Methods
The available data for this study were provided by the Agencia Nacional de Hidrocarburos (ANH) of Colombia. These new data include stratigraphic core information and digital well logs from three stratigraphic wells (ANH-1, ANH-2, and ANH-3).
The logs set includes all the basic tools, such as caliper (CALI), spontaneous potential (SP), gamma ray (GR), shallow and deep resistivity (LLD, ILS), density (RHOB), neutron (NPHI) and photoelectric factor (PEF) logs. Petrophysical software was used to integrate and conduct the qualitative and quantitative analysis of the information.
Environment corrections and depth calibrations were done prior to the well log analysis using core information and gamma-ray log as a reference curve. The shale content (V-sh) was calculated for each operative interval from gamma-ray GR log (equation 1) (Dresser Atlas, 1979). Estimations of porosity (0) were made from density (RHOB) log (equations 2,3). V-sh parameter and resistivity logs (LLD) in the Indonesian Equation (equation 4) were used to obtain water saturation (Sw).
Gamma-ray log has a direct relation with shale volume: a low response of gamma ray indicates clean intervals. In order to reveal intervals with better reservoir probability, the volume of shale in the Cenozoic clastic section was estimated from a gamma-ray log, using the equation (1).

Where:
Vshgr = Shale volume from gamma ray
Grlog = Gamma-ray reading of formation
Grmax = Maximum gamma-ray reading in the shale zone
Grmin = Minimum gamma-ray reading in the clean zone.
Total porosity (Øt) can be derived from density, neutron, or sonic logs. However, the effective porosity (Øe) requires a correction of the clay content, as shown in equation (3). In this study, the porosity estimated through density log (PHID) by equation (2) (Dresser, 1979), after shale effect correction, provides the best results when compared against laboratory data.

Where:
PHID = Porosity derived from density log
RHOB = Log density
RHOB ma = Matrix density (Ss = 2.65g/cc, Ls = 2.71 g/cc, dolomite = 2.87 g/cc)
RHOB f = Fluid density (fresh water mud = 1.0 g/cc, salt water mud =1.1g/cc).

Where:
Øe = Effective porosity
Øt = Total porosity
Vsh = Shale volume.
An important step in petrophysical evaluation is to determine the percentage of rocks filled with specific fluids, such as water, oil or gas (Tiab et al., 2012). Water saturation is always part of the fluids that occupy the pore spaces of reservoir rocks (Dresser, 1979). Water saturation was estimated using the Indonesian equation (4), due to the presence of clay content on the sandy facies in the studied section.
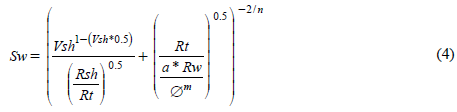
Where:
Sw = Water saturation
Rsh = Resistivity measure in 100% shale
Rt = True resistivity
Rw = Formation water resistivity
a = Tortuosity exponent
m = Cementation exponent
n = Saturation exponent.
The Pickett Graphical Method (Pickett, 1966), with theoretical values of m = 2, n = 2, and a = 1, was used to determine the formation water resistivity.
Based on the fluid saturation property, expressed as the fraction or percentage of the total pore volume occupied by the oil, gas or water (Tiab et al., 2012), the hydrocarbon saturation can be deduced by the relation (5).

Relations between permeability and porosity were used to identify points with similar flow conditions and to clarify the presence of hydraulic flow units (Lee et al., 2002; Perez et al., 2005; Mahjour et al., 2016). Hydraulic flow units (HFU) were calculated using the Winland R35 method (Windland, 1972; Gunter et al., 2014) that refers the radius of the pore throat, in which the poral networks are interconnected and form a pattern of continuous flow (R35 factor), providing good results in to correlate porosity and permeability laboratory data (Ross-Coss et al., 2016).
The use of hydraulic flow units allows the identification of pathways with similar hydraulic flow conditions widely related to the reservoir quality properties (Lee et al., 2002; Perez et al., 2005). The identification and classification of HFUs were based on Winland's methodology (Gunter et al., 2014), using a log linear cross plot of Permeability (mD) vs Porosity (v/v) and R35 value through equation (6).

Where:
R35 = Radius of the poral throat when the core samples are 35% saturated
Kc = Average air permeability
Øc = Measured porosity of the core.
Petrophysical rock types were calibrated with core information and defined from logs through an unsupervised model by hierarchical cluster method in the IPSOM tool of the petrophysical software.
Results
Lithological units identified in the three wells
The Miocene Cuesta, the lower to middle Eocene La Loma Formations, and the upper Paleocene Los Cuervos Formation were identified based on sedimentological core description and well log responses, preserving their stratigraphic sense and in accordance with seismic interpretations of the southern part of the Cesar sub-basin (Mora & García, 2006; Mesa & Rengifo., 2011; Sánchez & Mann, 2015), along with the characteristics described for La Loma Formation in the area (Mora et al., 2006; Ayala, 2009). Next to Perija range, basal Cretaceous sandstones (Rio Negro Formation?) were identified in ANH-3 well (Figure 3).

Figure 3 Stratigraphic correlation, datum in 150 m for the three wells of the study, showing gamma-ray patterns of each formation and their lateral variations. The blue squares represent oil impregnations; however, they do not represent the thickness or level of impregnation.
A brief description of each formation is presented below from the stratigraphic columns provided by the ANH.
La Loma Syncline area (ANH 1 and ANH-2 Wells):
Los Cuervos Formation shows in the lower segments of the cores bioturbated carbonaceous mudstones with plane parallel lamination and sheets of coal intercalated with thin bedded, glauconitic, and fine-grained sandstones. At the middle and upper parts of the cores increase the presence of laminated, fine- to medium-grained litharenites. The presence of organic matter and sulfur decrease at the top (Figure 3).
La Loma Formation is composed by medium-to coarse-grained sandstones (mainly sub-lithoarenites and quartz sandstones), locally conglomeratic, with cross beds and oxidation marks. These sandstones are intercalated with clast and matrix supported conglomerates. Gray mudstones and siltstones interbeds are present in the middle segments of this unit. According to Mora & García. (2006), the contact with the Cuervos Formation is probably a paraconformity.
The Cuesta Formation is stratigraphically in discordant contact over La Loma unit. This is a heterogeneous unit characterized by thin intercalations of poorly sorted litharenites, arkosic sandstones with polymictic conglomerates, and mudstones.
Perijá foothills area, ANH-3 Well.
The formations exhibit important lithological and thickness variations at east of the Tigre fault where most of the late Cretaceous and upper sections are truncated by Eocene unconformity (Sánchez & Mann., 2015) and the rocks have major influence from the Santander Massif and Perijá Range as sediment sources (Ayala et al, 2012; Ojeda & Sánchez., 2013). In ANH-3 well, upper Cretaceous and Paleocene sections are absent, hence La Loma Formation it's in discordant contact with Cretaceous basal sandstones.
Cretaceous basal undifferentiated, Rio Negro Formation?
Composed of sub-lithoarenites and quartz-sandstones, fine to coarsegrained well cemented occasionally conglomeratic with cross-stratification and siliceous conglomerates with imbricated intraclasts.
There are sporadic intercalations with sandy mudstones which contain calcareous layers and lenses. Sulfur, organic matter, carbon drapes, and chip drapes, dispersed pyrite, carbonate-filled fractures, and oxidation marks are common throughout the range.
La Loma Formation
The presence of accommodation space and sediment supply nearby source areas allow the accumulation on foothills areas of the basin (Ayala, 2009) favoring the deposition of lower Eocene rocks closer to the Santander-Perija ranges. La Loma Formation, in ANH-3 well, is in contact discordant with basal cretaceous sandstones and consist of conglomerates with sub-angular muddy intraclasts and very fine to coarse-grained lithoarenites-quartz sandstones which contain muddy, lithic, and chert intraclasts. at the top decreases, the grain size of the sandstones and the conglomerates are less common.
Cuesta Formation
The Cuesta Formation is stratigraphically in discordant contact over La Loma unit. This is a heterogeneous unit characterized by thin intercalations of poorly sorted litharenites, sub-litharenitas sandstones occasionally conglomeratic with polymictic conglomerates, and mudstones.
The data analysis of the ANH-3 well will be carried out separately due to the important variations of lithology, and tectonic story in the Cenozoic between la Loma syncline area (ANH-1 and ANH-2 wells) and the hanging wall of the Tigre fault, near the foothills of the Santander-Perija junction area (ANH-3 well).
Shale Volume Estimation (Vsh)
La Loma Formation has the lowest Vsh values in the interest formations, ranging from 21% to 25%, with 23% on average. The Cuesta Formation shows shale volume trends from 28% to 37%, with 33% on average in ANH-1 and ANH-2 Wells and 30% in ANH-3 Well. The uppermost 70 m of Los Cuervos Formation has the highest shale volume compared to the other formations with values from 28%-39%, and 34.5% on average. The basal Cretaceous sandstones only, present in ANH-3 Well, has 22.5% of shale volume on average (Table 1).

Porosity (Ø)
Histograms of effective porosity model on ANH-1 and ANH-2 wells show that the Cuesta Formation has the highest data frequency, from 20% to 27%, with 23.5% on average. Similarly, the data from La Loma Formation ranges from 15% to 23%, with an average value of 19%, and the Los Cuervos Formation data, from 13% to 18%, with 15.5% on average (Figure 4). The ANH-3 well presents ranges of porosity from 0,6% to 3% on average, in all formations (Figure 4).

Figure 4 Porosity values and frequencys histogram of effective porosity model in the formations of the study A) Cuesta Formation, B) La Loma Formation, C) Los Cuervos Formation, and D) ANH-3 Well.
Combination with other porosity estimations through neutron-density and sonic logs were included in a cross plot to determine the type of porosity on each well, as proposed by Hakimi, et al. (2012). These porosities are predominantly primary or intergranular more than the secondary porosity type found on ANH-1 and ANH-2 wells. Conversely, there is an absence of primary porosity on the ANH-3 well, corresponding mainly to the presence of secondary porosity (Figure 5).

Water Saturation (Sw)
The estimated water saturation values show some intervals with less than 50% Sw in the three studied formations, reflecting interest intervals according to cut offs values standard (Table 2).

Hydrocarbon Saturation (Sh)
This estimation allows finding notable hydrocarbon saturations on some intervals having a good correlation with oil impregnations reported in cores (see figure 8 for data of ANH-2 well) (Table 2).
Petrophysical Rock Types
Well logs reflect direct and indirect measures of rock properties, providing the possibility to determine groups of rocks with particular characteristics that distinguish them from other rock types (Gunter et al., 1997b). These rock groups are called lithotypes or petrophysical rock types.
Relations between electrical log responses were studied to define how many rock types can be determined and what specific characteristics they have particular to them. This analysis defined four petrophysical rock types (Figure 6). Subsequently, these petrophysical rock types were included in a neuronal network to generate a lithotype model unsupervised by the Hierarchical cluster method. The results in the three wells were compared to a discrete log from core descriptions, showing a correlation of more than 80% (Figure 8). This first model allows the prediction of lithologies in the studied area using well log measurements.

Figure 6 Frequency histograms of gamma ray, density, porosity and resistivity values for the four lithotypes: 1. Conglomerate 2. Mudstone + Claystone 3. Heterolithic sandstones 4. Sandstones.

Figure 7 Identified hydraulic flow units and their correlation factor using porosity vs permeability plot using the Winland (1972) method.

Figure 8 Petrophysical 1D model of well ANH-2, shale volume, effective porosity and permeability models, fixed with laboratory data, water saturation model determined by the Indonesian model and hydraulic flow units.
The summary line contains the same parameter for the four lithotypes in the same histogram and shows that each lithotype can be characterized by a unique petrophysical measurement, if the vertical axis differences are considered.
Hydraulic Flow Units (HFU)
Six HFUs were defined in the study wells (Figure 7). HFU 6 represents the best hydraulic flow conditions with clusters showing the interactions between high values of porosity and permeability, and HFU 1 reflects the least remarkable values of porosity and permeability.
A bimodal trend is expressed in HFU's graph (Figure 7). One trend illustrating values of porosity less than 0.1 (v/v), widely related to ANH-3 well data, and the other, porosity values from 0.2 (v/v) to 0.35(v/v), corresponding to ANH-1 and ANH-2 wells data.
The relationship among petrophysical parameters, rock types, hydrocarbon occurrence reports, and hydraulic flow units are represented in templates, depicting a direct relation between hydraulic units 4-5-6, petrophysical rocks types 3,4 to hydrocarbon presence data reports, and the lowest values of water saturations (Figure 8).
Discussion
The characteristics of these Cenozoic formations in the Cesar sub-basin as reservoir rock have only been studied from macroscopic and qualitative points of view (Mesa & Rengifo, 2011). Cretaceous fractured carbonate rocks and Paleocene sandstones of Barco Formation sandstones have been cataloged as the main target reservoirs in the basin (Mora & García, 2006; García et al., 2007); these target reservoirs have been the object of petrophysical evaluations and the purpose of the development of exploratory wells, without favorable results in terms of findings commercial hydrocarbon accumulations (Mesa and Rengifo, 2011).
However, in prolific hydrocarbon neighboring basins that were connected to the Cesar-Ranchería basin until Eocene (Maracaibo & Catatumbo basin) and Miocene time (Middle Magdalena Basin) (Gómez et al., 2005; Mesa & Rengifo, 2011; Sánchez & Mann, 2015). Cenozoic clastic reservoirs are the main hydrocarbon hosts in equivalent formations to Barco, Los Cuervos and La Loma (Escalona & Mann, 2006; Sarmiento, 2011; Pedraza y Ramírez., 2011).
La Loma syncline area:
In this study we made the first quantitative perception as a conventional hydrocarbon reservoir quality of clastic Cenozoic rocks (Los Cuervos, La Loma y La Cuesta formations), in terms of their petrophysical properties in the Cesar sub-basin. Our study demonstrates for the wells in the La Loma syncline ANH-1 and ANH-2, the existence of intervals thicker than 1,5 m with favorable characteristics to accumulate hydrocarbons, represented by clay volumes < 30%, water saturations < 50%, ranges of porosity from 15% to 28% and permeabilities in a wide range from 5 to 300 mD (Table 2, Figure 8).
These properties are catalogued by Shogenov et al. (2015) as average to good quality hydrocarbon reservoirs (Ø (%)19-25.5; K(mD) 113-295.5). Our study documents some intervals, presenting the most common porosity and permeability values in productive reservoirs (Ø (%) 15-25), according to Dikkers (1985).
The generation of the lithotype model and the identification of hydraulic analysis flow units enhance the understanding of the petrophysical behavior of the study units in the La Loma syncline area (ANH-1 and ANH-2 Wells). These intervals of interest have a direct relationship with the confluent of these factors corresponding to: 52% of occurrence with the lithotype (4) Sandstone plus the hydraulic flow units 5 or 6 and 25% when lithotype (4) is linked with HFU 4. The Conglomerate's lithotype (1) with the hydraulic flow units 4 and 3 have a correspondence of 16% with the interest intervals defined. In less proportion, 7%, the lithotype (3) Heterolitic sandstone with HFUs (3,4 or 5) is associated with outstanding reservoir intervals (Figure 8).
The porosity values, measured from sandstones and in the porosity model trend, progressively decrease from the Cuesta formation to the deeper cored unit Los Cuervos formation in ANH-1 and ANH-2 Wells. This behavior could suggest the influence of the depth and lithostatic pressure (Rider, 1996), and reflects the typical shale composition of Los Cuervos and the consequent shale effect that reduces the effective porosity values around 3%, in respect to the total porosity estimations (Figure 4).
The Santander-Perija junction foothill area
Low porosity (< 5%) and permeability (< 10 mD) values in ANH-3 well could be associated with the local tectonic evolution of the southeastern sector of this segment of the Cesar sub-basin, which is adjacent foothills of the Santander massif and Perija range. This sector underwent high subsidence rates, as it is exposed by its burial histories as proposed by Sanchez and Mann (2015), and probably, compaction slightly higher than in the Loma syncline area to the west of Tigre Fault (Figure 1 A and C), expressed by the absence of primary porosity (Figure 4). Another factor is the possible existence of no differentiated diagenetic processes, as this well is closer to Perija-Santander junction foothills, and the direct influence exerted by this kind of processes in the modification of the petrophysical properties of the rocks (Rahman & McCann., 2012; Rahman & Worden., 2016).
Next steps for exploration
Different relations between petrophysical characteristics and other parameters and techniques have been used to enhance exploration and production processes in well-known oil fields (Baouche & Netjari, 2006; Hakimi, et al., 2012; Amigun et al., 2012). However, in unexplored and emergent basins, like the Cesar sub-basin and the foothills of the southern Perija range and northern Santander massif, these parameters, need to be related to the geological setting.
This relation helps to understand (1) the ANH-3 well behavior and (2) identify that in La Loma syncline area at the top of Los Cuervos Formation when the organic matter decrease there are sandy intervals with hydrocarbon reservoir potential in a unit typically considered a regional seal.
From the petrophysical properties point of view, Cuesta, La Loma and the upper part of Los Cuervos formations have intervals with favorable characteristics as reservoir rocks in La Loma syncline area; however, it is necessary to identify other elements for the hydrocarbon accumulation which cannot be achieved in this research. Based on studies indicating intervals in the oil and gas generation window (Martinez et al, 2012), the generation and migration episodes documented in Miocene time in the southern part of Cesar sub-basin (Ayala, 2009; Sánchez and Mann, 2015), without considering migration paths or trapping oil processes while taking into account the results here obtained, there are favorable arguments to propose that La Loma Formation and the sandy intervals at the top of Los Cuervos Formation, in La Loma syncline area have exploratory interest.
Furthermore, La Loma syncline area presents the main accumulations of source rock in the Cretaceous section, where short and vertical migration routes could take place along vertical faults, as proposed by Ayala (2009); Sánchez and Mann (2015).
In contrast in Perijá range foothills area, the source rock was eroded and Cenozoic rocks rest upon lower Cretaceous rocks suggesting that there is not petroleum system in this area, or at least not with the same mechanism of the timing and migration paths proposed for the La Loma syncline. In addition, lows porosities (< 5%) and permeabilities (< 10 mD) values on the rocks in this sector, evidence of diagenetic processes, higher compaction, and more deformation expected by the fact that is into a tectonic complex zone closer to northern foothills of the Santander massif turns this area in no attractive prospect for hydrocarbon accumulation.
Conclusions
Based on the petrophysical characterization, carried out on Cenozoic clastic units recovered in ANH-1 and ANH-2 wells, there are intervals that can be interpreted as good quality reservoirs in La Loma and Los Cuervos Formations, with clay volumes of less than 30%, effective porosity around 20% and water saturations of less than 50%. La Loma syncline area presents the best reservoir rocks characteristics in the SW-NE trend (Ø: 15-30%; K: 10-800 mD), while the least prospective area, in terms of reservoir rock, corresponds to the southeast of the studied area in the ANH-3 well (Ø < 10% and K: < 10mD).
The adjustment of the electrical logs to the lithological properties obtained from the cores establishes the relationship between direct observations and the different associations of indirect measures of the particular characteristics of the rocks taken from the logs. This relation provided elements of judgment for the generated models and allowed the identification and discretization of the total of lithofacies in 4 petrophysical rock types (or lithotypes): 1. Conglomerates 2. Claystones 3. Heterolytic sandstones 4. Sandstones.
The successful use of the lithotype model, by hierarchical group's method, includes the previous understanding between indirect measures and their relationship with direct observations. The input parameters used in this work provide models that offer a good correlation with the core information and increase the probability of predicting lithologies in other wells in the Cesar sub-basin.
The integration among the geological setting, petrophysical parameters, lithotypes and hydraulic flow units contributes to the synthesis of the petrophysical behavior of the studied formations, restricting the intervals with the best petrophysical properties (Øe (%) 15-23; K(Md) 100-300; Vsh(%) <30) to accumulate hydrocarbon to the lithotypes 1 and 4, and the flow units 4, 5 and 6. This result is a strong input to examine interest intervals as a conventional reservoir rock in the area.
The limited exploratory activity, the restricted availability of information and the complex tectonic evolution; continue to constitute a great risk for the exploration of hydrocarbons in the Cesar sub-basin. However, the integration of results presented in this study expose a strong input that contributes to the development of future exploratory and/or academic studies and to the geological knowledge of the Cesar sub-basin.

