1. INTRODUCTION
In conventional and unconventional hydrocarbon reservoirs, borehole resistivity imaging is broadly applied in exploration and development wells; this log provides precise information regarding structural framework, sedimentological features, and stratigraphy of the drilled rock sequence. Furthermore, this log is a useful complement in petrophysical evaluation, geomechanical modeling, and characterization of naturally fractured reservoirs.
Once these logs are acquired, their processing and interpretation can take several hours or even days because detection and classification of geological planes is usually a manual process performed by specialized geologists. This time consuming task often hinders decision-making at drilling sites, particularly in activities related to fractures detection, intervals selection for pressure or fluids tests, or geosteering programs. The lack of information provided by image logs might result in operational problems, and subsequent economic losses for field operators.
In order to get information shortly after image logs are acquired, several automatic dip picking or autodip techniques are employed; these techniques have been utilized since decades ago with resistivity data of dipmeter and borehole imaging tools (Grace, et al., 2000). These techniques cannot classify the detected dip and sinusoid, but they can give information about the structural framework and sedimentary features along the wells. The autodip approaches are based on correlation between resistivity curves around the borehole to identify displacements, which then define a surface across the borehole (Rider, 2000). Among practical methods, the mean square dip (MSD) is one of the most commonly applied technique (Grace, et al., 2000).
Although the MSD may lack of accuracy and provide just a few samples in some cases, it is still one of the standard methods for automatic planar geologic feature detection in oil wells. This method is employed by most oilfield service companies when automatic image picking is required. In the latest years, several authors have proposed some methodologies based on computer vision and machine learning to automatize dip detection in borehole imaging, the most relevant to this research are Al-Sit, et al., 2015; Assous, et al., 2014.
Al-Sit, et al., 2015 suggest multi-resolution texture segmentation and pattern recognition utilizing Gabor's filters (Gabor, 1946). This processing is combined with an iterative adaptation of the modified Hough's transform to enable non-distinct, partial, distorted, and steep fracture and layers identification. In this article, the tests were conducted using an optical televiewer tool, which provides 360° images of the wellbore wall. Image processing in this case did not require procedures of image reconstruction like the present work does.
Assous, et al., 2014 propose a gradient-based approach for edge detection with a phase congruency method for validation, followed by a sinusoid detection technique. The method was evaluated using borehole resistivity imaging from wireline and logging while drilling tools. The proportion of false positives reported, in the case of noisy data is less than 5%, improving to better than 2% in case of good quality data. These authors do not employ Gabor's filter, instead, they use an edge detection technique based on the Lindeberg algorithm (Lindeberg, 1996); moreover, they do not consider any clustering technique to debug the final results.
The present work proposes an automatic dip picking procedure based on bio-inspired image filters (Gabor's filter), along with morphological transformations to highlight the edges. Furthermore, this work employs Hough's transform to detect one-cycle sinusoidal objects and unsupervised machine learning (clustering) to refine the outcomes. This research shows that computer vision techniques can replace the typical correlation between resistivity curves when automatic dip processing is required. Like in the MSD, detected sinusoids in this work are not classified, but they can be employed for structural, sedimentological, and natural fractures analyses. Next paragraphs explain the computer vision techniques employed in a friendly sequence of stages, easy to follow for borehole geologists and software developers.
2. BOREHOLE RESISTIVITY IMAGING
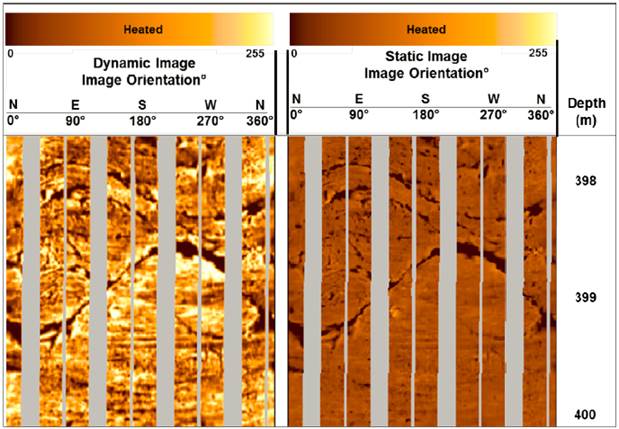
The resistivity images utilized in this research were acquired in water mud environment employing pad-based tools. This log represents a two-dimensional view of the borehole wall, it has vertical resolution of 5.0 millimeters and coverage of 80% (holes with 21.59 cm in diameter). Borehole imaging provides information about structural dip, sedimentary structures, thin layers, electrofacies, fracture networks, and horizontal stress orientation in the field, among other applications (Grace, et al., 2000). The image generation follows a regular sequence, beginning with log quality control, speed correction, and finally generation of the dynamic and static images from resistivity data normalization. The dynamic normalization is performed each foot or every two feet of log, providing a clear view of rock details along the well; the static normalization is performed on the whole logged interval, optimizing tool operations under extreme resistivity values (Figure 1). The gray gaps in Figure 1 represent borehole sections not covered with the image tool, as this is a pad-based tool.
A color code is used to interpret resistivity images, where light colors represent high resistivity values often related to limestones, oil-bearing lithologies, calcite precipitations, etc. Dark colors indicate low resistivity measurements, regularly logged in conductive rocks, open pore space, borehole breakouts, and some minerals (e.g. clays, pyrite, etc.). The most common geologic events observed in image logs are well-defined planes that can be associated with bed boundaries, sedimentary structures, faults, and fractures.
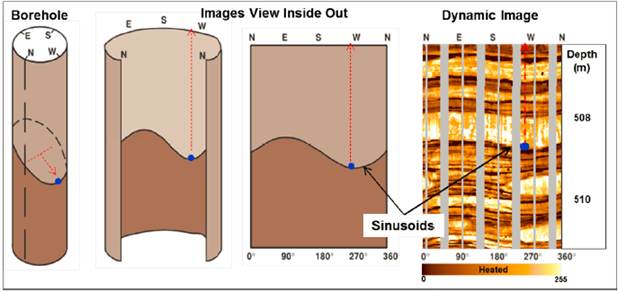
Except for the drilling-induced vertical fractures, the geological planes are observed as sinusoids in image logs. These sinusoids are the projection or trace of planar features in the borehole wall. The plane inclination (dip) can be determined from the sinusoid amplitude; the lowest point direction on the sinusoid represents the dip azimuth as shown the Figure 2.
3. CORRELATIONS BETWEEN RESISTIVITY CURVES - METHOD OF MEAN SQUARE DIP (MSD)
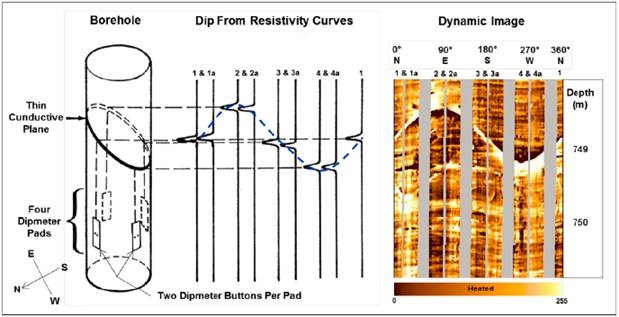
A bedding plane can be identified by correlating the resistivity curves at known positions of the tool pads. The borehole in Figure 3 shows an example of intersection by a dipping plane; the plane has a different resistivity with respect to the formations above and below. The four pads in the example continuously record a resistivity or dip curve as the tool is pulled up the borehole. As each pad passes the intersection of the plane with the borehole wall, the corresponding dip curve shows a change of resistivity. The dip or slope of the plane causes the pads to encounter and record the change in resistivity at different depths on the log. The difference in depth or shift of the corresponding peaks on the curve allow the dip of the geologic plane to be calculated trigonometrically (Grace, et al., 2000).
The MSD method works on the basis of an interval correlation algorithm between selected pairs of sensors to compute displacement vectors that should all lie in the same dip plane. The MSD method considers the same depth interval on each curve and uses only the data within that interval to make correlations. In the case of low apparent dip it can be seen that nearly all the data points within the interval are considered when the correlation is made. As the apparent dip increases, less and less points enter into the correlation. In areas where high dips, or high apparent dips because of deviated borehole conditions are expected, an initial displacement, i.e., a focusing plan, can be defined by the interpreten This focusing plane can be chosen as either a fixed plane with orientation defined by the analyst or a plane defined from a previous dip calculation. The button-to-button displacements are computed and the best-fit plane through them is found (Grace, et al., 2000).
4. COMPUTER VISION TECHNIQUES
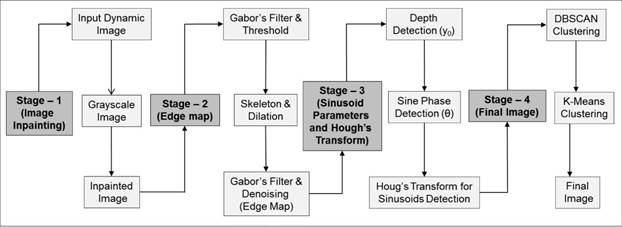
Computer vision can be defined as a scientific field that extracts information out of digital images. The type of information gained from an image can vary from identification, space measurements for navigation, or augmented reality applications (Ranjay, 2017). Another way of defining computer vision is through its application; computer vision is about building algorithms to understand the content of images enabling computers to see, identify and process images in the same way that human vision does. The diagram in Figure 4 summarizes the sequence of computer vision techniques employed along each analyzed well; the process begins with the dynamic image as input and ends with the same image with all detected sinusoids.
4.1 STAGE1 - Inpainting
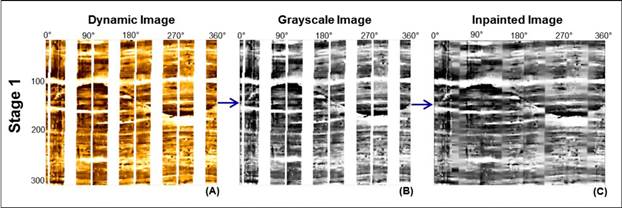
The process starts with an RGB color image from the dynamic normalization in scale of 1:10, with dimension of 300 pixels long by 360 pixels wide (Figure 5A); this image is converted into a grayscale image, in which each pixel represents a single value with intensity information (Figure 5B). Subsequently, an inpainting technique based on a fast marching method is applied.
Digital inpainting provides a means for reconstruction of small damaged portions in images; this procedure starts from the boundary of the region to be inpainted and moves towards the damaged section, gradually filling everything in the boundary first. Each pixel is replaced by a normalized weighted sum of all the known pixels in its neighborhood. More weight is given to those pixels lying near the boundary of the missing parts, such as those near contours (Telea, 2004). Once a pixel is inpainted, it moves to the next nearest pixel using the fast marching method, which ensures those pixels nearest to the known pixels are inpainted first (Khan, 2019). Digital inpainting in this work was employed to reconstruct the images in those sections not covered by the image tool. It is important to notice that inpainting processing in this research is not pursuing an exact 360° view of the borehole wall; instead, this processing is applied to guide the following steps related to edge map generation. Although Figure 5C shows some artifacts added by inpainting procedures, experimental iterations show that without image inpainting the final number of detected sinusoids decreases, and the number of false positive increase. Hence, consistent improvements were observed in the outcomes using inpainting, adding it permanently to the image processing pipeline.
4.2 STAGE 2 - Edge Detection
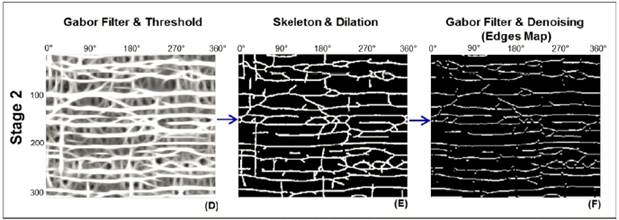
The objective of this stage is to map edges from the grayscale inpainted image by applying Gabor's filters, image binarization, morphological transformations, and Gaussian denoising. The edges of a figure are those points at which the luminous intensity changes sharply, reflecting variations in image properties; edges are important to understand and identify particular features in the whole image (Neer and Mathur, 2016).
The first step in this stage consists in applying a Gabor's filter bank (Figure 6D); this filter was originally introduced by Dennis Gabor in 1946 and currently has wide application in image processing (Arora and Sarvani, 2017). The Gabor's filter detects image gradients of a specific orientation; the convolution of image patches with different scales and orientations (filter bank) allows extraction and encoding of local texture information usable for classification (Maynberg and Kush, 2013). Frequency and orientation representations of Gabor's filters are similar to those of the human visual system, particularly appropriate for texture representation and classification. In the spatial domain, a 2D Gabor's filter is a Gaussian kernel function modulated by a sinusoidal plane wave. Simple cells in the primary visual cortex of mammalian brains can be modeled by Gabor functions. Thus, image analysis with Gabor's filters is thought to be similar to perception in the human visual system (Arora and Sarvani, 2017).
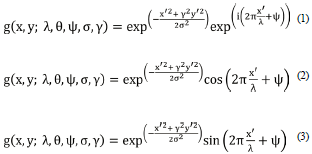
The filter has a real and an imaginary component representing orthogonal directions. The two components may be formed into a complex number or used individually, modeled by the Equations (1) for complex, (2) for real, and (3) for imaginary.
Where:
And:
In the above equations:
λ - Wavelength of the sinusoidal component.
θ - The orientation of the normal to the parallel stripes of Gabor function.
ψ - The phase offset of the sinusoidal function.
σ - The standard deviation of the Gaussian envelope
γ - The spatial aspect ratio and specifies the ellipticity of the support of Gabor function.
After Gabor's filter is applied in several scales and orientations (filter bank, Figure 6D), the resulting image is thresholded and converted into a matrix of one (white) and zero (black).
In the second step of this stage two kinds of morphological transformations are employed, skeletonization and dilation (Figure 6E). Morphological transformations are simple operations based on the image shape, normally performed on binary images. The skeletonization reduces binary objects to one-pixel wide and can be useful for feature extraction; this morphological transformation converts white sections into a one-pixel wide skeleton, with the same connectivity as the original figure. Although the skeleton image in this step seems to be clean and optimal for the following Hough's transform processing, it is still a low-quality image and has not enough white pixels for sinusoid recognition. Once the skeleton image is created, morphological transformations of dilation are used to highlight the edges. Morphological dilation augments the white sections by enlarging bright regions of the image (Pratt, 2007).
The final step in this stage can be considered as an initial cleaning step (Figure 6F); the objective is to generate an edge map clean enough for Hough's transform processing. In order to do so, a second Gabor's filter is employed, but this time with a fixed angle and kernel. This filter removes noise or artifacts aligned 90° in the image; these vertical artifacts can be produced by previous inpainting processes applied over sections without resistivity data in the borehole wall. At this point, some salt and pepper noise can remain in the image and a Gaussian blur is applied to remove it. Gaussian blur is a smoothing technique to eliminate noises, where the image is convolved with a Gaussian kernel.
4.3 STAGE 3 - Sinusoid Detection
This stage includes computation of all parameters of the Hough's transform for sinusoid detection, and according to the Equation (4) they include:
x, y - Pixel position (x, y)
Amp - Amplitude
ω - Frequency (One cycle sinusoids; ω = 1)
θ - Phase
y0 - Depth
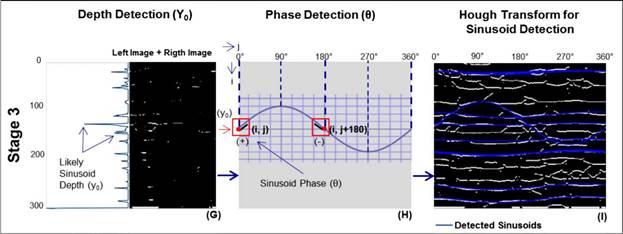
After denoising processing in Stage - 2, this stage continues with the generation of two equal-size images from the edge map. The first image can be created from the left side of the edge map, having 300 pixels long by 180 pixels wide (from pixel 1 to pixel 180); the second image has the same shape, but its width goes from pixel 181 to pixel 360. Afterward, these images are added using a function for image addition. The bright spots in the resulting image are added at each level (i axis), and its values are represented as a curve at the left side of the added image (Figure 7G). The spikes in this curve are likely levels where a sinusoid might be present, and they can be considered as likely "y0" values in Equation (4).
In the second step of this stage, the sinusoid phase (θ) must be determined. To compute the “θ” values, each likely “y0” level must be analyzed using the Figure 6F. The first pixel (≥ 1) from left to right at a position (i, j) in each likely “y0” level, must have another projected pixel (≥ 1) at the position (i, j+180). If this condition is accomplished, two square regions of 10 x 10 pixels are inspected around the points (i, j) and (i, j+180), respectively (Figure 7H). In each
square region, a Hough’s transform algorithm for line detection is applied, in which only “y0” levels with slope combinations (+, -) and (-, +) are considered as potential level with a sinusoid. The “j” or “j+180” coordinate at each potential “y0”, in the points (i, j) or (i, j+180), will be the phase (θ) of that sinusoid if the square region at that point has a line with positive slope (Figure 7H).
The Hough's transform is a feature extraction technique used in image analysis, computer vision, and digital image processing. The purpose of the technique is to find perfect or imperfect instances of objects within a certain class of shapes by a voting procedure. This voting procedure is carried out in a parameter space, from which object candidates are obtained as local maximum in a so-called accumulator space that is explicitly constructed by the algorithm (Shapiro and Stockman, 2001). The basic Hough's transform is typically applied to identify parameterized curves, such as lines, circles, ellipses, parabolas, or other parameterized shapes. In this step it was applied in its simplest form to detect line-shape objects in the 10 x 10 pixels regions.
At this point, the "y0" depth and the phase "θ" of Equation (4) are already calculated for each detected level with a sinusoid. Next, the basic Hough's transform employed to recognize lines was edited to detect one-cycle sinusoidal objects. In the final step of this stage, all detected "y0" and "9" were arranged in a list of dictionaries with form: [{y1:θ1}, {y2:θ2}, {y3:θ3]}... {yn:θn}], and the Hough's transform for sinusoids detection was applied using this list to the Figure 6F.
In order to detect sinusoids in the image, the Hough’s transform uses an accumulator matrix of two dimensions (Amp, θ). The sinusoidal candidates are produced by voting in the Hough space, in which high-voted candidates have local maxima in the accumulator matrix. The algorithm scans through the image, and if an edge point is found, the sine equation is solved for the amplitude, using all combinations of “yn” and “θn” in the list of dictionaries, Equation (6).
The algorithm fits the Equation (6) to each edge in the image, and when a sinusoid is found, the accumulator increase at that point (Amp, θ); consecutively, the algorithm passes to another white pixel saving all results. Figure 7I shows unfiltered sinusoids detected until this stage.
4.4 STAGE 4 - Final Image
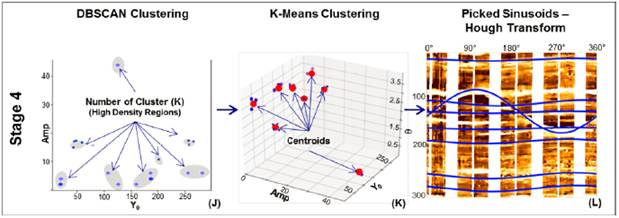
After Hough's transform is solved for the Equation (6), unsupervised machine learning techniques are applied to fíltrate multiple detected sinusoids related to the same geologic feature. The density-based spatial clustering of applications with noise (DBSCAN) and K-means clustering are applied. These steps remove duplicate sinusoids related to equal geological planes at the same depth (y0). It is important to notice that sinusoid parameters are arranged in a three-dimensional array with shape: [Amp, θ, y0]. The DBSCAN method is applied to find the number of high-density regions in previous array; this clustering technique produces a partitional clustering, in which the number of clusters is automatically determined by the algorithm (Tan, et al., 2006). In the DBSCAN, the high-density regions are separated from another of low-density as shown the Figure 8J. The number of regions detected by this method will be the "K" input of the following K-means clustering.
Afterward, the K-means algorithm is applied to the same sinusoid parameters array to find the centroids of each high-density region detected by the previous DBSCAN. K-means is a proto-type-based, partitional clustering technique that attempts to find a "K" number of clusters, which are represented by their centroids (Tan, et al., 2006), as shown the Figure 8K. The centroids found in the previous step are finally plotted over the original RBG image, where each sinusoid has a centroid for its amplitude (Amp), phase (θ), and depth (y0), respectively (Figure 8L).
5. RESULTS AND COMPARISON
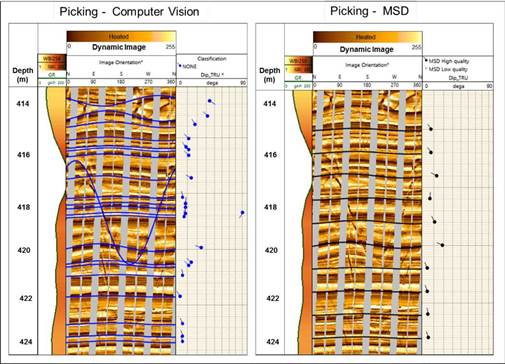
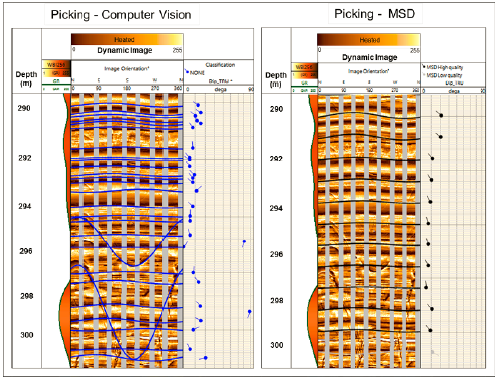
In order to test the automatic dip picking proposed in this work, the MSD processing and the computer vision technique were evaluated in 1012 m of wireline-acquired borehole imaging. The test included several wells in clastic and carbonate environments, using two kinds of imaging devices (pad with flap and only-pad tools), as shown the Figure 9 and Figure 10, respectively.
The metric employed to compare both results was the number of false positives found by each method; a false positive occurs when the method finds a sinusoid and it does not exist, in other words, the method places a sinusoid and it does not represent any geologic feature (e.g. bed boundary, fracture or sedimentary structure). The false positives recognition in both methods was performed by a specialized geologist according to regular borehole imaging interpretation procedures. Once the methods were executed, the number of false positives for the MSD was 90 in a total of1127 recognized sinusoids (7.986%); while the computer vision approach had 28 false positives in a total of 3186 recognized sinusoids (0.879%). Moreover, is particularly important to notice the number of detected samples by each method, 1127 for MSD versus 3186 for the method proposed in this research.
Figures 9 and 10 show examples of how computer vision procedures can differentiate low amplitude sinusoids in the background from those of high amplitude in the front. The computer vision picking further shows better patterns related to deformations, such as in Figure 9 (414 m), where some deformations due to concretions are depicted. According to these results, there is no evidence that different tool types have positives or negative impact on the outcome. Two different image tools were employed to conduct the tests, and there was not any increase or decrease in false-positive proportions.
The processing time using the computer vision approach takes around 30 minutes for 500 m of borehole imaging; it was achieved employing a personal computer with a core i5 processor and 8 GB of random access memory (RAM). Neither special nor high-resolution graphic cards are required; the standard graphic devices provided in current computer configurations are enough for this processing.
6. CONCLUSIONS & RECOMMENDATIONS
The method proposed in this research is more accurate than the typical MSD processing; additionally, it can be applied in the field soon after image data is acquired. The input is a dynamic normalized image, which can be generated by the logging engineer in the field.
The computer vision approach was able to recognize high amplitude sinusoids in the same interval where low amplitude sinusoids are; this can be very useful during image interpretation when natural fractures and faults must be differentiated from beddings or sedimentary structures.
The computer vision processing can be easily integrated into logging units; there are no special graphic card requirements, processor, or memory (RAM). Furthermore, the entire code was developed using programming standard tools of common application (Harris, et al., 2020, McKinney, et al., 2010, Bradski, et al., 2000, and Van der Walt, et al., 2014).
Parallelized processing is recommended during application of Hough's transform algorithm to reduce processing times. The methodology proposed is highly dependent on the employed edge detection techniques; the better the edge detection is, the better will be the detected sinusoids in the image.
In this work all detected sinusoids are not classified, according its geologic origin. In order to solve this issue, classification methods based on machine learning are recommended; these machines can be trained with geologic inputs from experts, borehole logs data, and fractal attributes of borehole imaging, as methods proposed by Leal, et al., 2022, Leal, et al., 2018, and Leal, et al., 2016.


