INTRODUCTION
In Colombia, the Blanca de Jerico and Tunkahuan quinoa cultivars are the most productive in the central and southern regions of the country, with average yields of 1.4 t ha-1 (Madrid et al., 2018). These national production values indicate a low level of competitiveness compared to countries like Bolivia and Peru (Cruces et al., 2024). Additionally, lack of knowledge about the grain quality, especially in some producing regions, hinders the achievement of added value in the commercialization chain. This is crucial as local governments are actively seeking functional foods with high nutritional value as part of the strategy to improve the food security and sovereignty in their territories (Angeli et al., 2020).
According to Bazile et al. (2016) and Guerrero (2018), the biological development of this species occurred in the Andes Mountain range, and through its process of colonization and adaptation to contrasting edaphoclimatic conditions in its center of origin, it generated wide genetic variability that resulted in over 16,000 wild quinoa cultivars. This genetic diversity encodes a variety of morphological, physiological, and biochemical traits that, depending on environmental factors such as temperature, photoperiod, water availability, CO2 concentration, and soil conditions, determine its behavior and consequently the grain composition and its potential in the food industry (Reguera et al., 2018).
The above is because quinoa stands out compared to other cereals as one of the most complete foods for human nutrition due to its ideal balance of essential amino acids (isoleucine, valine, and threonine), omega fatty acids (3, 6, and 9), vitamins (B1, B9, C, and E), minerals (Ca, P, Mg, Fe, and Zn), fiber, and antioxidants (Gonzalezet al., 2012). Unlike other grains, quinoa has gained prominence for its high protein content (14-18%) and the presence of bioactive compounds such as carotenoids, tocopherols, riboflavins, and folic acid (Hernández-Ledesma, 2019). In this sense, proteins of high nutritional value have been identified in quinoa grains, with high potential for use in the food, pharmaceutical and industrial industries due to their richness in secondary structures associated with amino acids-amides (Roa-Acosta et al., 2020; García-Parra et al., 2022; Ortiz-Gómez et al., 2022).
In this context, multiple investigations have evaluated and analyzed the physiological behavior of different cultivars and varieties of quinoa, testing variations in climatic and edaphic elements in order to consolidate a route of agricultural technical assistance that allows strengthening agronomic indices (García-Parra et al., 2020a). Thus, Morillo-Coronado et al. (2020) analyzed the agronomic behavior of 19 quinoa materials from the department of Boyaca (Colombia), while Manjarres-Hernández et al. (2021a) analyzed the most representative production parameters of a group of quinoa materials that are part of breeding program in Boyaca.
Recently, García-Parra et al. (2022) analyzed the effect that the altitudinal gradient has on the phenological, productive and compositional performance of quinoa grains in the department of Boyacá; however, these studies relate variables such as the morphology of the species, its physiological and productive performance and its impact on the compositional attributes of quinoa grains.
Within this context, correlational analyses of biological and agroindustrial aspects of quinoa are scarce, especially for cultivars with significant production value in different regions of Colombia that could have substantial potential in other areas of the country. For this reason, this article aims to assess the biological performance of three Colombian quinoa cultivars under controlled conditions, estimating physiological and compositional parameters of the grains.
MATERIALS AND METHODS
Study area
This research was developed at the Victoria Agroecologica Farm, located in the municipality of Ventaquemada (Boyaca, Colombia), at an altitude of 2,780 m and location 5°22'50.56" N and 73°30'16.84" W. This area experiences an average daily temperature of 10°C, 1,600 h annual sunlight, an average annual precipitation of 882 mm, and a monthly relative humidity of 82%.
The quinoa seeds were sourced from the gene bank of the department of Boyaca. The seeds were sown and germinated in 15 kg pots, under greenhouse conditions. Once germinated, the seedlings that had poorly formed leaves and stems were eliminated. In addition, those that presented phytosanitary problems were eliminated. A drip irrigation design was carried out, in which the soil was maintained at field capacity throughout the plant's phenological development cycle. For the research, a completely randomized experimental design was constructed, with each cultivar consisting of 15 repetitions, for a total of 45 experimental units of 2 plants each.
Fertilization
The soil corresponded to an Andosol with the following physicochemical composition: pH 6.1, organic matter 8.8%, total nitrogen: 0.44%, available phosphorus: 572.2 mg kg-1; cations (cmol kg-1) Al3+ 1, Ca 36.4, Mg 7.2, K 10.3 and Na 1.1 and micronutrients (mg kg-1) Fe 93.8, Mn 11.8, Cu 9.4, Zn 9.4 and B 1.5.
The fertilization plan for the plants involved the application of organic fertilizer (P2O2: 2.44% and total nitrogen: 1.86%, K2O: 2.45%) before sowing and an additional fertilizer application 45 days after germination. 65 days after sowing, hilling was performed to strengthen root anchoring and prevent plant lodging, which is common in tall cultivars (Guerrero, 2018). Inorganic fertilizer was carried out using a mixture of fertilizers such as 'Abono Paz del Rio Escoria Tomas' and urea, with an application load of 120-60 kg ha-1 for N-P.
Phytosanitary control. Two preventive applications of copper sulfate were carried out in applications of 3 g L-1 in the branching and flowering phase to prevent mildew (Peronospora farinosa L.), a disease that limits quinoa cultivation in the inter-Andean valleys (Delgado et al., 2009).
Phenological development. This variable was evaluated by tracking the chronological time (days after sowing), from sowing to harvest of the evaluated cultivars, taking into account the nine (9) main growth states (germination, leaf development, formation of side shoots, stem elongation, development of harvestable vegetative parts, inflorescence emergence, flowering, fruit development, ripening and senescence) as proposed by Sosa-Zuniga et al. (2017).
Chlorophyll content. The total chlorophyll content was measured at each of the main phenological stages four (true leaves, branching, flowering 50% and grain filling) using a chlorophyll meter (SPAD 502Plus Konica-Minolta, Japan). For this purpose, leaves from the three thirds of the plant were selected, and the laser chamber was focused on the middle part of the leaf blade, excluding the veins (García-Parra et al., 2019a, 2019b). To measure this variable, one leaf from each third was taken in each of the experimental units.
Chlorophyll fluorescence. This variable was measured in fully expanded leaves from the three-thirds of the plant using a fluorometer (PAM-200 junior WALZ, Effeltrich, Germany). Each sample was taken at 11:00 am. Before each measurement, the leaves were subjected to darkness in aluminum foil bags to obtain the maximum quantum efficiency of photosystem II (Fv/Fm) following the methodologies proposed by Yuan et al. (2016). To measure this variable, one leaf from each third was taken in each of the experimental units.
Stomatal conductance. This variable was measured using a leaf porometer (Decagon Devices SC-1, Kuala Lumpur). To monitor stomatal activity, the equipment sensor was placed on random leaves in the three-thirds of the plants of each experimental unit. The average temperature during the trial was 14°C, with a relative humidity of 73%, and an average daily illumination of 610 µmol m-2 s-1. The data were recorded in the morning hours between 9:00 and 11:00 am.
Stomatal density.Leaves from the three thirds of the plant were taken and suspended by applying transparent resin to the leaf blade following the methodology proposed by Shabala et al. (2013). Subsequently, using a 40X magnification microscope, stomatal density was determined in relation to the number of stomata per unit area. To measure this variable, a leaf was taken from each experimental unit.
Seed production. All the seeds present in the panicle of a plant were collected and counted to quantify the grams of seeds produced by the plant.
Compositional analysis of grains
IR spectrum was obtained using IRAFFINITY-1S equipment (Shimadzu Corp., Kyoto).The light source spectrum was measured by FTIR transmittance without a sample in the optical path to establish a background reference. Subsequently, grain fraction samples (5 g quinoa grain flour) were positioned for measurement (250 and 125 µm), acquiring spectra in reflection mode between 600 and 4,000 cm-1 with an average of 32 scans at a resolution of 4 cm-1.
Spectral analysis was performed using OriginPro version 8.0 software (OriginLab Corporation, Northampton, USA). The mean and standard deviation of the quadruplicates for each sample were reported. The baseline was corrected, and the spectra were normalized between 0 and 1 (Baker et al., 2014). Once the data were normalized, each cultivar was studied to determine structural differences. For starch analysis, the spectral region corresponding to 600 and 1,200 cm-1 was examined. For protein analysis, the region of 1,500 to 1,700 cm-1 was evaluated. The band heights 2,853 to 2,900 cm-1 were also studied for fat content (Roa et al., 2014). For this analysis, measurement was performed in triplicate.
Data analysis
Multiple comparisons were made using analysis of variance (ANOVA) and Tukey's mean comparison test with a significance level of 5% (P<0.05). In addition, a Principal Component Analysis (PCA) and correlation were performed to identify associations between variables. The data were processed using R software version 3.6.1.
RESULTS AND DISCUSSION
Phenological development and morphology
According to the obtained results, significant differences were found in all stages for the three cultivars (Tab. 1). 'Titicaca' stood out for displaying the earliest phenotype, followed by 'Pasankalla', while 'Soraca' was the latest, taking 114, 130, and 172 d after sowing, respectively, to reach harvest. Morphological evaluation considered the morphological characteristics of leaves and stems of the evaluated cultivars (Fig. 1).
Table 1. Mean days after sowing for each phenological stage for the Pasankalla, Titicaca, and Soraca cultivars.
| Cultivar | Germination | True leaves | Branching | Inflorescence | 50% flowering | Milky grain | Pasty grain | Harvest |
|---|---|---|---|---|---|---|---|---|
| Pasankalla | 3.3±0.57 c | 11±1.57 b | 35.3±20.8 a | 50.3±1.52 b | 69.6±2.08 b | 100.3±1.15 b | 115±1 b | 130.6±5.03 b |
| Titicaca | 12±2.64 a | 16.3±0.57 a | 34±2.64 a | 56±1 a | 72.3±1.52 b | 83.3±2.08 c | 98.6±2.51 c | 115.6±0.57 c |
| Soraca | 7.33±1.1 b | 11±2 b | 28.3±1.52 b | 53.3±0.57 b | 96.3±1.52 a | 119±2 a | 132.6±2.3 a | 172±6.55 a |
Mean ± standard deviation (n=15). Different letters had significant differences (P<0.05) using Tukey's test.
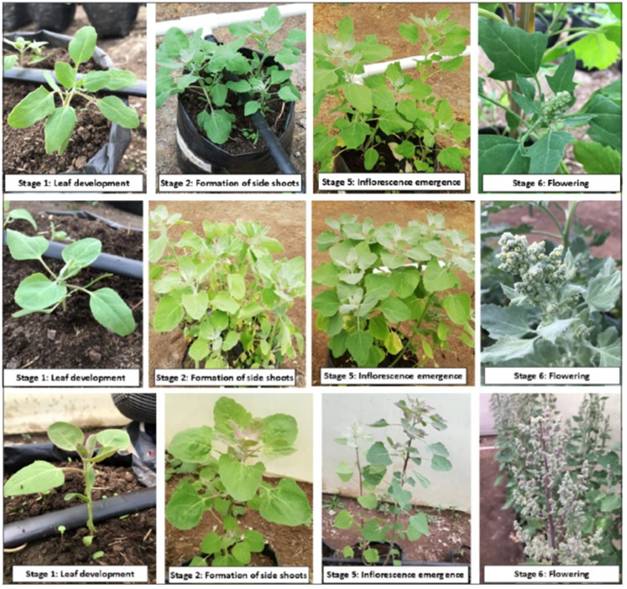
Figure 1. Phenological stages of three cultivars of quinoa. Upper 'Titicaca', middle 'Soraca' and lower 'Pasankalla'.
These cultivars reached harvest earlier than those studied by Veloza et al. (2016), which took between 180 and 210 d to harvest and were grown in the Altiplano Cundiboyacense under conditions similar to those in this research. Morillo-Coronado et al. (2017) state that the growth and development of plants are associated with their genetic and environmental traits, which makes it possible to determine if these factors affect their precocity. In this sense, Reguera et al. (2018) determined that the physiological behavior of the species depends on the origin of the cultivar, as well as the agroecological conditions where it is established, such as what happened with the Titicaca cultivar established in Spain, Peru and Chile.
The Soraca cultivar (Fig. 1) has shown in various studies a longer cycle that ranges between 171 and 202 days under open field conditions in Boyaca with an average temperature of 12°C and relative humidity of 74.1% (García-Parra et al., 2019b), which is higher than what was found in this study. Jacobsen et al. (2003) highlight this variation as a factor associated with the phenotypic plasticity of the species, typical of its high genetic diversity.
As for the Pasankalla cultivar (Fig. 1), a longer phenological cycle (175 d) was reported under open-field conditions in Pavia, Italy (Melo, 2016), which significantly differs from the results obtained in this research. This contrast probably occurred because the plants studied in Italy were exposed to various biotic and abiotic stress factors, which slowed their growth. In addition, elements such as long days in the Mediterranean could have influenced the extended cycle.
The analysis of morphological characteristics allows, in the first instance, differentiation of the expressed genetic traits and the biochemical strategies that the plant uses to adapt to the environment (Manjarres-Hernández et al., 2021b). In this regard, the leaves exhibited alternate phyllotaxy in all cultivars, with a variable petiole length among different cultivars(between 5 and 15 cm), being slightly pronounced in most of them. Additionally, pinnate venation was observed in 'Titicaca', while 'Pasankalla' and 'Soraca' displayed palmate venation (Fig. 2).
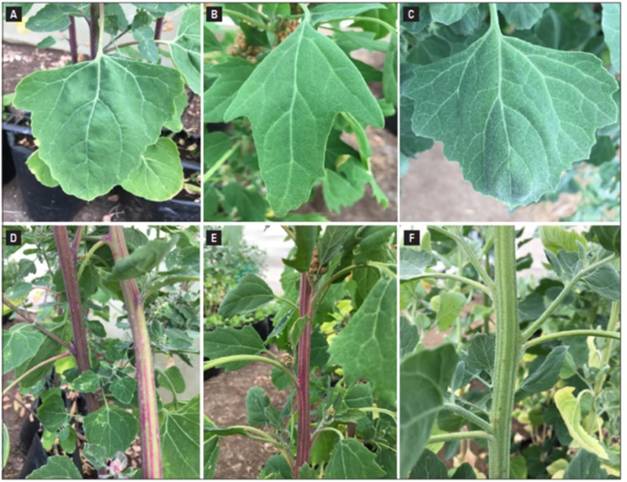
Figure 2. Morphological characteristics of the leaves and stems of 'Pasankalla' (A and D), 'Titicaca' (B and E) and 'Soraca' (C and F) of quinoa.
In this regard, the Titicaca cultivar has an ovate shape, while the Pasankalla and Soraca cultivars exhibit a deltoid shape. In all cases, the angles of insertion change as they merge into the petiole. Additionally, all leaves have an asymmetric lamina base, with an acute apex for 'Titicaca', while obtuse for 'Pasankalla' and 'Soraca'. Leaf margin, a highly variable characteristic in these cultivars, are slightly situated for 'Pasankalla' and 'Soraca', while 'Titicaca' has lobed leaves with different depths in the leaf blade. These results are similar to those reported by El-Harty et al. (2021), who identify leaves with morphology and edge similar to what was found in this research.
As has been reported in several investigations of morphological analysis of quinoa, the plant makes morphological adjustments associated with the agroclimatic conditions of the area where the plant is established. This is manifested in changes such as the architecture of the stem, the size of the leaves, the morphology of the inflorescence and the distance of the leaf nodes of the plant (Varma and Jain, 2021).
In the case of stems, the morphology is quite distinctive among cultivars, as all exhibit parallel vertical grooving with variations in color such as green, yellow, and purple, very similar to what was reported by Gómez and Aguilar (2016) (Fig. 2).
Physiological performance
It was observed that chlorophyll content showed a similar pattern in the quinoa cultivars throughout the phenological development. Significant differences in chlorophyll content were identified in the evaluated phenological stages (P<0.05), with the Pasankalla cultivar having the highest content up to the flowering stage, while 'Soraca' significantly increased content during the grain-filling stage (Fig. 3).
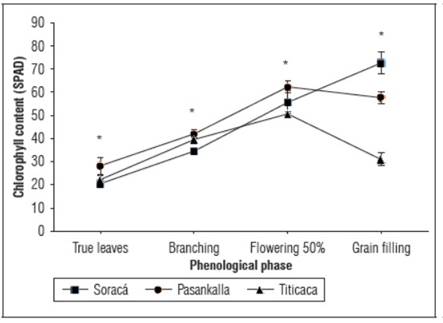
Figure 3. Total chlorophyll content during the growth of cultivars of quinoa. The bars indicate standard deviation (n=15). * Indicate significant differences between days after planting of the cultivars according to Tukey's test (P≤0.05).
Quinoa is a transitory crop (with a growth period between 4 and 8 months on average), so the dynamics of chlorophyll activity vary considerably during its growth, development and maturation (García-Parra et al., 2020b). It is important to note that chlorophyll undergoes denaturation during the senescence phase of plants, as a result of the accumulation of gerontoplasts that give rise to anthocyanins and carotenoids, which are reflected in the leaves, stems and inflorescences, as was observed in plants of 'Titicaca', where there is a marked reduction in chlorophyll during the grain filling phase (Infante et al., 2018). The Soraca cultivar presents a long phenological cycle, which according to previous research with this cultivar, can vary depending on the availability of water and nutrients, generating the reappearance of shoots such as leaves and branches that reactivate the synthesis of photoassimilates and therefore, delays the ripening of the grains (García-Parra et al., 2020c).
The maximum quantum efficiency of photosystem II - Fv/Fm varied during the phenological growth of plants, primarily before flowering. Fv/Fm decreased until the milky grain phase as there is a higher occurrence of tissue senescence in the leaves, which affects the photosynthetic machinery. In this regard, 'Pasankalla' showed greater photosynthetic stability, while the Titicaca cultivar exhibited higher fluorescence, particularly before the grain filling phase (P<0.001) (Fig. 4).
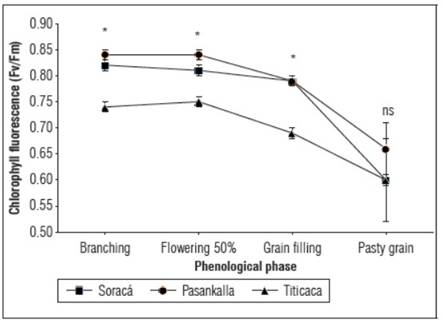
Figure 4. Maximum quantum efficiency of photosystem II of cultivars of quinoa. The bars indicate standard deviation (n=15). * Indicate significant differences between days after planting of the cultivars according to Tukey's test (P≤0.05).
Physiological stress in plants can occur due to factors such as environmental temperature, relative humidity, attack by pests and diseases, solar radiation and water status. As the level of physiological stress increases, the photosynthetic activity of plants decreases, which translates into a decrease in the indices of the maximum quantum efficiency of chlorophyll fluorescence as reported by García et al. (2020b). For the Titicaca cultivar, it has been reported that Fv/Fm varies between 0.78 and 0.8 under field conditions (Amjad et al., 2015). However, for the Soraca and Pasankalla cultivars, there is still a lack of knowledge on the quantum efficiency of PSII. The reported values indicate that the plants could be under stress. Jiménez-Suancha et al. (2015) state that values below 0.7 could indicate that the plants are experiencing damage to the reaction centers of PSII, leading to the generation of reactive oxygen species that cause denaturation of the thylakoid membrane.
The three quinoa cultivars exhibited variable behavior in stomatal conductance during the branching phase (P<0.01). However, their behavior was not significant during the flowering and grain-filling phases, as no statistically significant differences were observed (Fig. 5).
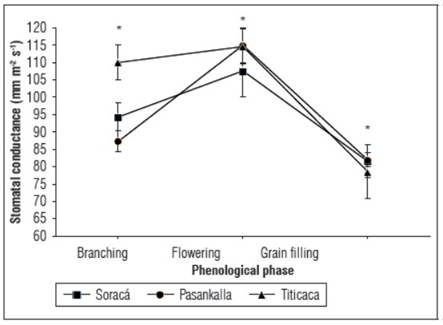
Figure 5. Stomatal conductance activity of cultivars of quinoa. The bars indicate standard deviation (n=15). * Indicate significant differences between days after planting of the cultivars according to Tukey's test (P≤0.05).
Constant and controlled gas exchange through the stomata indicates favorable activity in the carbon fixation phase. However, its efficiency can vary in some organisms of the same species, mainly in the phase where there is greater formation of plant tissue (Taiz and Zeiger, 2010).
As a result of the metabolic pathway presented by quinoa (C3), and consequently the morphological structure of the cells surrounding the stomatal pores, this species is strongly affected by external variations such as temperature, radiation, relative humidity, water content, and nutritional status and CO2 (Hinojosa et al., 2018). Ramzani et al. (2017) reported a substantial increase in stomatal conductance when quinoa is subjected to different types of stress, finding that quinoa maintains stomatal conductance stability when values are between 72 and 91 mm m-2 s-1.
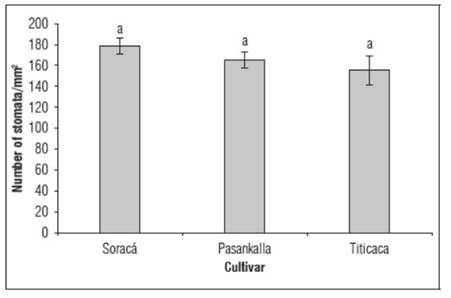
Stomatal density between the Soraca and Pasankalla cultivars differed by 12.9%, which could indicate a differential trait related to genetic characteristics, although no statistically significant differences were observed among the three cultivars evaluated. Stomatal density is important for plants as it is the site where gas exchange between water vapor and CO2 takes place. For quinoa, stomatal density ranges from 100 to 270 units per mm2 according to Shabala et al. (2013), depending on the conditions where the species develops. Similar data were reported by Issa Ali et al. (2019), who found that stomatal density varies between 150 and 188 units per mm2 for the Titicaca cultivar, slightly higher compared to the data obtained in this study for the same cultivar (Fig. 6).
Seed production
The seed production of the evaluated cultivars showed statistically significant differences (P< 0.001), with the Soraca cultivar having the highest production compared to the other cultivars, varying by 37.1 and 55.9% compared to the Pasankalla and Titicaca cultivars, respectively (Fig. 7).
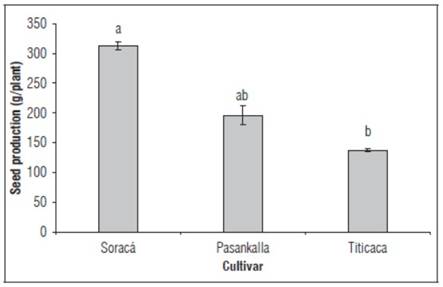
Figure 7. Seed production of cultivars of quinoa. Different letters indicate significant differences according to Tukey test (P<0.001). The bars indicate standard deviation (n=15).
Species productivity is one of the most important variables in agronomic studies; however, biologically, it has a greater connection with the individuals survival strategies to perpetuate the species (Doria, 2010). Different yield performances have been reported in quinoa cultivars. For example, the Soraca cultivar has shown grain yields of no more than 70 g under greenhouse conditions with an ambient temperature of 20°C (García-Parra et al., 2020c), a value much lower than the results obtained in this research. Regarding the Titicaca cultivar, yields of no more than 10 g per plant have been reported in genotypes from this cultivar and under controlled conditions, at temperatures between 22 and 40°C (Hinojosa et al., 2019), while for the Pasankalla cultivar, there is still a lack of research related to this variable.
Compositional analysis of grains
According to the proximal analyses conducted on the three quinoa cultivars, a significant variation in protein content and a non-significant variation in carbohydrate and fat content were determined. The Soraca cultivar showed the highest protein content, while Titicaca had the lowest (Tab. 2).
Table 2. Protein, carbohydrate, and fat contents of quinoa cultivars.
| Cultivar | Protein % | Carbohydrates % | Fat % |
|---|---|---|---|
| Soraca | 14.33±0.41 a | 53.6±3.93 a | 6.16±1 a |
| Pasankalla | 13.76±0.25 ab | 57.1±2 a | 6.16±1.01 a |
| Titicaca | 13.06±0.3 b | 49.4±4.26 a | 5.63±0.6 a |
Mean ± standard deviation (n=3). Different letters had significant differences (P<0.05) using Tukey's test.
Protein contents in quinoa grains can vary significantly and depend largely on the genotype used and the given agro-environmental conditions (Reguera et al., 2018). The Soraca cultivar has shown protein contents not exceeding 14.9% (Melo, 2016), which is similar to the findings in this research. The Titicaca cultivar exhibited a protein content much lower than in other studies which report contents of up to 18% (Reguera et al., 2018). The starch fraction is the most abundant in quinoa grains as it serves as one of the storage macromolecules, making it the highest fraction compared to proteins and fats (Polo-Muñoz et al., 2023).
FT-IR Spectroscopy revealed significant variation in the transmission bands associated with macromolecules present in the quinoa seeds of the different evaluated cultivars. The 1,633 cm-1 band showed that the Titicaca cultivar has a higher proportion associated with protein compared to the Pasankalla and Soraca cultivars. Similarly, the 1,016 cm-1 band associated with starch content and the 2,922 cm-1 band associated with fat content also showed higher proportions in the Titicaca cultivar (Tab. 3).
Table 3. Absorbance peaks of seeds from three quinoa cultivars using FTIR spectroscopy in the range between 400 - 4000 cm-1.
| Cultivar | 1,633 cm-1 C=O | 1,016 cm-1 C-H; C-O-C; C-O | 2,922 cm-1 C-H; C-H |
|---|---|---|---|
| Soraca | 0.553 ± 0.04 ab | 0.002 ± 0.0006 b | 0.699 ± 0.009 ab |
| Pasankalla | 0.19 ± 0.03 a | 0.006 ± 0.006 a | 0.762 ± 0.049 a |
| Titicaca | 0.472 ± 0.48 b | 0.001 ± 0.001 b | 0.66 ± 0.029 b |
Mean ± standard deviation (n=3). Different letters had significant differences (P<0.05) using Tukey's test.
The mid-range spectroscopy technique has been widely used to determine physicochemical characteristics of various seeds, including cereals. Rodríguez-Sandoval et al. (2012) and Czekus et al. (2019) highlighted the importance of this technique in different quinoa cultivars, as the rapid expansion of this species and the increased consumption of its seeds have led to adulteration in products marketed as quinoa. They demonstrated slight variations between bands associated with proteins, starches, and fats when comparing different agroecological zones. In this context, Czekus et al. (2019) found a direct relationship between the size of the cotyledonary structure of the seed and the protein content, as well as between the perisperm and the starch content determined through FTIR spectroscopy. Proteins are structural macromolecules of embryonic tissues present in seeds, primarily forming cell membranes in the early stages and subsequently performing activities such as photosynthesis and the transport of substances intra and extracellular (Taiz and Zeiger, 2010).
According to the above, although the cultivars evaluated are part of the same species, differences were identified in the spectroscopic intensities of the peaks associated with proteins, starches and fats. This behavior has also been reported by Amjad et al. (2015), who concluded that more than the intensity of the peak, the specific band to be analyzed should be taken into account. They recommended carrying out deconvolution analysis that allows for a more detailed look at the regions within the MIR spectrum.
Multivariate analysis
The correlation analysis shows that physiological variables such as chlorophyll content and the maximum quantum efficiency of photosystem II present a direct relationship with the compositional characteristics of the quinoa grain, especially in proteins, carbohydrates and fats (Fig. 8A). Likewise, an inverse correlation is evident between proteins and carbohydrates with the spectrum bands associated with 1,633 and 1,016 cm-1 respectively. This indicates that the FTIR method is an appropriate technique to determine the qualitative quantity of these two macromolecules.
Likewise, the principal components analysis shows a cumulative variance for the two principal components of 100% (Fig. 8B). According to the results obtained, a differential discrimination could be found between the cultivars and their association with the variables studied. The first group includes the Soraca cultivar with the highest protein content, a longer physiological period, high grain yield and the highest chlorophyll content during physiological maturation. The Pasankalla cultivar has the highest grain starch content (carbohydrates), high fat content, and the lowest chlorophyll fluorescence indices, while the Titicaca cultivar had the earliest maturity and a high capacity to carry out gas exchange.
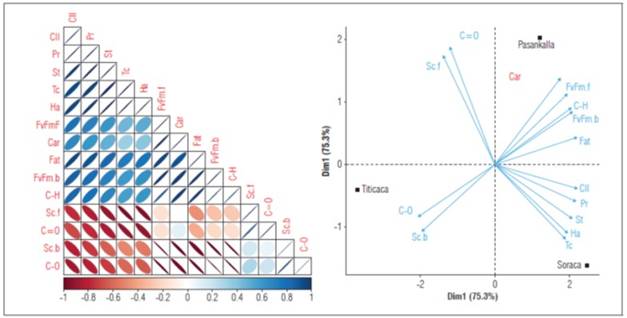
Figure 8. A: Spearman correlation analysis between quantitative variables. B: Principal component analysis of phenological, physiological, and compositional attributes of grains of Pasankalla, Titicaca and Soraca cultivars. Cll: cholorophyll content; Pr: protein total; St: stomatal density; Tc: harvest time; Ha: harvest; FvFm.f: maximum quantum efficiency of photossystem at flowering; Car: varbohydrates; FvFm.b: maximum quantum efficiency of photosystem at branching; C-H: FTIR, band 2,922 cm-1; Sc.f: stomatal conductance at flowering; C=O: FTIR, band 1,633 cm-1; Sc.b: stomatal conductance at branching; C-O: FTIR, band 1,016 cm-1. Cll: cholorophyll content; Pr: protein total; St: stomatal density; Tc: harvest time; Ha: harvest; FvFm.f: maximum quantum efficiency of photossystem at flowering; Car: varbohydrates; FvFm.b: maximum quantum efficiency of photosystem at branching; C-H: FTIR, band 2,922 cm-1; Sc.f: stomatal conductance at flowering; C=O: FTIR, band 1,633 cm-1; Sc.b: stomatal conductance at branching; C-O: FTIR, band 1,016 cm-1.
Although the Soraca cultivar exhibits longer phenological periods, it showed the best harvest yield per plant and the highest protein content in the seeds. This aspect may reflect the regrowth of leaf meristems after flowering, favoring the mobility of substances from sources to sinks, leading to increased plastid production and a higher carbon capture capacity due to the greater number of leaves (Taiz and Zeiger, 2010). In this context, the Pasankalla cultivar presented the highest quantum efficiency indices of photosystem II, which can be attributed to its efficiency in capturing the maximum amount of light energy (Eustis et al., 2020). The Titicaca cultivar exhibited the highest chlorophyll fluorescence, likely influenced by the change in its natural environment (from temperate to warm climate) (Mamedi et al., 2017).
CONCLUSIONS
'Titicaca' stood out for displaying the earliest phenotype, followed by 'Pasankalla', while 'Soraca' was the latest, taking 114, 130, and 172 d after sowing, respectively. Physiological performance showed a similar pattern in the quinoa cultivars. The Soraca cultivar had the highest production of seed compared to the other cultivars and showed the highest protein content.


