Spanish (pdf)
 Article in xml format
 Article references
 Send this article by e-mail
 Cited by SciELO
  Cited by Google
  Similars in
SciELO
Similars in
SciELO  Similars in Google
 Permalink
Introduction
How can institutions help college teachers to perform their best at teaching? We propose here that performance assessment is a viable alternative to contribute to teachers’ professional development. To help with performance assessment, we can use an instrument called the Teacher Behavior Checklist (TBC), which was adapted to Brazilian Portuguese by Henklain et al. (2020), showing good preliminary psychometric evidence of validity and reliability. To boost our confidence in using the TBC in applied contexts, we think it is essential to investigate further its psychometric properties considering to what degree the TBC can differentiate teachers’ quality. Hereafter we provide the rationale for these claims.
The question about how to improve college teachers’ performance is one we should answer adequately. Higher education is an essential asset because it is responsible for the qualification of new professionals needed by society. College teachers play a fundamental role in this process, so we should strive to enhance their performance. Since we know that learning is too complex to depend upon teachers alone, educational institutions should fulfill their responsibilities to favor excellent teaching performance. According to Gusso et al. (2020), these responsibilities include adequate work conditions (e.g., resources to teach, institutional support), systematic training to teach, and constant formative assessment. By formative assessment we mean a specific type of evaluation in which teachers’ actual behaviors are compared to the ones expected according to the educational institution’s standards, and this information is provided to the teacher in a way (e.g., with suggestions of training, tips of how to deal with some issue) to promote his/her professional performance (Cassettari, 2014; Gusso et al., 2020). This kind of assessment is contrasted with summative assessment, which evaluates the teacher’s performance for administrative decision making, like merit raises or promotion, and is not done explicitly for the purpose of improving the teacher’s performance.
In Brazil, formative assessment is a crucial problem because higher educational institutions usually implement federal law’s minimum standards, which guarantees only summative assessment (Missunaga et al., 2021; Piolli et al., 2015). Consequently, Brazilian teachers do not have institutional opportunities to evaluate and learn from their hits and misses while teaching. With the emergence of the COVID-19 pandemic and remote education, assessment has never been so relevant to teachers and educational managers, whose job comprises ensuring quality education (Gusso et al., 2020). Moreover, formative assessment is strategic to teaching progress because one learns better general skills in concrete settings when compared to training programs with simulated situations from which transfer to real word tasks could be weak (Cassettari, 2014; Schneider & Preckel, 2017). The question that arises now is what we should evaluate about teaching and what we recognize as excellent teaching.
We can start answering our question about excellence by defining this term. We argue that an “excellent teacher” is effective in creating the conditions for students to learn without the stimuli associated with education becoming aversive to them (Henklain et al., 2020). This type of learning may be interpreted as the improvement or acquisition of behaviors relevant to the learner and the surrounding society, which means that they increase the chances that learners will attenuate or solve problem situations that they face outside the classroom. This definition of an excellent teacher (that we will call from now on an effective teacher) helps clarify the core of the behavioral processes involved in teaching. Still, it does not describe how a teacher should be evaluated in the classroom on a day-to-day basis. We need an instrument that could clearly state the effective performance expected from teachers to enable their evaluation. But how can we discover what tends to be effective performance?
According to Buskist, Sikorski, Buckley, and Saville (2002), several methods could inform us about teachers’ performance in the classroom and help develop instruments to assess teachers’ effectiveness. One can interview teachers recognized as effective (e.g., winners of teaching awards), observe how these teachers teach in their classrooms, search the literature for descriptions of how the effective teacher works, and so on. Among other possibilities, one can also ask students what they believe the teacher does - their concrete behaviors - in the classroom to promote their learning and engagement. This last strategy is innovative for two main reasons: it is data-driven instead of theory-driven, and it is oriented by the student who is the one directly receiving the impact of what teachers do inside the classroom. The TBC was created based on students' descriptions of excellent teachers' qualities and corresponding behaviors.
The TBC, therefore, is an instrument that incorporates students’ perceptions. It was created in the United States to describe how an effective teacher behaves in the classroom (Buskist et al., 2002), and includes 28 items that describe teaching qualities accompanied by examples of behaviors that help to operationalize these qualities. By operationalizing such qualities as “creative and interesting”, “accessible and available”, “promoting critical thinking”, and so on, the TBC assists in the definition of objectives for teacher training and criteria for their formative assessment. Also, as pointed out by Buskist and Keeley (2018), the research with the TBC in different countries allows for identifying universal principles of effective teaching that could guide teachers’ evaluation and training worldwide. Despite being an innovative educational tool, it is important to determine if the TBC has adequate psychometric properties to be used by students in practice.
Keeley, Smith, and Buskist (2006) presented evidence that the TBC, rated on a Likert frequency scale (“1 = never exhibits”; “5 = always exhibits”), is a useful resource for student evaluations of teaching. They conducted two studies with undergraduates. In Study 1, using Exploratory Factor Analysis (EFA), they identified two factors, Caring and Supportive (13 items) and Professional Competence and Communication Skills (11 items), whose correlation was 0.73, explaining 53% of the variance. Four items (5, 9, 16, and 17) did not load on either of the two factors, but they were not excluded from the total scale based on evidence of content validity obtained in previous studies. Cronbach’s alpha was above 0.90 for each subscale. In Study 2, the researchers found an adequate test-retest reliability (r = 0.71; p < 0.01). A Confirmatory Factor Analysis (CFA) assessed the fit of three factorial solutions, including the two-factor model of Study 1, a single factor solution, and a second order model that included two subscales and a higher order total scale. All of the factorial solutions produced adequate fit with a theoretical advantage for the two-factor model since several studies (e.g., Buskist et al., 2002; Costinet al., 1971) suggested that teaching assessment could be summarized across two dimensions: a) pedagogy, and b) the teacher-student relationship. Nonetheless, they elected to advocate using a hybrid model as the most heuristic, because it incorporated meaningful aspects of both the one and two-factor solutions.
In subsequent research, Keeley, Furr, and Buskist (2010) investigated whether undergraduates could identify different degrees of teacher performance with the TBC, which counts as evidence of construct validity (Ambiel & Carvalho, 2017; Cunha et al., 2015). Students from two universities (n = 326) were asked to respond to the TBC three times to evaluate the best and worst teacher they ever had, and finally, the teacher with whom they most recently attended classes (different from the previous teachers selected). The researchers did not provide the participants with formal definitions of what constitutes “the best” and “the worst” teacher. Each student decided subjectively what “best” and “worst” meant to them. The researchers expected that there would be a statistically significant difference among the scores of these three types of teachers showing that the best teachers had more positive results than the worst ones. The results from both universities confirmed the researchers’ expectations.
Based on the three TBC investigations described above, the studies with this instrument spread worldwide in such different countries as Colombia, Estonia, Germany, Russia, Saudi Arabia, China, and Japan (Buskist & Keeley, 2018). In all these countries, the TBC 28 qualities gathered content validity evidence through teachers’ and students’ opinions. These results opened an exciting possibility of conducting studies to compare data across countries. Comparing data is essential for teachers who want to teach abroad or work with students who recently immigrated from other countries. Simultaneously, the TBC’s success established it as an excellent reference for teachers’ performance assessment which turns it into a good option to help Brazilian college teachers.
In Brazil, evidence has already been documented that according to both Brazilian college students and teachers, TBC items accurately describe effective teaching practices (Henklain et al., 2018a). Therefore, the TBC may help to enhance Brazilian teachers’ performance assessment conducted by higher education institutions. Considering this background, Henklain et al. (2020) created a cross-cultural adaptation of the TBC so that Brazilian undergraduates could evaluate their teachers’ performance in the classroom (Keeley et al., 2006). In Study 1, the researchers described the stages of the adaptation process. The content and semantic validity evidence gathered were adequate. By the end of this process, the original TBC structure with 28 items was maintained.
In Study 2, Henklain et al. (2020), based on data from 714 undergraduates attending a Brazilian public university, obtained evidence of the validity of the internal structure through an EFA. They proposed a two-factor model for the adapted version of the TBC, which explained 49% of the variance, similar to that found in the original version (see Keeley et al., 2006). The two factors were named, respectively, Relational Behaviors and Pedagogical Behaviors. The Relational Behaviors factor comprises items concerning how teachers interact with students (e.g., accessible, friendly) which impacts student engagement and creates a safe environment suitable for learning. The Pedagocial Behaviors factor refers to teachers’ expertise in skills related to promoting student learning (e.g., effective communicator, knowledgeable about subject matter). Good evidence of reliability was also obtained: McDonald’s Omega was 0.94 and test-retest reliability was strong (r s = 0.748, p (one-tailed) < 0.01, N = 229). This study’s main caveats were the data collection in only one Brazilian state, the need for a Confirmatory Factor Analysis (CFA) of the TBC factorial model proposed, and the absence of psychometric evidence that the Brazilian version of the TBC could be used to differentiate the teacher’s degree of quality, as Keeley et al. (2010) did.
Based on these gaps in Brazilian TBC research, we decided to conduct a study with samples of Brazilian undergraduates from three states, whose objectives were to: a) investigate additional evidence of construct validity of the TBC employing a CFA; b) evaluate its ability to identify teachers’ performance across different levels of quality defined subjectively by the participants; and c) investigate additional evidence of reliability. This kind of study is essential to make it possible to use the TBC in applied contexts. It is also relevant to researchers because it stimulates the debate about universal teaching principles (Buskist & Keeley, 2018). Based on the previously described studies, our hypotheses were as follows: a) The fit indexes obtained by the CFA will be adequate and will confirm the viability of maintaining two separated factors for the adapted version of the TBC; b) The worst teachers will have lower scores on the TBC than regular teachers and regular teachers will exhibit lower scores than the best teachers; and (c) We also expect adequate reliability for the TBC.
Method
We adopted a cross-sectional design using the TBC in a paper-and-pencil format which was answered by college students from three different Brazilian states, mainly from public universities and Psychology majors. Our sample was defined by convenience, but we achieved a balanced quantity of participants in each Brazilian state.
Participants
We had 676 undergraduate students enrolled in our study, 440 women and 236 men, mean age of 23.3 (SD = 6.4); 531 students declared belonging to the middle class, 110 to the lower class, 29 to the upper class, and six did not respond this question. Most of the sample, 93.9%, was enrolled for the first time in higher education (n = 635), 30 had already finished the first undergraduate course, and 11 were studying or had already completed a postgraduate degree. Two hundred and thirty-five participants were from the state of São Paulo (all from a public university); 236 were from Paraná (222 from a public university, and 14 from another public university in another city of the state); 205 from Roraima (121 from a public university, 66 from a private university and 18 from another private university, all of them from the states’ capital). Most of the sample was composed of Psychology students (n = 364, 53.8% of the sample). Students of Engineering courses (civil, electrical, mechanical, and chemical) accounted for 9.5% of the sample (n = 64), Agronomy 9% (n = 61), Special Education 8.1% (n = 55) and Others 19.4% (n = 132).
All procedures performed in our study were in accordance with the ethical standards of the institutional and national research committee and with the 1964 Helsinki declaration and its later amendments or comparable ethical standards. This study was approved by the Human Research Ethics Committee of the Federal University of Roraima (CAAE number 54448416.6.0000.5302).
Instruments
The research protocol consisted of two measures. A) The TBC adapted by Henklain et al. (2020) was used by undergraduates to assess teachers’ effectiveness. The TBC consists of 28 items about teachers’ qualities - e.g., “13. Humble (Admits errors; does not brag; and does not take credit for others’ successes)” - rated on a frequency Likert scale, “1 = never exhibit” to “5 = always exhibit”. In our study we prepared three TBC protocols: 1) the blue one, with the instruction to evaluate the best college teacher one had; 2) the red one, asking participants to evaluate the worst college teacher they had; 3) the white one, asking an evaluation of any regular college teacher that the student had. B) Participants also completed a demographic questionnaire with items about gender, age, social class status, home state in Brazil, type of university (private or public), experience with higher education, and undergraduate course.
Procedure
Data collection took place in two private universities and one public university in the state of Roraima, in two public universities in the state of Paraná and a public university in the state of São Paulo. The researcher contacted college teachers of these institutions and requested 40 minutes of their classes’ time to conduct the study. Only undergraduates with at least six months in the university could enroll in our study to ensure that the participants had experience with college teachers. Upon arriving at the room, the researcher explained the research objectives to the students, and they had to provide informed consent before they could participate. Students who did not want to participate could stay inside the classroom reading or wait outside. The teacher did not stay in the classroom during data collection.
Our participants received one of three possible versions of the TBC with different instructions and color. The first, printed on blue paper, asked the participants to rate the best teacher they ever had according to their opinion; the second, printed on red paper, asked them to rate the worst teacher; and the third, printed on white paper, asked students to rate a regular teacher. Participants were randomly assigned to answer one of the three tasks. Each participant answered just one version of the TBC, which differed from Keeley et al. (2010) procedure in which each participant answered the TBC three times. We did not define what “best”, “worst” and “regular” meant to guide students’ evaluations. They were free to define these terms based on their own experience.
Data analysis
At the end of the data collection and tabulation, data entry reliability was tested as follows: 145 protocols were drawn for verification (which represented approximately 20% of the total data collected). Since no errors were identified, we started the data analysis using the R Studio software based on R version 3.4.1 (R Development Core Team, 2017).
A Shapiro-Wilk test indicated that the TBC ratings did not have a normal distribution, with skewness of -0.194 (SE = 0.094), which gives us a statistically significant z-score of 2.06 (Field, 2009). The skewness indicated that the participants tended to provide high ratings to teachers, which is typical of this instrument (Keeley et al., 2013). Because of the skewed data and the ordinal nature of students’ ratings, we decided to adopt non-parametric tests. Before starting the analysis, we also verified that TBC scores did not vary by state (H(2) = 1.2159, p = 0.54). The following steps describe how we analyzed the data according to the study objectives.
Evidence of internal structure validity. A CFA was conducted to assess if the two-factor model proposed by Henklain et al. (2020) would exhibit adequate fit indexes considering data obtained with samples of different Brazilian states. We compared it with the one-factor model and higher order model (two factors joined by a higher order single factor) assessed by Keeley et al. (2006), and a bifactor model with the two factors suggested by Henklain et al. (2020) and a general factor directly related to the items. The CFA was performed based on the Weighted Least Squares Mean and Variance-adjusted (WLSMV) estimation method. The criteria that we adopted to evaluate the model were based on Hair et al. (2006). We select seven fit indexes: χ²/df (expected result: 2 < X < 5); GFI (expected result: >= 0.9); AGFI (expected result: >= 0.9); SRMR (expected result: < |0.08|); RMSEA (expected result: < 0.1); CFI (expected result: >= 0.95); TLI (expected result: >= 0.95).
Our next step was to evaluate whether there is a difference among teachers’ effectiveness (worse, regular, and best) based on TBC scores using the Kruskal-Wallis test (alpha < 0.05) for independent samples followed by the Mann-Whitney test in case we found differences between each group. We applied the Bonferroni correction to address the number of tests conducted.
Additional reliability evidence. We investigated the reliability of the TBC using Cronbach’s alpha and McDonald’s Omega for the total scale score and for its two subscales. We adopted values ≥ 0.8 as indicators of good reliability.
Results
Evidence of internal structure validity
Table 1 shows, in the third, fourth, fifth, and sixth columns, the comparison of the Confirmatory Factor Analysis (CFA) results for all the models we tested.
As noted in Table 1, the two-factor model provided better fit indexes than the one-factor model. As Hair et al. (2006) explained, the statistically significant p-value in the chi-square test does not have to be considered a problem, but the fact that the ratio χ²/df had a value above the appropriate level - between two and five is the expected, and the result was 5.6 - could be an indicator that the two-factor model is not adequate to fit the data. Nevertheless, only this index was unfavorable. In comparison, the bifactor model provided favorable fit indices for all metrics (see Appendix 1 for the CFA performed for the bi-factor model), while the higher order model exhibited good fit indexes excluding the χ²/df ratio (see Appendix 2 for the CFA performed for the higher order model). Because the models are not fully nested, it is not possible to conduct a direct statistical test to determine if the second order models provide a superior fit to the two-factor model. We should stress that the bifactor model’s fit appears to be stronger than that of the two-factor model on every index. To further investigate the models, we used the Dueber (2017) bifactor indices calculator, where we found an Omega Hierarchical of 0.916 for the general factor and an Explained Common Variance (ECV) of 0.815, both suggesting a unidimensional structure.
Table 1 Comparison of the CFA results from one, two-factor, higher order and bifactor models.
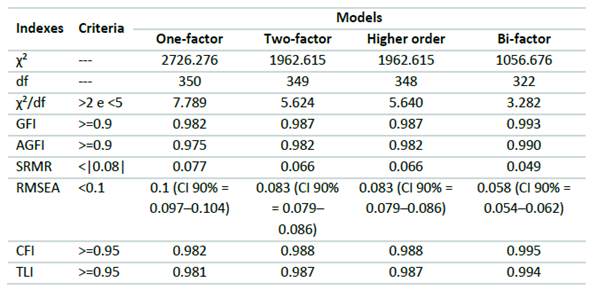
Note: Criteria: this column shows which criteria one should use to interpret the indexes; χ²: chi-square raw statistic; df: degrees of freedom; CI: Confidence interval.
Given these indices in favor of the one factor solution, we used Factor software (version 10.5.03, Ferrando & Lorenzo-Seva, 2017) to perform the closeness to unidimensionality assessment, which is based on the idea that some instruments have better fit indices with multi-factor solutions or second order ones, while these factors are not well defined or hard to reproduce (Damásio & Dutra, 2017). Since Henklain et al. (2020) did not find the same relationship between factors and items as was proposed by Keeley et al. (2006), maybe this difficulty to reproduce the factors is the case with the TBC. Within this analysis, besides the ECV above 0.85, one should evaluate if the Unidimensional Congruence (UniCo) is above 0.95, and the Mean of item Residual Absolute Loadings (MIREAL) is below 0.3. For the TBC we found a UniCo of 0.963 (95% CI 0.956-0.977), a MIREAL of 0.220 (95% CI 0.198-0.234), and a slightly different ECV - when compared to the one calculated in the Dueber (2017) spreadsheet - of 0.879 (95% CI 0.866-0.899). All of them are suggesting that a one-factor solution would be a good fit to the TBC.
We did not find a strong statistical case to select one model over the other and, most important, no good theoretical reason to support the higher order or the bifactor model over the simpler models of one and two factors. In fact, as pointed out by Henklain, Carmo, and Haydu (2018b), it is difficult to justify a separation of teachers’ qualities and behaviors in two different categories, since all of their behaviors are related to students’ learning and engagement and constitute what we expect by a professional teacher working at an educational institution. So, we decided to further investigate the one-factor model since it showed good fit indices and would be a simple factorial structure to work with the TBC - especially in comparison studies across different countries - and the two-factor solution just because it showed good fit indices and has been the most studied model in the TBC literature (e.g., Henklain et al., 2020; Keeley et al., 2006).
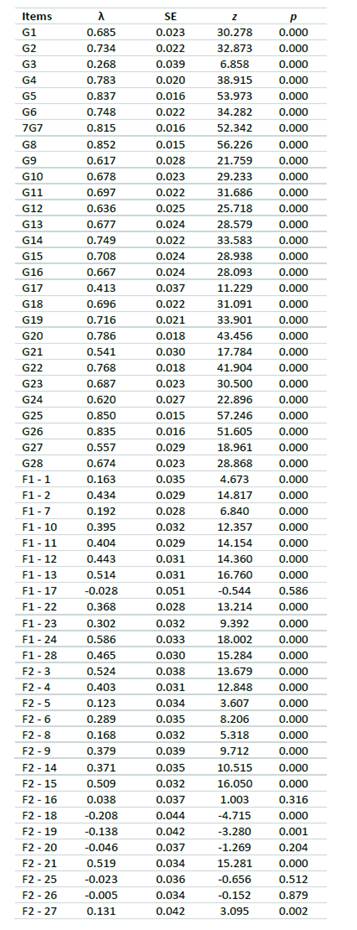
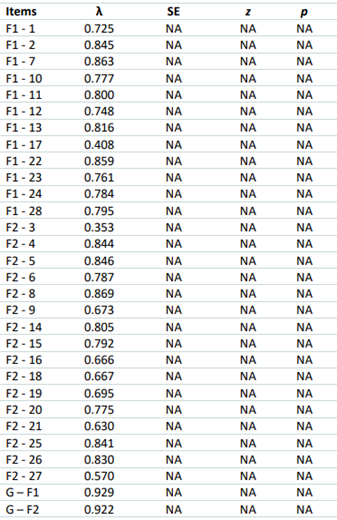
Table 2 Results of the CFA performed for the two-factor model.

Note: λ: Lambda; SE: Standard-error; z: z-score; p: p-value; *: < 0.001.
Table 2 shows the lambda values, standard errors, z-scores, and p-values for the 28 TBC items organized into one and two factors. All lambdas were statistically different from zero (λ ≠ 0, z > 1.96, p < 0.001) in both factorial models, varying between 0.335 (Item 3) to 0.844 (Item 8) in the one-factor model, and 0.353 (Item 3) to 0.869 (Item 8) in the two-factor model. We found that the correlation between the scores of the two factors was r s = 0.8067 (R 2 = 0.65, p < 0.01, N = 676), indicating considerable overlap between what the two factors are measuring.
Reliability evidence
The total Cronbach’s alpha of the TBC was 0.96, while it was 0.93 for each subscale, that is, Relational Behaviors (Factor 1) and Pedagogical Behaviors (Factor 2). Item exclusion did not result in alpha improvement. However, in the second subscale, the exclusion of Item 3 would lead to an improvement of the alpha from 0.93 to 0.94. The Omega for the total scale was 0.97, for Factor 1 was 0.95, and for Factor 2 was 0.91.
Evidence of Internal Structure Validity
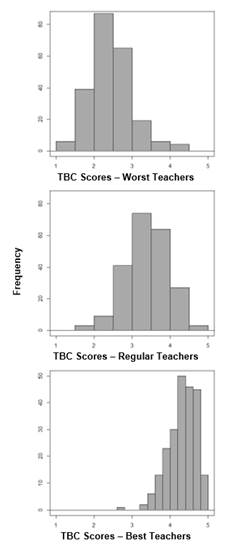
To begin the examination of whether the TBC can be used to differentiate among teachers’ performance, see Figure 1 which shows, respectively, the participants’ assessment of their worst, regular, and best teachers.
The data of the worst teachers are characterized by a positive skew, whereas a negative skew characterizes the data of the best teachers. That is, these distributions are approximately opposite. The distribution of regular teachers obtained reflects a near normal distribution without any specific skew. When inspecting Figure 1, the small occurrence of very low scores is evident, even among the worst teachers.
The Kruskal-Wallis test showed, for the TBC total score of each professor - worst, regular, and best -, a statistically significant difference among these three groups (H(2) = 477.79, p < 0.01). To clarify which groups were different, we used the Mann-Whitney test with a Bonferroni correction (p-values should be smaller than 0.016 to be statistically significant). Worse teachers (M = 2.46, SD = 0.53, n = 226) had lower scores than regular teachers (M = 3.41, SD = 0.56, n = 221; U = 5440, p < 0.001, n = 447, r = -0.677). Best teachers (M = 4.31, SD = 0.36, n = 229) had scores higher than regular teachers (U = 4599.5, p < 0.001, n = 450, r = -0.71). Finally, best teachers were also higher than worst teachers (U = 506, p < 0.001, n = 455, r = -0.848). The same pattern was observed when we conducted this analysis separately with the data of each subscale, Relational Behavior (H(2) = 419.1, p < 0.001) and Pedagogical Behavior (H(2) = 443.73, p < 0.001).
Discussion
Our general objectives were to investigate additional evidence of internal structural validity and of reliability of the TBC, and the main goal was to test if the TBC could identify teachers with different levels of teaching efficacy. We hypothesized that the fit indexes obtained by a CFA would be adequate and confirm the viability of retaining two separate factors for the adapted version of the TBC, and that the worst teachers would have lower scores in the TBC than regular teachers, while regular teachers would exhibit lower scores than the best teachers. Finally, we expected to find adequate reliability for the TBC.
Considering the evidence gathered, we found additional support for the use of the TBC in Brazilian applied contexts. The TBC seemed capable of identifying teachers with different levels of performance in teaching, which supports the earlier findings of Keeley et al. (2010). Worse teachers received lower scores than the best teachers and the regular teachers scored between the worst and the best teachers. Again, this was similar to previous findings (see Keeley et al., 2010). We highlight that in all three cases, most of the scores were high. These findings suggest a tendency of students to provide more positive than negative assessments of teachers (Keeley et al., 2013), which seems to contradict the common idea that students try to punish their teachers by giving them low assessment scores when they do not like them (Costin et al., 1971).
The difference found in the scores obtained by the three groups of teachers was confirmed through statistical tests. We emphasize that, besides the statistical significance, the effect sizes among the differences across the three types of teachers were high, with correlations varying from -0.677 to -0.848. This finding supports the assertion that the TBC can be used as an instrument to assist in the identification of different levels of teacher performance. According to Cunha, Almeida-Neto, and Stackfleth (2015), this evidence can be interpreted as a type of construct validity because we compared three groups whose expected results were known (best teachers should exhibit higher scores than the regular teachers who should exhibit higher scores than the worst teachers) and our findings confirmed these expectations. This finding indicated that TBC measured the construct as theoretically predicted according to Keeley et al. (2006) and Henklain et al. (2020).
The manipulation (i.e., asking the participant to think, for example, about the worst teacher he or she had) intentionally created bias or a direction of responses that could artificially favor the confirmation of our hyphothesis. However, we did not ask the student to imagine a teacher who is, according to his or her criteria, the worst, but requested students to evaluate a real teacher that he/she had and whom he/she considered the worst one. It is also worth noting that even with this manipulation we did not find participants that attributed only negative assessments in all items of the TBC for their worst teachers or who evaluated the best teachers only with positive evaluations in all the items. That is, our data seems to reflect how students really evaluate their best and worst teachers. Despite the defensible reasons for our study design, we think that future research could benefit from a within-subjects design because it would be better suited to capture the individual variance in assessing teachers, making it clearer to what degree the TBC is helpful in differentiating teachers’ performance. We also suggest that future research gather data about the criteria adopted by students to classify a teacher as worst, best, or regular.
Besides this important evidence of validity, we also found an excellent internal reliability for the TBC, with alpha and omega beyond 0.9 for the total scale and each factor (see Hair et al., 2006). Considering our CFA results, the evidence supported one-factor, two-factor, and second-order models. That is, maintaining one general scale and separate subscales for relational and pedagogical behaviors were a good fit to the data of this study with participants from three Brazilian states (Roraima, Paraná, and São Paulo). This finding is compatible with the EFA results of Henklain et al. (2020), which involved participants from only one Brazilian state, and with Keeley et al. (2006). Since the Brazilian TBC two-factor structure (see Henklain et al., 2020) is not the same as the one found by Keeley et al. (2006), researchers in Brazil would benefit from using the one-factor solution because it would allow investigations about common aspects in the use of the TBC by participants from Brazil and the United States, thus facilitating comparison between these countries and sharing knowledge about good teaching practice. Besides this advantage, it is simpler to analyze and interpret data obtained with the TBC when adopting a one factor model.
Nonetheless, for practical reasons, when using the TBC in applied contexts, we recommend considering separate subscales for relational and pedagogical behaviors for more specific insights about teachers’ performance, while also calculating a higher-order total “good teaching” scale that incorporates all 28 TBC items, consistent with the second order model. When comparing the higher-order and bifactor models, the bifactor model evidenced superior fit. However, to identify the practical difference between the higher-order and bifactor models we need additional research. In one sense, the bifactor is like creating an additional error term (factor G) that soaks up any remaining variance from the other factors. In other words, it is a representation of remaining shared variance in TBC ratings beyond that already accounted for by the two factors, possibly representing “good teaching” that cannot be easily categorized as relational or pedagogical behaviors. Conceptually, this is very similar to the hierarchical model which is mathematically equivalent to drawing a correlation between the factors in a two-factor model. Both models indicate that single and two factor solutions offer simultaneous utility. It will be required additional investigations if the bifactor approach represents a conceptually rather than only mathematically superior way of capturing TBC variance. Overall, we think that more research is necessary about the TBC factorial structure in Brazil and worldwide.
Despite the need for additional work, we believe the TBC can offer a practical solution for evaluating teaching quality in Brazil. It appears capable of differentiating teacher quality, which thereby implies that institutions of higher education could use the measure to identify teachers who would benefit from improving their skills. The TBC offers the added benefit of including a direct way of improving one’s skills by implementing the behaviors indicated within any items which are rated lower. Additionally, by examining the two subscales of the TBC, teachers could identify if they need to focus their improvement on pedagogical behaviors like speaking more clearly or increasing their familiarity with available technology versus relational behaviors like speaking with students before class or inserting humor into their lectures. The formative assessment of teachers might offer help to various challenges faced by higher education, including the movement to be more student-focused and include greater student voice in the way the university operates.
Based on the limitations of this study, described above, we suggest some precautions while planning future TBC studies: 1) Conduct test-retest evaluations of the three types of teachers to investigate a stronger reliability index compared to Cronbach’s alpha or Omega. It is crucial that these reapplications involve no more than a 7-8 week gap (according to Keeley et al., 2010) after the first data collection to reduce the effect of extraneous variables on the assessment behavior. 2) Conduct TBC studies using more extensive, more diversified, and more balanced samples (between courses and gender of the participants, for example). It would be important to collect data with representative samples of the university population, and with minority groups to better analyze the adequacy of the TBC with these specific populations. 3) It was not possible to say for the moment that the absence of a difference in how to respond to the TBC according to the participant’s state in Brazil applies to other samples of these same or different Brazilian states. Specific studies to investigate the invariance of the TBC with different student characteristics are still required in Brazil and worldwide. 4) Future studies should test different factorial models with greater and diverse Brazilian samples to make a stronger case in favor of a specific model.
We conclude that the Brazilian version of the TBC can contribute to evaluate teachers’ performance. The TBC, therefore, seems promising as a resource to help in the training of teachers and in the formative assessment of these professionals in Brazil.