


 English (pdf)
 Article in xml format
 Article references
 Send this article by e-mail
 Cited by SciELO
  Cited by Google
  Similars in
SciELO
Similars in
SciELO  Similars in Google
 Permalink
INTRODUCTION
Carica papaya L. belongs to the Caricaceae family and it is native to the Caribbean coast of Mesoamerica (Cáez et al., 2018). It is distributed up to 32° South and North latitude and extends to many tropical and subtropical regions of the world (Kim et al., 2002). It thrives in cleared jungle forests and sites near the sea, between 0-1500 m. asl and temperatures between 21 and 33°C (Stevens et al., 2001). It is sensitive to temperatures below 15°C, which stops fruit production (Allan, 2002).
In 2020, the FAO documented global production for 2019 at 13.73 Mt, with the principal producers susch as India, the Dominican Republic, Brazil, Mexico, Indonesia, and Nigeria. Colombia was ranked thirteenth with 144,963 t in 6,861 ha (FAO, 2020). In the last ten years, there has been a 30% increase in global papaya production, which has led to plantation areas expanding by 37% (FAO, 2020).
Worldwide, breeding programs are directed toward developing hybrids, inserting genes of interest, molecular selection, and micropropagation (Mora & Bogantes, 2005; An et al., 2020; Botini et al., 2021). However, these approaches do not consider interactions between dynamic environmental conditions and plants' highly plastic physiological responses (Tardieu, 2012). It is necessary to include plant physiology in plant breeding programs, which elucidates the processes that determine yield, responses to environmental variations, and morphological adaptations, among others, to expand the genetic base and select superior individuals (Catarina et al., 2020).
Different breeding programs have used this criterion for species such as wheat, oil palm, corn, sunflower, and rice (Massignam et al., 2009; Reynolds et al., 2013). The Centro Internacional de Mejoramiento de Maíz y Trigo (CIMMYT) selected cereal species based on adaptation to abiotic stress; concerning to this, Reynolds et al. (2007) identified wheat germplasm with a great potential to tolerate drought conditions to increased water extraction from depth in the soil, accumulation of soluble carbohydrates in the stem, and water use efficiency (WUE). For soybean, Sinclair et al. (2000) supported physiological improvement and identified eight lines that expressed a high capacity for symbiotic nitrogen fixation under drought conditions. There is support for using plant physiology in breeding programs since it elucidates the influence of environmental factors on physiological processes that may limit the yield of genotypes (Jackson et al., 1996). Liu et al. (2023) evaluated the effect of temperature on pollen germination rates in four mango accessions, with optimum temperatures between 20 and 34°C. Castillo et al. (2022) evaluating different ecotypes of Persea americana found a positive correlation between the size of the xylem and the vascular wilt disease caused by the fungus Raffaelea lauricola.
In 1975, the Universidad Nacional de Colombia, Medellín campus, began the papaya breeding program, obtaining the dioecious variety - UN Cotové (with a percentage of 36% male plants and 64% female plants) from crosses between a local Creole variety (adapted to TDF) with low-quality fruits, one with a Cuban origin and the cv. Cariflora from Florida (A ring spot tolerant) (Reyes, 1996). The result was a low-sized plant with good yield, excellent organoleptic fruit characteristics, and high tolerance to virosis (Reyes, 1996; Gil & Miranda, 2005). However, the variety purity was lost due to the lack of continuity in the breeding program to maintain the reception by growers (Reyes, 1996).
Therefore, the objective of the current study was to use physiological indicators for selecting outstanding individuals from the papaya variety UN Cotové under TDF conditions to use as parent material to obtain a new, local variety.
MATERIAL AND METHODS
Location. This study was carried out at the Cotové Agricultural Station (AS) of the Universidad Nacional de Colombia, Medellín, in El Espinal village, Santa Fe de Antioquia, Colombia. The Cotové AS is located at 6°3'57’’N and 75°49'40'W, at 507 m. asl. In the study period, from the transplant of plants in the field (May, 2018) to the harvest time (November, 2018), an average temperature of 27°C was recorded, with a maximum of 42.5°C and a minimum of 16.8°C; the average relative humidity was 71%, and the average rainfall was 815 mm placing Cotové AS in the tropical dry forests (TDF) according to the Holdridge (1978) classification. Gravity irrigation was carried out, which guaranteed a volumetric humidity (VH) of more than 20%, Mahouachi et al. (2006), which was monitored with a TDR - Delta T-Device Ltd.®, Cambridge, England).
The soil was Inceptisol with a clay texture, a pH of 6.7, and concentrations of N (56 mg kg-1), P (36 mg kg-1), B (1.3 mg kg-1), K (0.44 cmol kg-1), Ca (20.4 cmol kg-1), and Mg (9.6 cmol kg-1). These levels were high, according to the physicochemical analysis of the soils. At sowing, 2 kg of organic matter (chicken manure) and 120 g of a mixture of 25 kg of CO (NH2), 25 kg of KCL, and 500 g of H3BO3 were added per plant.
Management of the experiment. An observational, descriptive, and longitudinal analysis (OA) was carried out, the objective being "observation and recording" of events without intervening in their natural course over time (Manterola & Zavando, 2009). The UN Cotové papaya variety was used. Sowing was done at a distance of 2.5m between plants and 3.0m between rows distributed in a triangle (1,333 plants ha-1). The experiment unit consisted of 18 plants randomly selected within the nine central rows.
Thermal time. The heat sum method was used to consider the effect of temperature on plant growth and development as accumulated growing degree days (GDD). Riaño et al. (2005) suggested the simple sine method between the appropriate physiological temperature thresholds (lower limit Ll and upper limit Ul) because a symmetric daily temperature behavior is assumed for the maximum temperature with equal minimum temperatures typical of tropical conditions. For papaya, these limits are 15 to 32°C, respectively (Allan, 2002), Equation 1.

Where: Ui = Upper limit, Li = Lower limit; Tmax = Maximum temperature; Tmin = minimum temperature, and α = (Tmax - Tmin) / 2.
Gas exchange. A portable infrared gas analyzer (LCi Portable Photosynthesis System - ADC BioScientific Ltd®, Herts, England) was used to determine gas exchange variables: Net photosynthesis (A, μmol CO2 m-2s-1), transpiration rate (E, mmol H2O m-2s-1), stomatal conductance (gs, mmol H2O m-2s-1), photosynthetically active radiation (PAR, μmol photons m-2s-1), and leaf temperature (Tl,°C). A total of four measurements were made in June, August, September, October, and November of 2018. Each month, on the last fully developed leaf of each of the 18 plants, readings were taken hourly between 06:00 a.m. and 06:00 p.m.
Based on the hourly records obtained (A, E, gs, and PAR), the daily integral was estimated for each of these variables according to the methodology proposed by Córdoba et al. (2018). Likewise, the water use efficiency (WUE) was calculated with the A/E ratio (μmol CO2 m-2s-1/mmol H2O m-2s-1), along with the radiation use efficiency (RUE), for the A/PAR (μmol CO2 m-2s-1/μmol photons m-2s-1).
Leaf Area Index. The leaf area index (LAI) was estimated monthly based on the relationship between the leaf surface of the plant and the total surface of the soil occupied by the plant (m2 of leaf/m2 of soil). The LAI records were taken in the lower stratum of the plant, under the frond (leak), in the four cardinal points, with a frond analyzer (Sunscan Canopy Analyzer System - Delta T-Device Ltd.®, Cambridge, England).
Quantum yield of PSII (Qy). As done with the gas exchange measurements, the maximum photosynthetic quantum efficiency Qy = (Fv/Fm) was determined. For this, a chlorofluorometer (Modulated Chlorophyll Fluorometer OS1p - Opti-Sciences, Inc.®, Hudson, USA) was used. Measurements were taken after 9:00 p.m. to ensure that the photosystems were in their lowest energy state (Chukhutsina et al., 2020).
Statistical analyses. An exploratory analysis was made with the Pearson correlation matrix to determine possible relationships between the variables. Likewise, a non-hierarchical cluster analysis (K-means) was carried out in the multivariate structure to determine possible groupings of the variables with similar ecophysiological behaviors. For this analysis, the variables included were: the daily integral of photosynthesis - Ai (μmol (CO2) m-2 day-1), the daily integral of transpiration - Ei (mmol (H2O) m-2 day-1), the daily integral of stomatal conductance - gsi (mmol (H2O) m-2 day-1), the daily integral of PAR (μmol (Photons) m-2 day-1), WUE, RUE, IAF, and Qy.
The clustering trend and the appropriate number of clusters were determined with Hopkins and Gap statistics, respectively. A one-way analysis of variance was performed to identify plants with outstanding characteristics. For specific differences within the genotype (18 individuals) and between sampling seasons (5 seasons), Post-hoc comparisons between treatments were made using Tukey's HSD test (Honestly significant difference, P < 0.05%). All processes were executed with the support of R Studio statistical software (R - Development Core Team, 2021).
RESULTS AND DISCUSION
Pearson correlation.Figure 1 shows that the highest correlations occurred between photosynthesis (Ai) and stomatal conductance (gsi) with 0.81. The Ai/Ei correlation of 0.68 confirmed that stomata opening is essential for CO2 fixation and H2O delivery to the atmosphere. Evaluating the correlations between the growth parameters and the mathematical relationships between them can be very useful in establishing growth models and predictions for papaya cultivation (Olubode et al., 2016). In this sense, Jeyakumar et al. (2007) stated that open stomata and a high transpiration rate are generally associated with greater photosynthesis, which is important for the production of carbohydrates. High Ai-WUE (0.77) and Ai-RUE (0.94) correlations were observed. The association between these variables is relevant in the tropics, a high solar radiation can cause leaf heating, increase vapor pressure deficit between the leaf surface and the surrounding air, which promotes stomatal closure (Grossiord et al., 2020). These conditions reduce the entry of CO2 into the foliar mesophyll; consequently, the concentration of CO2 in the carboxylation sites of Rubisco is decreased (Silva et al., 2019). The WUE-GDD (-0.60) correlation was inverse because E increased as GDD passed at a greater rate than the increase in photosynthetic activity, which decreased the WUE. The heat and water use efficiency had a positive coupling effect on yield. Improving this efficiency through precise management of temperature, light, and water resources during the flowering and fruit development stage may promote efficient production and high yields under climate change (Wu et al., 2023).

Figure 1 Pearson correlation matrix for the variables in UN Cotové papaya plants in the tropical dry forest.
On the other hand, a relationship of 0.83 was observed between gsi and RUE, which proved the high influence of light on stomatal opening (Silva et al., 2019), while for the quantum yield of PSII (Qy), there was a low correlation with all variables. Similar behavior was observed by Ruas et al. (2022) in different papaya genotypes. Vincent et al. (2015), when evaluating the acclimatization potential of the Red Lady papaya variety, found that water stress caused a slight decrease in the size of the antennae in the FSII reaction center and increased the rate of electron transport, which favored quantum yield.
Clustering. A cluster analysis was carried out to determine whether the plants separated into groups with similar behavior, as proposed by Banerjee & Dave (2004). The data non-uniformity was verified (Hopkins statistic of 0.25), why it was decided to separate the groups according to Qiu & Cao (2016). When the Hopkins statistic is close to 0.5, data will be more uniform, which indicates that they are evenly distributed and discourages the use of the cluster method.
The K-means algorithm created two groups (Na et al., 2010). Group B consisted of plants with the higher average values for all variables evaluated at different times. Group A included the plants with lower values (Table 1), except for IAF, where group A presented a weight of 0.78 and group B had 0.80.
This separation was due more to the magnitude of the values recorded for the gas exchange variables as a function of plant age than to the individuals' physiological characteristics that could be of interest when selecting groups of plants in the papaya breeding program.
Table 1 Average values of the two clusters for the variables in UN Cotové papaya plants in the tropical dry forest.
| Cluster | Ai | Ei | g si | WUE | RUE | Qy | IAF |
|---|---|---|---|---|---|---|---|
| A | 225551.74 | 233406.89 | 7313.62 | 1.03 | 0.01 | 0.72 | 0.78 |
| B | 529611.91 | 335509.95 | 16368.84 | 1.60 | 0.01 | 0.52 | 0.80 |
*Daily integral of photosynthesis (Ai), transpiration (Ei), and stomatal conductance (gsi); WUE: Water use efficiency; RUE: Radiation use efficiency: LAI: the leaf area index; Qy: Quantum yield of PSII.
Table 2 shows the distribution of the two clusters formed based on the five measurements. Cluster A formed by 47 observations and Cluster B by 42. Each measurement had no evident separation of groups by individuals that would allow an inference that individuals had distinguishable characteristics based on the physiological variables evaluated.
Table 2 Kmeans algorithm Clusters according to the group assigned by the k-means methodology in UN Cotové papaya plants in the tropical dry forest.
| Plant number | Measurement number | ||||
|---|---|---|---|---|---|
| 1 | 2 | 3 | 4 | 5 | |
| 1 | A | B | B | A | A |
| 2 | A | B | B | A | A |
| 3 | A | B | B | A | A |
| 4 | A | B | B | A | A |
| 5 | B | B | B | A | B |
| 6 | A | B | B | A | A |
| 7 | A | B | A | A | A |
| 8 | A | B | B | A | A |
| 9 | B | B | B | A | A |
| 10 | B | B | B | A | A |
| 11 | B | B | B | A | A |
| 12 | B | B | B | A | A |
| 13 | A | B | B | A | A |
| 14 | B | B | B | A | A |
| 15 | A | B | B | A | A |
| 16 | A | B | A | A | A |
| 17 | B | B | B | A | A |
| 18 | B | B | B | A | A |
Due to the absence of individual groupings based on physiological variables that could identify plants with differentiable characteristics, a variance analysis was carried out to determine the existence of inequality between papaya individuals (18) and seasons (5). The analysis of variance indicated a significant difference (p <2e-16) for all variables, for the genotype treatment (I) and the sampling season (SS) (Figure 2).
The plants that presented a higher daily value of Ai were 9, 5, 18, 14, and 11 (Figure 2A), with an average of 438 mmol (CO2) m-2 day-1, which corresponded to the third sampling. At that time, all plants were in the reproductive stage, which implied a high demand for photoassimilates that was supported by the favorable availability of water in the soil, estimated at 29% volumetric humidity (VH) (Table 3).
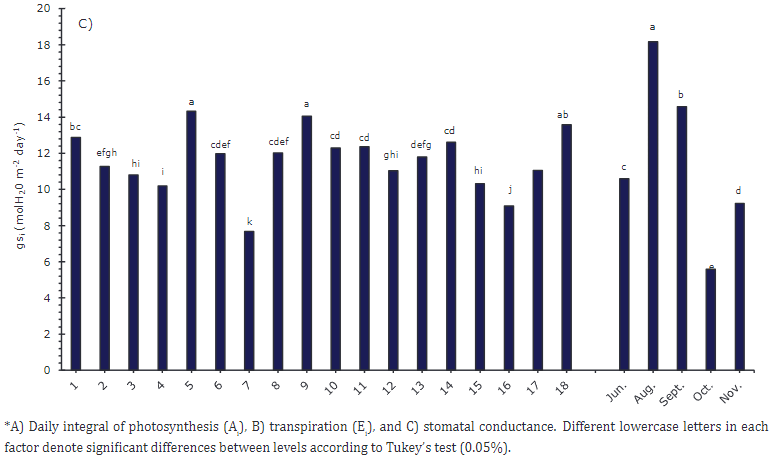
Figure 2 Simple factors of accessions and sampling time (June - November) for the gas exchange variables evaluated in UN Cotové papaya plants in the tropical dry forest.
Plant 7 had the lowest Ai value with 240 mmol (CO2) m-2 day-1, followed by plants 16 and 15. The reduction in Ai occurred in the fourth sampling (Figure 2A), which coincided with a percentage of volumetric soil moisture of 13%. Mahouachi et al. (2006) indicated that values below 20% volumetric humidity for papaya crops could cause water stress, which leads to stomatal closure that limits the photosynthetic rate. Lima et al. (2016) stated that papaya plants with water stress reduce stomatal conductance with values close to 0.06 mol m−2 s-1, which explains the lower Ei rates in this study (Figure 2B).
Table 3 Volumetric moisture values of soil (VH) planted with UN Cotové papaya plants during evaluation months (June to November).
| Sampling | 1 | 2 | 3 | 4 | 5 |
|---|---|---|---|---|---|
| Month | June | August | September | October | November |
| VH (%) | 18 | 27 | 29 | 13 | 22 |
Another effect of water stress on papaya plants was explained by Marler & Mickelbart (1998), who observed a decrease in the light saturation point with low water availability. Under field conditions, the optimal light intensity for papaya growth can also be altered by the amount of water in the soil, with a consequent lower photosynthetic rate, leading to a lower use of available radiation in recent samplings (Figure 3B).
In the case of Ei (Figure 2B), similar to Ai, plants 18, 9, and 5 presented higher transpiration rates, with a maximum value of 327 (mol (H2O) m-2day-1) for plant 18. Plant 7 offered the lowest value, 210 mol (mol (H2O) m-2day-1). These results show the direct relationship of photosynthesis with transpiration and stomatal conductance (Figure 2C). They suggest an osmotic adjustment of plants, where the water plant compensates for the output with stomata and a higher photosynthetic rate. Mahouachi et al. (2006) indicated that osmotic adjustment allows papaya to be relatively drought-tolerant by increasing the concentrations of Na, K, and Cl in the tissues to avoid dehydration. In sampling two (August), higher transpiration rates were observed in response to high temperatures, with maximum values of 37°C, sufficient water availability, and 27% volumetric soil moisture.
For WUE, plants 1, 3, and 9 stood out with high values of 1.56, 1.47, and 1.46 μmol CO2/mmol H2O, respectively, indicating that they could adapt their stomatal apparatus to fix CO2 even under extreme weather conditions. On the contrary, plants 15 and 7 had lower values, 1.09 and 1.14 μmol CO2/mmol H2O, respectively (Figure 3A). WUE measures the amount of photosynthesis achieved per water transpired and is highly influenced by environmental conditions. This is useful for evaluating the adaptation of different genotypes to a given environment. Lima et al. (2021) suggested that abscisic acid (ABA)-induced stomatal closure reduces water loss, although biochemical limitations could also be involved. Paixão et al. (2019), in studies on the papaya variety Solo, found that high stomatal conductance, transpiration, and net photosynthesis resulted in a decreased WUE. Clemente & Marler (1996) evaluated the exchange of gases in papaya in the face of rapid changes in irradiance; they found that a 12% decrease in stomatal conductance generated a 100% drop in the photosynthetic rate and the WUE. Thus, genotypes and treatments that result in a higher WUE are generally considered superior because they reduce the net amount of μmol (CO2) m-2 s-1 absorbed per mmol (H2O) m-2 s-1 transpired with stomatal closure; therefore, greater efficiency occurs at the expense of lower crop yields (Lima et al., 2021).
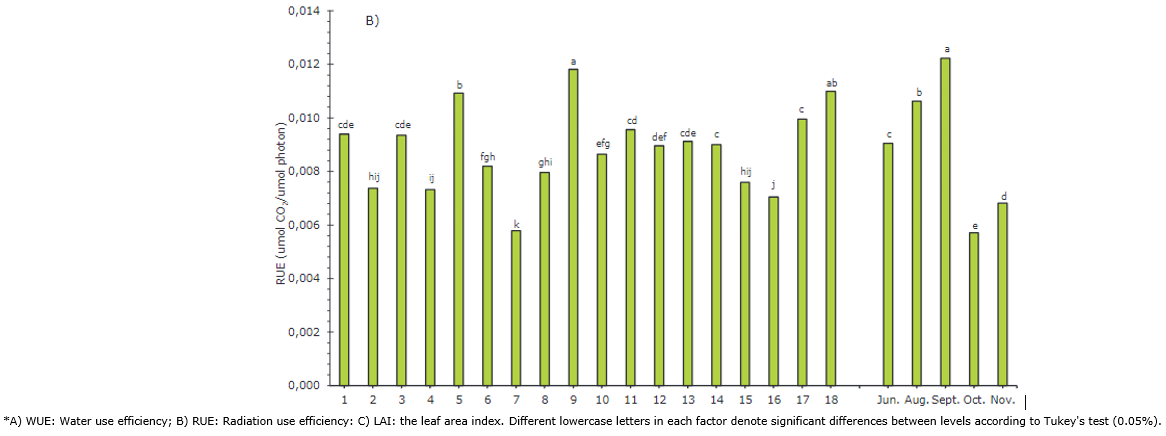
Figure 3 Simple factors of accessions and sampling time (June - November) for the efficiency use variables evaluated in UN Cotové papaya plants in the tropical dry forest.
RUE indicates the relationship between the dry matter produced and the PAR intercepted (Santos et al., 2016). Higher values were reached by plants 9, 18 and 5, with values over 0.01092 μmol CO2 /μmol photons. Plant 7 again presented the lowest value with a RUE of 0.00579 (Figure 3B). Silva et al. (2016) evaluated the RUE at different concentrations of N applied to the soil and found that an 8% increase in the N dose generates a 20% increase in the RUE, going from 0.665 to 0.796 μmol CO2/μmol Photon. For the above, photosynthetic capacity depends on nitrogen content because a considerable fraction of this element is found in the leaves, assigned in proteins involved in the photosynthetic process. On the contrary, Ruas et al. (2022) indicate that papaya genotypes with low chlorophyll contents subjected to water stress conditions and high radiation can regulate leaf temperature and maintain more turgid leaves by reducing the leaf vapor pressure deficit by increasing stomatal conductance (gs).
The quantum yield of PSII (Qy) did not present a significant difference throughout the evaluation. It ranged between 0.765 and 0.815 for all plants, independent of the variation in the gas exchange rates (Figure 4). Marler & Mickelbart (1998) reported Qy values of 0.76 for papaya. They confirmed that this specie is not affected by the scarce soil water. Contrary to photosynthesis, because of stomatal closure is a mechanism to maintain leaf water content within a range for photosynthetic capacity. In that case, it does not significantly affect Qy (Campostrini et al., 2018). Non-photochemical quenching (NPQ) indicates the mechanism for dissipating excess radiation in heat to avoid photochemical damage or an altered electron transport rate (ETR). It helps to understand how plants maintain Qy under water stress conditions (Parkash & Singh, 2020).

Figure 4 Quantum yield of PSII (Qy) for accessions and sampling time (June - November) in papaya UN Cotové plants in the tropical dry forest.
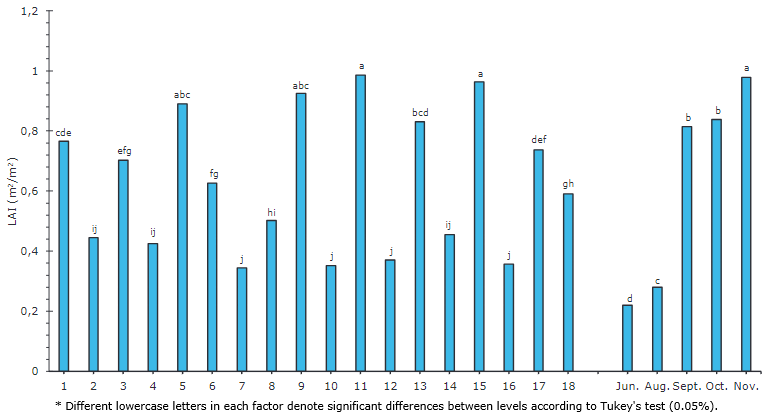
The efficiency of transforming the intercepted PAR into photoassimilates depends on the photosynthetic capacity of the leaves and the leaf area. This efficiency is expressed with the LAI, which relates the photosynthetic surface to the plant's total surface occupied by the soil. This index helps establish canopy efficiency (Wang et al., 2014).
Plants 11, 15, 9, and 5 presented a higher LAI, with values between 0.9857 and 0.8899 (Figure 5), whereas plants 9, 5, and 11 stood out, which also registered high levels of CO2 fixation (Figure 2A). A lower LAI was observed in plants 7, 10, 12, and 16, with values between 0.3438 and 0.3702. The Pearson correlation matrix (Figure 1) indicated a non-relationship between the LAI and the photosynthetic rate (-0.05). Salazar et al. (1986) reached a maximum production in Valle del Cauca of 58.1 T ha-1 with the low-growing papaya variety ICA C-41 at a distance of 1 m between rows and 2 m between plants. At a distance of 1 m between rows and 2 m between plants, the minimum production was 25.8 T ha-1. The same authors stated that the papaya planting distances used more often in Colombia include 3.0 x 3.0, 3.0 x 2.0 and 4.0 x 2.0m.
CONCLUSIONS
The plants of the papaya variety UN Cotové 9, 3, 5, 11, 14, and 18 were identified as promising parents for the papaya breeding program carried out by the Group Grupo de Mejoramiento Genético de Especies Andinas y Tropicales of the Universidad Nacional de Colombia, campus Medellín. These plants performed best in the gas exchange parameters and quantum yield. These physiological characteristics allow us to verify the best adaptation of the plants to the climatic conditions of the TDF in Santa Fe de Antioquia. On the contrary, plants 4, 7, 15, and 16 showed the lowest performance for the parameters evaluated.
The use of physiological indicators allowed the identification of individuals from the UN Cotové papaya variety with the potential to be used as promising parents in breeding programs, with adaptation characteristics to TDF climatic conditions.

