


 English (pdf)
 Article in xml format
 Article references
 Send this article by e-mail
 Cited by SciELO
  Cited by Google
  Similars in
SciELO
Similars in
SciELO  Similars in Google
 Permalink
Introduction
Nowadays, systems that help protect the environment are being implemented in the production of electricity, including wind energy generation, which is characterized as a renewable, free, and environmentally friendly energy source, that utilizes the kinetic energy generated by the wind to produce electricity. Renewable energy sources supplied 27% of the global electricity generation in 2020 1, and they accounted for 25% of the total primary energy supply in 2013 in Latin America 2. In addition, wind energy, together with photovoltaics, generated 7% of the global electricity in 2020 1. The amount of electricity that can be produced by a wind turbine depends mainly on wind speed. However, the fact that wind speed is dispersed and random constitutes a disadvantage for its use 3) (5) .
Considering the efficiency and environmntal benefits of wind energy sources, projects have emerged which focus on harnessing the wind by modifying the physical structure of the turbine in order to increase its efficiency, given the fact that the wind is not constant. Several of the authors of these projects analyze the aerodynamic behavior of the turbine with computational fluid dynamics (CFD) simulations to identify possible improvements 6)-(10. When resorting to CFD simulations for the aerodynamic characterization of the turbines, the simulations are validated and supported with experimental tests by introducing the turbine inside a wind tunnel. To facilitate data acquisition in said experiments, this work develops a prototype wireless data acquisition device located inside the wind tunnel, which is simple to install, in order to gather the data necessary to validate the results obtained in the CFD simulations. With the implementation of the device for capturing experimental data, the efficiency of the CFD simulations will be higher, so this wireless data acquisition system will be able to support future designs aiming to increase energy production in wind turbines.
The device is composed of an embedded system. This type of system is widely used for data acquisition in real time, and it allows the wireless transfer of information, with the advantage that the user can be at a safe distance from the place where the tests are performed in order to obtain the data. This allows the acquisition of data from tests performed in high-risk areas or that require remaining exposed all the time, as in the measurement of environmental conditions that affect the harvest in a crop, the explosion of a car to measure the forces involved, or inside a wind tunnel to characterize the aerodynamic behavior of an object 11)-(18.
Wind energy
To talk about wind energy, we must first understand the concept of wind, since it is the main factor in wind systems. Wind is a mass of air in motion, which is produced by the temperature variation of the earth’s surface, which is generated by different solar radiation intensities. Therefore, wind energy can be considered to be a small percentage of the solar energy incident on the earth 3),(5) ,(20),(21) .
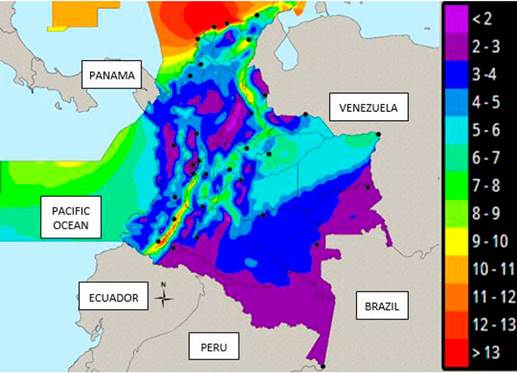
Wind energy is characterized as a renewable, free, and environmentally friendly source of energy, which allows utilizing the kinetic energy produced by the wind in order to generate electricity by using wind turbines 3), (4), (5), (21) . The amount of electricity generated by a wind source depends mainly on the wind velocity, which is a disadvantage because the wind is not constant, that is, the flow of wind displacement is dispersed and random 3), (4) . As wind velocity varies with respect to the surface temperature, it must be considered that the wind potential of each area is different. The segmentation of the wind potential with respect to wind velocity in Colombia 22, can be seen in Fig. 1.
Wind turbines
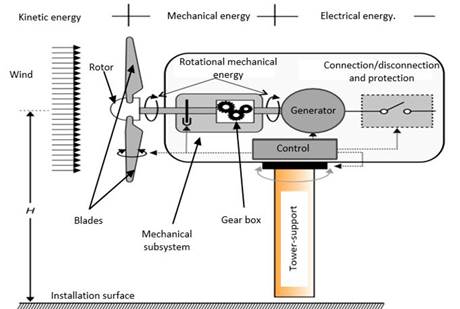
Wind energy sources are basically composed of wind turbines. These turbines are the mechanical devices in charge of capturing the kinetic energy of the wind in order to transform it into electricity. The diagram shown in Fig. 2 shows the components of a wind turbine. The operation of these devices is based on capturing the wind through the blades in order to convert the kinetic energy of the wind into mechanical energy, which turns the rotor of a generator, transforming the mechanical energy into electricity. Finally, the electricity generated can then be used or stored in batteries 3), (4), (20) .
As for the turbine, there are three fundamental laws that describe its operation: the amount of electricity that a turbine can produce is proportional to the wind velocity squared; the energy that the turbine can harness is proportional to the square of the length of its blades; and, theoretically, the maximum efficiency of a wind turbine is 59%, although it is lower in practice 3.
Wind tunnel
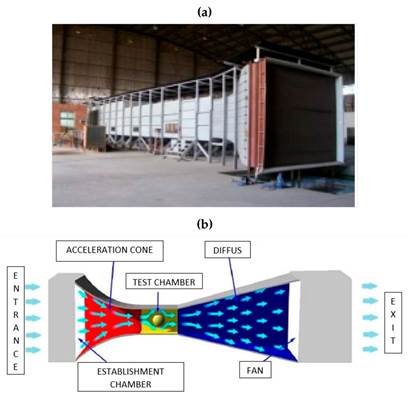
A wind tunnel (Fig. 3a) is an infrastructure that generates a constant wind flow of known parameters. It is used to study and verify the effects of wind on an object by obtaining information on wind behavior, pressure distribution, and global loads produced. Among the various applications wind tunnels in engineering, the following areas stand out: fan calibration, aeronautical simulations, fluid mechanics, and the aerodynamic characterization of wind turbines 23) (25) .
Figure 3b shows the composition of a wind tunnel, namely the establishment chamber, whose function is to make the wind flow uniformly and move in only one direction only; the acceleration cone, which is responsible for accelerating the velocity of the air flow; the test chamber, where the object of study is located (for this project, this would be the wind turbine and the sampling device to be developed); the diffuser, where the wind velocity is reduced, reducing in turn the energy losses of the tunnel; and the integrated system of powerful fans to produce the different air current velocities to which the object of study is subjected 25),(27) .
Aerodynamic behavior of a turbine
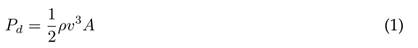
Aerodynamics is the study of the forces and motions exerted on an object passing through a stream of air 21. The aerodynamic study of a turbine is important to measure operating parameters such as startup, shutdown, system orientation, and turbine lifetime (it also depends on the maximum turbulence that the system can withstand). It should be noted that, for a small wind turbine, the minimum wind velocity required for operation is 3,5 m/s, and, to produce the maximum generation power, a velocity of approximately 10 m/s is required 19. Eq. 1 defines the available power for a wind turbine, but, as it can be noticed, it is basic because it disregards a very important factor for the present project, which is the ratio between the harnessed and the available power. Instead, Betz’s limit theory can be used for a theoretical study on the aerodynamic characterization of turbines.
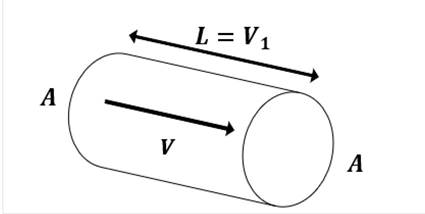
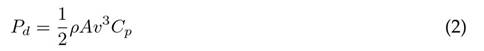
The theory developed by Betz is a first approach to the problem regarding the immersion of the turbine into an air flow, and it demonstrates that the greater the amount of energy from the wind that the turbine utilizes, the greater the loss of velocity suffered by the wind when passing through the turbine. Therefore, the highest efficiency achievable by a wind turbine is 59% 5. This study was made based on Fig. 4, thus obtaining Eq. 2 to define the wind power that can be harnessed by the turbine. On the other hand, projects that focus on redesigning the physical structure of the turbine perform their aerodynamic studies using CFD techniques. These techniques use numerical methods and algorithms to analyze the behavior of fluids based on parameters such as velocity, pressure, temperature, among others 4.
To analyze the aerodynamic behavior of the turbine through CFD simulations, it is necessary to consider the wind as a fluid, for which it is necessary to consider parameters such as the Mach number, which is used as a reference of the velocity; viscosity, the property that describes the resistance of a fluid when sliding; the boundary layer, which is the layer between the flow layer that adheres to the surface of the object of study and the free stream layer; the laminar layer, which is produced when the air movement within the boundary layer is in the form of parallel layers; and the Reynolds number, on which the aerodynamic coefficients depend 21. From the theory of fluid dynamics, it is possible to obtain Eq. 3, which describes the wind power that the turbine can extract from the wind.

The three equations presented allow identifying the main parameters to be considered to aerodynamically characterize a turbine, deducing that only the wind velocity and direction need to be measured, since this project is focused on experimental tests inside a wind tunnel. Several parameters that affect the turbine, such as topology, geography of the area, temperature, and atmospheric pressure, among others, are discarded.
Data acquisition device
Data acquisition module
The data acquisition module is composed of two sensors: the Wind Sensor Rev.P to measure wind velocity and the MMA7361 accelerometer, used to measure the inclination of the turbine due to the force exerted by the wind.
Hot wire anemometer
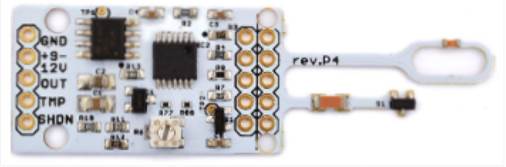
The Wind Sensor Rev.P (Fig. 5) is the latest version of wind sensors developed by MODERN DEVICE. This anemometer stands out for its hardware compensation of the ambient temperature, as it is composed of stable and accurate thermistors, in addition to having the ability to withstand the force of a hurricane without saturating 28. Some technical specifications to be highlighted are the following: it has an operating range of 0-150 mph; it requires a supply voltage of 10-12 V; the output of this sensor is analog and varies from 0-3,3 V; and it has a resolution of +/- 0,5 m/s for a constant wind current of 5 m/s 29, 30. These features facilitate the implementation of this anemometer in circuits and allow adequately measuring the wind velocity.
Capacitive accelerometer
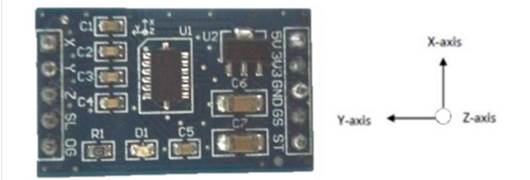
An accelerometer is an electromechanical device developed for measuring the dynamic and static acceleration of an object produced by a shock, movement, impact, or vibration 31), (32), (33) . It is necessary to implement a sensor that does not cover a large area, so the MMA7361 (Fig. 6) accelerometer was chosen. Usually, this sensor is used to detect vibrations, to measure the inclination of an object, or to measure movement, compasses, etc. It is generally implemented in portable devices and mobile equipment 31. On the other hand, this sensor is a low power consumption measurement instrument of 400 µA, it has a small size, it requires a power supply of 3,3 to 5 V, and it has a sensitivity adjustable to 800 mV/g or 206 mV/g, and analog output with a range of 0-3,3 V, and a response time of 0,5 ms. To summarize, it is a suitable sensor for the device to be developed 34), (35) .
Data processing and wireless data transfer modules
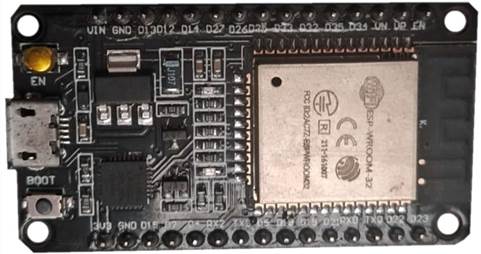
These two modules are addressed in the same section since the development board to be implemented is the ESP32. This board is designed by Espressif Systems, who define it as the solution for microcontrollers that lack wireless data transmission features. This type of boards is commonly used as the means to access IoT technology, and it can also be used for monitoring variables in real time. It is a small device that has the advantage of taking up little space on a printed circuit board 36), (37) .
ESP32
The ESP32 (Fig. 7) is a development board consisting of a 32-bit core and features such as Wi-Fi, Bluetooth, and BLE wireless connectivity 38. It can be programmed using the Arduino IDE, thus making it easy to use, which makes this board a powerful tool for wirelessly processing and sending data. What makes the ESP32 stand out is that it features Bluetooth V4.2 BR/EDR and BLE, as well as 32 input and output pins, (out of which 18 can be used as ADC converters). The ADC has a resolution of 12 bits and a sampling rate of 200 samples per second 38. These characteristics are suitable for the development of real-time data acquisition applications. As for the wireless connection via Bluetooth, it has a transmission power of +12 dBm, UART communication protocol, and a transmission rate of 4 Mbps 36.
Real-time data monitoring
For data monitoring, an app is created using MATLAB's App Design tool, facilitating user interaction with the tool for the visualization of the data acquired by the device. The tool provided by MATLAB allows creating apps without extensive knowledge in coding because the graphical interface can be created by dragging and dropping visual components. On the other hand, it has an editor where the behavior of the app can be programmed 39. Fig.9 shows the app developed for data monitoring.
Results
This section presents the wireless data acquisition device for the aerodynamic characterization of a wind turbine. The device can be seen in Fig. 8, and its dimensions are 7 x 6 x 6 cm. Having a small size constitutes an advantage in terms of installation inside the wind tunnel, in addition to the fact that it will not affect the aerodynamic behavior of the turbine.
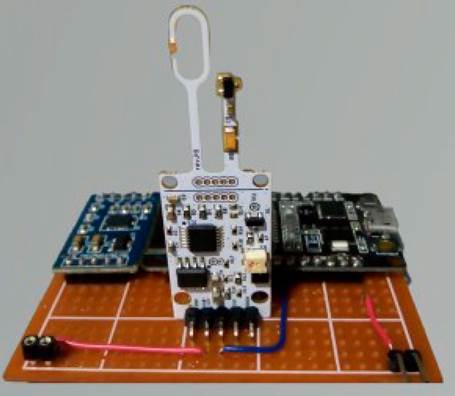
Fig. 9 shows the app in operation, where the parameters necessary for the characterization of a wind turbine can be seen. These parameters are the inclination of the object in 3D, showing the x, y, and z axes in g. On the other hand, the wind velocity can be visualized in 2D, where the axes of the graph are velocity (m/s) vs. time (s).
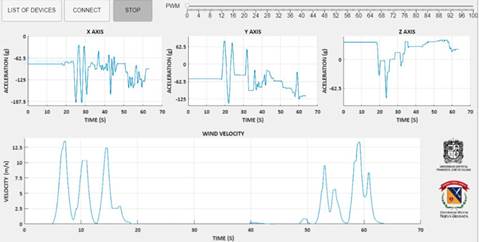
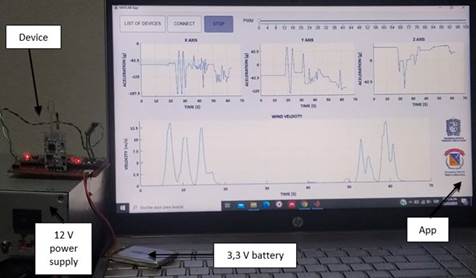
Fig. 10 shows the device in front of the computer. As it can be observed, there is no physical connection between them, since the data transfer is wireless. This device reads the inclination of the object of study in g and the wind velocity in m/s.
Finally, Table I presents the data obtained in different tests with the device. The tests consisted of first changing the transmission speed (Kbps) to establish a speed at which the connection was stable, and then varying the distance between the device and the computer (cm) in order to obtain the coverage of the device. These tests showed that the data loss occurs at a transmission speed of 134,314 Kbps because the time required by MATLAB to process and plot the data is greater than the time it takes the device to send the messages, which is why the application does not perform the timely reading of the messages, thus causing the agglomeration of the information in the device and the loss of connection.
Table I Coverage tests of the wireless module developed for aerodynamic characterization inside wind tunnel
| Transmission rate (Kbps) | Distance (cm) | Data loss or connection failure |
|---|---|---|
| 31,357 | 90 | NO |
| 74,689 | 90 | NO |
| 134,314 | 90 | YES |
| 74,165 | 156 | NO |
| 74,560 | 265 | NO |
| 75,994 | 410 | NO |
| 75,339 | 543 | NO |
| 73,561 | 697 | NO |
| 74,620 | 851 | NO |
| 70,425 | 974 | NO |
| 74,408 | 1087 | NO |
On the other hand, Table I shows that a stable connection is maintained within a range of 1087 cm and that the transmission speed varies due to the changes in the distance between the wireless data acquisition device and the computer, given that the transfer of information is performed via the Bluetooth protocol, which is asynchronous.
Fig. 11 shows the distortion. The signal is not continuous, but there are some peaks and drops in the signal corresponding to the wind velocity when the amount of data sent per message is increased.
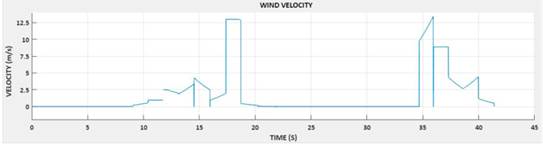
Table II Units and symbols
| Unit | Symbol | Note |
|---|---|---|
| Velocity | m/s | Unit of speed |
| Meters | m | Unit of distance |
| Centimeter | cm | Unit of distance, corresponding to 1 × 10⁻² m |
| Milliseconds | ms | Unit of time, corresponding to 1 × 10⁻³ s |
| Microvolts | µV | Unit of electric potential, corresponding to 1 × 10⁻⁶ v |
| Kilogram | Kg | Unit of mass |
| Watt | W | Unit of power |
| Force g | g | Unit of acceleration, corresponding to 9,80665 m/s2 |
| Transmission rate | Kbps | Unit of the speed at which the information is transferred, corresponding to 1 × 103 bits per second |
Table III Variables and abbreviations
| Variable | Abbreviation | Note |
|---|---|---|
| Available power | Pd | Power that can be captured by the wind turbine in W |
| Fluid density | ρ | Wind density in kg/ m3 |
| Area | A | Wind turbine rotor area in m2 |
| Length | L | Length of the test object in m |
| Velocity | V | Wind velocity in m/s |
| Power coefficient | Cp | Ratio between the harnessed and the available power |
| Length | S | Wind turbine length in m |
| Velocity one | V1 | Wind velocity before contacting wind turbine in m/s |
| Velocity two | V2 | Wind velocity after passing through the wind turbine in m/s |
| Computational Fluid Dynamics | CFD | Numerical simulation of fluids using computational methods |
Conclusions
The wireless data acquisition device for the characterization of a wind turbine is in proper working order when time periods are established in order to properly synchronize all the modules of the device, i.e., when the appropriate time for data acquisition, processing, transfer, and visualization is established according to the characteristics of each module. For the data acquisition module, the sampling time depends on the samples per second that the sensors can take. The data processing module must have a waiting time between samples so as not to affect the ADC conversion. The data transfer module must send the information every so often, so that the computer can acquire the data and process and display them without loss of information. By achieving a small device size and wireless data transfer, the installation of the device inside the wind tunnel is facilitated. In addition, the device can provide real-time data monitoring, which allows viewing the aerodynamic behavior of the wind turbine inside the wind tunnel during testing, thus facilitating the necessary measurements for the study. This provides quality information to support future projects focused on the design of wind turbines in order to increase their efficiency by making better use of the kinetic energy produced by the wind.

