Introduction
High carbon steel is one of the most common steel types due to its relatively low cost and high strength, while it provides material properties acceptable in many applications. However, its sustainable use is limited by its low corrosion resistance in industrial environments such as acid cleaning, pickling, descaling, and drilling operations in oil and gas exploration 1 - 3. One of the fundamental causes of corrosion is the reduction in the value of Gibbs free energy of the materials.
Production of almost all engineering material components made of metals involves the addition of energy to the metals in the unrefined form. The metals tend to be highly reactive due to the fewer number of valence electrons, thus they lose their electrons during chemical and electrochemical reactions. The corrosion damage results basically from the interaction of metallic structures with their environment 4.
In some cases, corrosion damage is tolerable and leads to higher maintenance costs with minimal losses. However, corrosion can also result in catastrophic failures with loss of life and downtime of industrial services. Deterioration of metallic surfaces reduces the efficiency of metallic equipment resulting in financial loss to industries. To alleviate the damaging effects of corrosive anions and other constituents in industrial environments, the use of corrosion inhibitors has been proven to be a comparatively cost-effective solution 5 , 6. Organic compounds with N, O, and S atoms are considered to be effective corrosion inhibitors; their effectiveness depends on the chemical composition and structure of the compound. However, the toxic nature and relatively high cost of organic inhibitors emphasize the need for sustainable alternatives. Application of low-cost and eco-friendly compounds as corrosion inhibitors have gradually replaced their toxic counterparts in recent years 7 - 12. In such way, this research aims to study the corrosion inhibiting properties and performance of the combined admixture of L-leucine and trypsin complex on high carbon steel in dilute sulphuric acid.
Materials and Methods
AISI 1095 High carbon steel (1095HCS) obtained commercially with nominal (wt.%) composition shown in Table 1 has a cylindrical shape with average dimensions of 0.71 cm length, 1.4 cm diameter and 5.94 cm2 surface area. The carbon steel samples were machined first to the final shape and then grinded with silicon carbide abrasive papers of 80, 320, 600, 800 and 1000 grit. They were subsequently washed with distilled water and acetone. The samples then were stored in a desiccator for weight loss analysis, potentiodynamic polarization technique, and corrosion potential measurement according to ASTM G1-03 15.
L-leucine obtained from Sigma Aldrich USA is a white powdery solid with a molar mass of 131.17 g/mol and a molecular formula of C6H13NO2. Trypsin complex obtained from Bell, Sons & Co. Ltd UK is a transparent oily liquid with a molar mass of 933.45 g/mol and a molecular formula of C57H104O9. The molecular structure of both compounds is shown in Figure1a and b. Their combined admixture (LTC) was prepared in volumetric concentrations of 1%, 2%, 3%, 4% and 5% LTC per 200 mL of 1 M H2SO4 acid prepared from analytical grade (98%) with distilled water.

Figure 1 Molecular structure of (a) L-leucine and (b) Trypsin complex (triester of glycerol and ricinoleic acid).
Potentiodynamic polarization curves were obtained at a scan rate of 0.0015 V/s between potentials of −1.5 V and +1.5 V and then plotted according to ASTM G102-89 16. A platinum rod was used as the counter electrode and a silver chloride electrode (Ag/AgCl) as the reference electrode. Corrosion current density (Jcr, A/cm2) and corrosion potential (Ecr, V) values were obtained from Tafel extrapolation of the polarization curves. The corrosion rate (CR) and the inhibition efficiency (η) were calculated from the formula below (Eq. [1]):
Where D is the density in g/cm3; Eqv is the sample equivalent weight in grams. 0.00327 is a constant for corrosion rate calculation in mm/year 17. 1095HCS samples immersed individually in 200 mL of the 1 M H2SO4/1%-5% LTC solutions for 360 h at 30 oC ambient temperature were weighed at 24 h interval according to ASTM G31-72 18. Corrosion rate (CR) was determined from the mathematical relationship below (Eq. [2]) 19:
Where ω is the weight loss in mg, D is the density in g/cm3, A is the total surface area of the coupon in cm2 and 87.6 is a constant for corrosion rate determination in mm/year; and t is the time in h. Inhibition efficiency (η) was determined from the equation below (Eq. [3]):
Where ω1 and ω2 are the weight loss at specific LTC concentrations. Surface coverage was determined from the formula below (Eq. [4]) 20 , 21:
Where θ is the degree of LTC mixture, adsorbed per gram of 1095HCS surface; ω1 and ω2 are the weight loss of each 1095HCS sample at specific concentrations of LTC in the acid solution.
1 M H2SO4/LTC solutions (before and after 1095HCS corrosion) were exposed to a specific range of infrared ray beams from Bruker ALPHA FTIR spectrometer at the wavelength range of 375 to 7500 cm-1 and resolution of 0.9 cm-1. The transmittance and reflectance of the infrared beams at various frequencies were decoded and transformed into an ATF-FTIR absorption plot consisting of spectra peaks. The spectral pattern was evaluated and equated with ATF-FTIR absorption table to identify the LTC functional groups actively involved in corrosion inhibition. Micro-analytical images (surface morphology and topography) of LTC inhibited and corroded 1095HCS samples were studied with an Omax 40X-2500X Plan Infinity Trinocular Metallurgical microscope through the aid of ToupCam analytical software.
Statistical studies through analysis of variance (ANOVA) at a confidence level of 95% (significance level of α = 0.05) was employed to assess the statistical significance of LTC concentration and exposure time on the calculated corrosion rate values of HCS in 1 M H2SO4 solutions according to the mathematical relationships (Eqs. [2] - [4]).
The Sum of squares among columns (Exposure time):
Sum of Squares among rows (LTC concentration):
Total Sum of Squares:
Results and Discussion
Polarization studies
Corrosion polarization plots of the anodic-cathodic behavior of HCS in 1 M H2SO4/1% - 5% LTC are shown in Figure 2. Potentiodynamic polarization data obtained are presented in Table 2. The corrosion current density at 0% LTC (1.59 x 10⁻³Acm-2) was drastically reduced to 3.88 x 10⁻⁴ Acm-2 at 1% LTC due to the electrochemical action of ionized LTC molecules in retarding the electrolytic transport of SO4 2- ions unto the steel surface.
Further increase in LTC concentration (2% - 5% LTC) caused a proportionate decrease in corrosion current density to 2.79 x 10⁻⁴ at 5% LTC. This corresponds to a corrosion rate value of 3.24 mm/year in comparison to 18.42 mm/year at 0% LTC.
The corrosion potential values (Table 2) showed the mixed inhibition properties of LTC. At 0% LTC, the polarization plots shifted cathodically from -0.298 V to -0.224 V (1% LTC) before shifting in the anodic direction (2% - 5% LTC) due to the dominant anodic inhibiting action of LTC mixture, through surface coverage and adsorption, resulting from charge transfer, whereby the hydrogen evolution and oxygen reduction reactions are stifled 22.
The analysis of the Tafel slopes suggests a significant difference between the values of the steel exposed to 0% LTC and 1% LTC confirming the strong influence of LTC on the redox electrochemical process occurring on HCS surface. Further increase in LTC concentration did not affect significantly either the values of the Tafel slopes. The anodic Tafel slopes are much greater than the respective cathodic Tafel slopes due to its higher anodic exchange-current density values compared to the cathodic values.
LTC proved to be an effective inhibiting compound at the concentrations studied with inhibition efficiency ranging from 75.59% to 82.40%. A lone pair of electrons is available on the oxygen atoms, and hence, a coordination of the ionized inhibitor molecules with HCS metal atoms. Electrons flow from the electron rich centers of LTC to electron deficient centers of HCS metal inhibiting the electrochemical processes responsible for corrosion. As concentration increases in LTC, increased marginally its inhibition efficiency showing it is slightly concentration dependent. The maximum change in corrosion potential of HCS in the anodic and cathodic direction is less than 85 mV, thus LTC is a mixed type inhibitor 23 , 24.
Open circuit potential measurement
Plots of graphs of corrosion potential versus exposure time for HCS specimens in 1 M H2SO4/0% LTC, 1 M H2SO4/ 1% LTC, and 1 M H2SO4/5% LTC for 1800 s are shown in Figure 3. The corrosion potential values for HCS in 1 M H2SO4/0% LTC started at -0.363 VAg/AgCl at 0 s and changed progressively till -0.334 VAg/AgCl at 1800 s due to active polarization reactions on the steel surface. Addition of LTC to the acid solution changed the dynamics of the redox electrochemical reactions in the debilitating actions presence of SO4 2- anions.
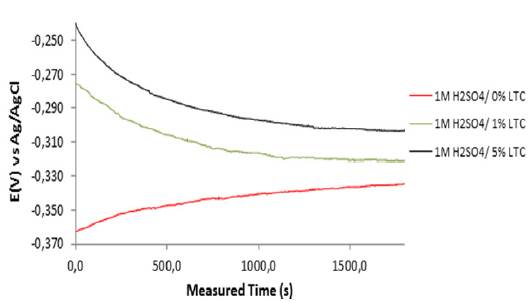
Figure 3 Variation of corrosion potential versus measured time for HCS specimen immersed in 1 M H2SO4/0%, 1% and 5% LTC.
HCS in 1 M H2SO4/ 1% and 5% LTC solution showed similar open circuit corrosion potential behavior between 0 s and 1800 s, but contrast significantly the corrosion behavior of HCS in 1 M H2SO4/ 0%. At 0 s their corrosion potential values were -0.276 VAg/AgCl and -0.239 VAg/AgCl; the values decreased progressively to -0.301 VAg/AgCl and -0.319 VAg/AgCl at 1250 s. Beyond 1250 s the corrosion potential values varied marginally. The difference in corrosion potential despite similar active/passive corrosion behavior between 1% and 5% LTC is the result of differences in LTC concentration. Increase in LTC concentration shifted the graphical plot of HCS reaction in H2SO4 solution due to adsorption of LTC molecules which inhibits further corrosion reaction on HCS surface.
Adsorption isotherm studies
Corrosion inhibition of HCS in dilute 1 M H2SO4/LTC solution occurs when LTC molecules accumulate on HCS surface forming a molecular or atomic film; LTC inhibition efficiency is due to the strength of its adsorption. The electrochemical action of LTC molecules on HCS surfaces with respect to concentration can be further understood through adsorption isotherms. The isotherms relate the amount of LTC mixture from aqueous acid solution with its concentration at the metal/solution interphase at constant temperature and pH 25 , 26. Langmuir, Frumkin, and Freundlich isotherms gave the best fitting for LTC adsorption on HCS surface from correlation the coefficient values obtained.
Langmuir isotherm model suggests the presence of a fixed number of vacant or adsorption sites on the metallic surface, of equal dimension and shape on the metal surface holding a specific amount of inhibitor molecule. This results in the release of definite amount of heat energy. The isotherm also suggests the non-existence of lateral interaction between the adsorbedmolecules 27. Figure 4 shows the plots of  vs CLTC agrees with the Langmuir isotherm, with a correlation coefficient of 0.9994 according to the Langmuir equation [8].
Where θ is the amount of LTC adsorbed per unit gram on HCS surface at equilibrium surface coverage. C LTC is LTC inhibitor concentration, and K LTC is the equilibrium constant of adsorption.
The Frumkin isotherm model assumes metallic surfaces to be non-homogeneous and the lateral interaction effect among adsorbed LTC molecules is apparent according to the equation [9] 28:
Where α is the interaction parameter which describes the molecular interaction in the adsorbed layer, and calculated from the slope of the Frumkin isotherm plot. For positive α adsorption energy increases with θ, whereas for negative α adsorption energy decreases with θ. K
LTC is the adsorption-desorption constant. In Figure 5 plots of log versus θ showed a correlation coefficient of 0.9651 in 1 M H2SO4 solution.
Freundlich isotherm defines the relationship between adsorbed LTC molecules, their interaction and influence on the adsorption process through molecular repulsion or attraction according to the following equations ([10] and [11]):
Where n is a constant depending on the characteristics of the adsorbed molecule and K LTC is the adsorption-desorption equilibrium constant denoting the strength of interaction in the adsorbed layer. The amount adsorbed on HCS surface represents the sum total of adsorption on the reactive sites 29 , 30. The correlation coefficient for Freundlich isotherm plot (Figure 6) is 0.8834.
Thermodynamics of the corrosion inhibition mechanism
The intermolecular reaction of LTC on HCS surface and the adsorption type was determined from the thermodynamics of LTC reaction with HTC surface through the Langmuir isotherm due to its correlation coefficient being closest to unity. Calculated results of Gibbs free energy of adsorption in H2SO4 solution is shown in Table 3, from Equation [12] 31:
Table 3 Results for Gibbs free energy (ΔG o ads), surface coverage (θ) and equilibrium constant of adsorption (K ads) for LTC adsorption on HCS in 1 M H2SO4 solution.
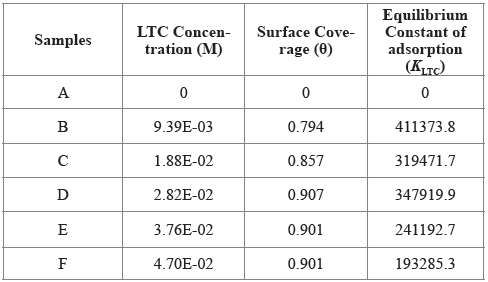
Where 55.5 is the molar concentration of water in the acid solution, R is the universal gas constant, T is the absolute temperature, and K LTC is the equilibrium constant of LTC adsorption on HCS. Negative values of ∆G o ads depict the spontaneity and stability of the adsorption mechanism. The lowest ∆G o ads value is -40.11 KJmol-1 at the highest LTC concentration, while the highest ∆G o ads value is -41.99 KJmol-1 at the lowest LTC concentration on HCS surface due to the effect of lateral repulsion among LTC molecules at higher LTC concentration. The ∆G o ads values calculated shows chemisorption adsorption mechanisms on HCS surface 32 , 33.
ATF-FTIR Spectroscopy analysis
Functional groups within LTC mixture involved in the corrosion inhibition and adsorption reactions on HCS were identified by ATF-FTIR spectroscopy after being equated with the ATR-FTIR Theoretical Table 34 , 35. Figure 7 shows the spectra plots of 1 M H2SO4/LTC solution before and after HCS corrosion. The transmittance of calculated wavenumbers of 1 M H2SO4/LTC solution before corrosion at intervals of 2981.97 - 3518.41 cm-1, 1066.74 - 1150.37 cm-1, and 542.55 - 724.08 cm-1 decreased significantly after corrosion due to corrosion inhibition resulting from adsorption of specific LTC functional groups. Identified functional groups of alcohols, phenols, primary and secondary amines and amides, carboxylic acids, alkynes, aromatics, alkenes, and alkanes consisting of bonds such as O-H stretch, free hydroxyl, H-bonded, N-H stretch, -C(triple bond)C-H: C-H stretch, C-H stretch and =C-H stretch bonds where responsible for the corrosion inhibition of HCS steel. The increased transmittance of the functional groups at other wavenumbers shows that surface coverage was also significantly responsible for corrosion inhibition of HCS.
Weight loss measurement and micro-analytical studies
Experimental data for weight loss (ω), corrosion rate (C R) of HCS, and LTC inhibition efficiency (ɲ) in 1 M H2SO4 solution at 360 h exposure time are shown in Table 4. Figure 8 (a and b) depicts the plot of HCS corrosion rate and LCN inhibition efficiency versus exposure time (24 h - 360 h). Micro-analytical images of HCS before and after corrosion, in the presence and absence of LTC, are shown in Figures 9 (a) to 10 (b) at mag. x100. The corrosion rate values of HCS at 0% LTC was unstable [Figure. 8(a)] for the first 120 h, alternating from 0.0121 mm/year at 24 h to 0.0128 mm/ year. A consistent decrease in corrosion rate was later observed after 120 h, till 216 h decreased for the first 72 h of exposure to 0.0081 mm/year before increasing progressively to 0.011 mm/year at 288 h due to the redox electrochemical action of SO42- ions resulting from the disassociation of H2SO4 in H2O (Eqs. [13a] and [13b]). Further exposure of HCS in the acid solution beyond 216 h caused a progressive increase in corrosion rate values till 360 h (0.0136 mm/year), during which severe anodic dissolution and deterioration of HCS surface morphology (Figure 9(d)) occurred according to Eq. [14]. The presence of porous oxides and corrosion pits are clearly visible on HCS surface.
The HSO4 - ion also dissociates to a small degree:
Table 4 Experimental data from weight loss measurement at 360 h for HCS corrosion in 1 M H2SO4 media (0% - 5% LTC).
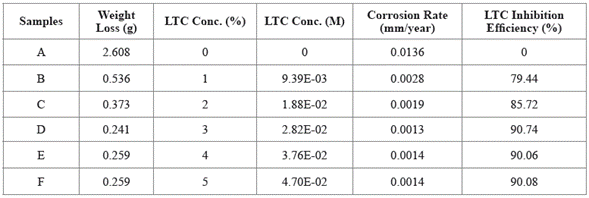
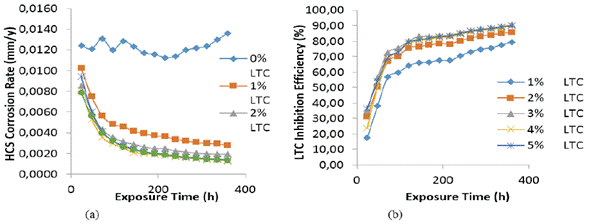
Figure 8 Plot of (a) HCS corrosion rate versus exposure time in 1 M H2SO4 (b) LTC inhibition efficiency versus exposure time in 1 M H2SO4.
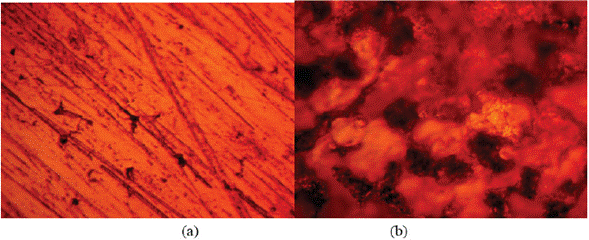
Figure 9 Micro-analytical images of HCS at mag. x100 (a) before corrosion, (b) after corrosion in 0% LTC/1 M H2SO4 solution.
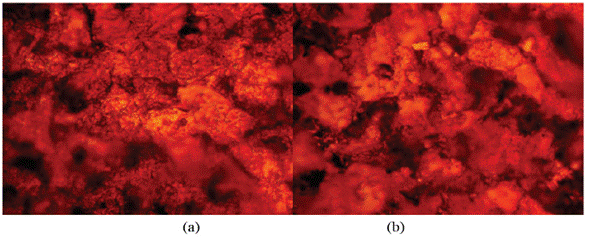
Figure 10 Micro-analytical images of HCS at mag. x100 (a) after corrosion in 1% LTC/1 M H2SO4, (b) after corrosion in 5% LTC/1 M H2SO4.
The optical microscopic images in Figure 10 (a and b) show a slightly degraded surface at 1% and 5% LTC as compared to the surface morphology in Figure 9 (b). This observation is due to the inhibiting action of LTC mixture at the concentrations studied. The slight deterioration earlier mentioned is probably due to the initial preadsorbed SO4 2- ions on HCS surface before the electrolytic transport and adsorption of LTC on the steel surface, which stifled further redox electrochemical reactions. The inhibition performance of LTC appears to be time-dependent rather than concentration dependent [Figure 8 (b)]. The inhibition efficiency values tend to increase with time, attaining peak inhibition efficiency (360 h) of 79.44 mm/year and 90.08 mm/year at 1% and 5% LTC.
Statistical studies
The statistical result in Table 5 showed that both LTC concentration and exposure time are statistically relevant variables responsible for HCS corrosion rate values with calculated F-values (mean square ratio) of 51.79 and 437.28. These values are significantly greater than the theoretical significance factor (significance F) value of 3.01, corresponding to a percentage significance of 10.50% and 88.69%. However, the results of the percentage significance factor also show that exposure time is the dominant factor responsible for the electrochemical behavior and the resulting microstructural properties of HCS with respect to changes in LTC concentration. Changes in LTC concentration have limited influence on its corrosion inhibition performance as it tends to be effective at all concentrations studied. The performance of the inhibitor tends to be time-dependent rather than concentration-dependent, especially within the first 120 h.
Conclusion
The study of the synergistic effect of L-leucine and trypsin complex on the corrosion inhibition of high carbon steel in H2SO4 solution showed the admixture to be highly effective at all range of concentrations studied from potentiodynamic polarization analysis and weight loss measurement. Corrosion inhibition efficiency was time-dependent as the results were not proportional to inhibitor concentration. Chemisorption adsorption mechanism occurred on the steel surface according to isotherms determined with near unity correlation coefficient. Identified functional groups were completely adsorbed onto both steels from analysis of the adsorption spectra. Optical images of the inhibited steel showed mild deterioration with fewer and very shallow pits compared to the uninhibited counterparts with severely corroded morphology.


