


 English (pdf)
 Article in xml format
 Article references
 Send this article by e-mail
 Cited by SciELO
  Cited by Google
  Similars in
SciELO
Similars in
SciELO  Similars in Google
 Permalink
1. Introduction
The SAE Aero Design competition is intended to provide engineering students with real-life challenges, posing the kind of problems that engineers must address in the work environment [1]. Thus, the participation in the Micro category of the competition is aimed at the design of a micro-UAV (unmanned aerial vehicle) of low weight, which can be assembled in the shortest time possible and deployed manually, carrying the greatest amount of cargo in relation to its unladen weight [2]. The design and construction of unmanned aircraft evolve depending on the needs of users and their expectations: universities, government agencies, technology companies, public and private research and development centers, mostly, carry out research according to their interests [3]. Moreover, other report shows that UAVs are used in other applications such as precision agriculture and mapping [4]. Therefore, the design of the competition’s Micro category aircraft must consider proper control and ease of maneuvering, so as to avoid forced landings or partial or total loss of the aircraft. A poor design of the aircraft control surfaces means that the aircraft does not meet the requirements of the competition.
The aircraft design is a collaborative and multidisciplinary process. It involves several experts with different disciplinary competences that often belong to different departments or organizations, such as developing a new generation of multidisciplinary design analysis and optimization (MDAO) frameworks for aircraft design [5]. The design of an aircraft goes through an initial phase of conceptual design in which the requirements requested by customers are considered: technological level, size of the aircraft, appropriate engines, airworthiness; comprehensive solutions in the form of schemes where aspects such as practical knowledge, production methods, and commercial scope have great relevance [6,7]. The design of an aircraft is a complex process that considers different disciplines holistically: safety requirements, reliability goals, performance specifications required by the mission to be fulfilled, among others [8]. For example, after establishing the preliminary design of the aircraft, stability is analyzed, and control surfaces are designed [9]. In the design of control surfaces, two aspects are particularly relevant, their dimensioning and the associated control laws. These aspects can be approached through optimization strategies. Regarding the design of control surfaces, through the application of an optimization process in the airfoils of a BWB, blended wing body configuration, an improvement in aerodynamic performance is obtained in a transonic regime [10]. Regarding optimization techniques, plant-controller optimization problems can be solved by sequential, iterative and simultaneous strategies, the latter being the one that guarantees optimal results due to the coupling of the fields [11]. Consequently, the dimensioning of control surfaces and the design of the corresponding control laws constitute a coupling problem, whose resolution can be approximated by techniques such as multidisciplinary optimization (MDO) or linear matrix inequalities (LMI), among others [12]. In obtaining the control variables and calculating the dynamic stability a CFD modeling by means of the panel method is proposed highlighting the importance of computer modeling to complement the results of experimental tests, such as wind tunnel testing [13]. The use of wind tunnels occurs in the last phases of the design. For example, the evaluation of the different aerodynamic behavior of a low aspect ratio wing at high angles of deflection by means of an experimental wind tunnel test campaign on a generic regional turboprop aircraft model with a modular vertical tail with a rudder [14]. However, sometimes, the quality of the air flow may affect the aerodynamic performance [15,16]. With the increase of the computer’s calculation capacity, in terms of memory, and speed, the programs have evolved in complexity, efficiency and precision of their results. Although programs based on numerical methodologies can be time-consuming in the development of simulations, they provide increasingly accurate results. For instance, the dynamic response data of modal analyses in aircraft’s structures can be identified through numerical methodologies as in [17].
Flow analysis by means of CFD is an alternative to carrying out expensive experimental tests performed, for example, with fully developed flows with high Reynolds numbers [18]. In this regard, a numerical model, based on the methods of the panels and images is proposed to analyze the influence of the dynamic ground effect on the aerodynamic characteristics of a rectangular wing [19]. On the other hand, the finite element method (FEM) allows, for example, designing a landing gear during the conceptual stage to analyze the impact loads during take-off and landing of an unmanned aircraft [20]. However, throughout the process of the conceptual design stage, problems may arise in the adaptation of mesh generation tools with other design programs. In this regard, a description list of programs used in the conceptual phase of aircraft design is displayed and highlights the increasing time designers spend on repetitive tasks such as mesh generation and refinement or iterative calculation for post-process analysis. To this end, a modeling methodology consisting of the parametrization of geometric variables of the external surfaces of an aircraft is proposed in order to increase the efficiency of the design process. In this way, the next new step for design and optimization consists of the fully automated framework of aircraft components [21]. A fully automated framework dedicated to the high-fidelity multidisciplinary design optimization of the passenger aircraft wing is developed, integrating a set of popular commercial software using their scripting capabilities [22].
Following this trend, this work focuses on the development of a methodology for the design of control surfaces in radio-controlled and unmanned aircraft that allows the improvement of efficiency in the design phase and provides the designer with more time for analyses in other design areas. The control surfaces considered are the elevator, the ailerons and the rudder. For the modeling, the proposed methodology considers the use of the open-source CFD program XFLR5 [23]. The work is structured as follows; section 2 describes the guidelines for the development of the design methodology for each of the control surfaces involved. Section 3 details the numerical and analytical approach to the methodology applied to control surfaces in radio-controlled experimental airplanes. Section 4 presents the results of applying the methodology to the latest aircraft design: the aileron’s design sensitivity analysis and the optimization of the control surfaces weight in relation to the aircraft’s takeoff weight.
2. Methodology
The first step to develop the design methodology is to classify the aircraft according to its Class, Phases of Flight, and Levels of Acceptability. This classification is made following FAA (Federal Aviation Administration) Part 23 airworthiness regulations for GA utility aircraft [24] and Mil-F8785C military standards for aircraft design used by the USAF (The United States Air Force) [25]. This allows us to set a working envelope for design as stated by aeronautical regulators regarding control requirements. The prototype is considered as a utility aircraft with a maximum takeoff weight (MTW) less to 6000 Kg. After the prototype is tossed, it must climb up to a determined height, then must complete turns, descent and land. During this mission, it is essential that the aircraft responds effectively to the control orders. Therefore, the prototype is defined as a “Class I” aircraft that must accomplish “Phase C” flight operations and from which is expected a “Level 1” of Acceptability.
2.1. Considered design variables
Design variables are categorized according to each control characteristics and requirements. The variables are classified in: environmental variables, geometrical variables, aerodynamic variables, and inertial variables. Table 1 summarizes some relevant environmental variables.
Geometrical Variables depend on lifting surface size (wing and empennage). These variables are interrelated with other aircraft’s components, and designers must consider its relative position to the center of gravity (CG) of the airplane. Some geometrical variables are the mean aerodynamic chord (MAC), the wingspan (b) and the aspect ratio (AR). The geometrical variables shown in Table 2 are restrained to the values specified.
The methodology evaluates geometrical relations from the minimum recommended value. If the minimum value does not satisfy the design requirements for that specific design stage, designers evaluate the next higher value until the requirement is met. Inertial variables are related to the airplane’s moments of inertia with respect to the CG. These variables depend on the punctual masses of each structural element, electronic components, and the payload of the airplane, see Table 3.
2.2. General considerations for control surface design
Once the variables are presented, some general design considerations must be established. The CG position is fixed during the flight mission because it is a UAV and does not burn fuel. The maximum control surface deflection must be less than the control deflection that causes the stall of the respective lifting surface [28].
Elevator design
The elevator is the longitudinal control surface about the lateral axis of the airplane. When the elevator is deflected upwards, the tail’s lift coefficient
 decreases, producing a nose-up pitching moment and causing the aircraft to climb. Operation is reverted when the elevator is deflected downwards. This surface helps to maintain longitudinal stability and is generally mounted in the horizontal stabilizer covering a portion of its chord. For elevator design must be established that: a) deflections (δ
E
) will be positive (+) downwards, b) a positive deflection (+) increases the horizontal stabilizer’s lift, generating an upward movement of the tail and a (-) pitching moment that causes the aircraft to descent. Table 4 indicates the parameters to obtain using the methodology:
decreases, producing a nose-up pitching moment and causing the aircraft to climb. Operation is reverted when the elevator is deflected downwards. This surface helps to maintain longitudinal stability and is generally mounted in the horizontal stabilizer covering a portion of its chord. For elevator design must be established that: a) deflections (δ
E
) will be positive (+) downwards, b) a positive deflection (+) increases the horizontal stabilizer’s lift, generating an upward movement of the tail and a (-) pitching moment that causes the aircraft to descent. Table 4 indicates the parameters to obtain using the methodology:

Aileron design
Ailerons provide lateral control about the plane’s longitudinal axis. For the ailerons, it must be taken into count that: a) every deflection (δ A ) will be positive (+) if produces a clockwise roll and b) every (+) deflection decreases the lift in the right wing and increases the lift in the left wing. This situation induces a clockwise roll and a subsequent turn to the right. The parameters to determine in the aileron methodology are shown in Table 5.
Rudder design
The Rudder provides directional control with respect to the vertical axis of the plane. The guidelines for the development of the methodology consider that: a) rudder deflection (δ R ) will be positive (+) to the left and b) positive deflection of the rudder produces a lateral force on the vertical stabilizer in the right direction, generating a negative yaw moment that turns the aircraft nose towards the left. The parameters to determine in the methodology are appreciated in Table 6. Landing and takeoff in crosswind conditions are the most critical condition for the rudder operation.

3. Methodology development
The control surface design process is presented by posing the design methodology for ailerons, elevator, and rudder.
3.1. Elevator design methodology
The goal is to calculate the elevator’s efficiency (τ
E
) in order to determine the chord relation between the elevator and the horizontal stabilizer
 and, ultimately, the elevator chord (C
E
) Figure 1 shows the chord ratio as a function of the elevator efficiency.
and, ultimately, the elevator chord (C
E
) Figure 1 shows the chord ratio as a function of the elevator efficiency.
If
 then
then
 Otherwise, if, then a separation of the boundary layer of the airflow on the top of the airfoil is likely to occur, and stall could be induced [29]. Thus, it is recommended that
Phase num. 1 Identification of longitudinal control requirements and determination of the elevator chord C E :
The elevator efficiency is calculated from Equation (1) and (αh) the angle of attack of the horizontal stabilizer, see Equation (2).

where
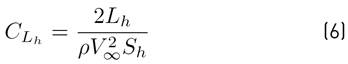
 is the horizontal stabilizer lift coefficient, see Equation (6),
 is the slope of the coefficient of lift of the horizontal stabilizer about the angle of attack (AOA) of the aircraft obtained from an analysis performed in the XFLR5 program.
 is the elevator’s maximum negative deflection (upwards) selected from the data in Table 2. From Equation (2),
 is the angle of attack of the horizontal stabilizer, a is the AOA of the aircraft during rotation and
 is the angle of incidence of the horizontal stabilizer. While in Equation (3), Ɛ is the downwash angle, represented by the flow lines that abandon the wing by its trailing edge and that are projected over the aircraft’s tail,
 is the angle of downwash when the wing has a AOA of 0, see Equation (4).
 is the coefficient of lift of the aircraft when the AOA = 0° and from Equation (5)
 is the variation of the curve’s slope between
 and the AOA,
 is the curve’s slope between the lift coefficient and the AOA which is obtained from the analysis performed in the XFLR5 program and AR is the wing’s aspect ratio which value comes from previous stages of the aircraft design.
The coefficient of lift of the horizontal stabilizer horizontal
 is calculated with Equation (6), where
 is the horizontal tail’s lift, which is obtained from diagramming the forces present in an aircraft during takeoff, determined by Equation (7) and
 is the planform surface of the horizontal stabilizer.

During takeoff, the control mission of the elevator is critical because it has to overcome the inertia and elevate the aircraft off the ground. Figure 2 represents the forces present in an aircraft at the moment of takeoff and Table 7 shows a summary of them.
From Equation (7),
 is the recommended angular acceleration for the aircraft during takeoff, 𝑎 is the linear acceleration about the longitudinal axis at the moment of tossing the aircraft and
 is the combined lift force of the wing and fuselage. The fuselage contribution in the generation of lift is approximately 10% of the wing lift [30]. In the case of the micro category aircraft’s, the fuselage has minimum influence regarding the generation of lift. Therefore, it is assumed that
 , see Equation (8) and
 is the distance to the wing-fuselage aerodynamic center which is located at ±5% of the MAC, mean aerodynamic chord, and the aerodynamic center of the wing at ±25% of the MAC [31]. As
 then
is located at 25% of the MAC. In Equation (8),
then
is located at 25% of the MAC. In Equation (8),
 is the aerodynamic variable that indicates the aircraft’s linear speed during takeoff rotation. In order to increase the safety, the margin is considered equal to the stall speed
 , and
, and
 is the coefficient of lift of the aircraft at takeoff.
From Equation (9),
 is the wing-fuselage moment in its aerodynamic center, where C is the MAC. Under the consideration
 then
then
 , and in the same manner the coefficient of moments
 . As long the Micro class prototype does not have landing gear, its
 position will be treated as the longitudinal position by which the aircraft is held when being tossed.

Vertical references of the aircraft are measured with respect to the
 coordinate of the launching point.
 is the coefficient of drag during takeoff, obtained by means of XFLR5. The action lines of Thrust (T) and Drag (D) forces also produce changes in pitch because they are not aligned with the longitudinal axis of the airplane. Once
 is obtained, it is substituted in Equation (6) (checked in phase 2) and in turn in Equation (1),
 and
and
 are calculated. If
 the phase is culminated.
Phase num. 2 comparison of results CLh with XFLR5
It is checked that the horizontal stabilizer lift coefficient value
 is approximate to the one calculated using numeric methods, to the one obtained by the CFD modelling. In this case, with XFLR5 program under the same flow conditions and the same angle of attack. Given some previous experiences of the design team with aero models, a difference of less to 25% between both results is considered acceptable.
Phase num. 3 calculus of the maximum deflection at cruise δmaxcr
This phase consists of evaluating the elevator control function of assuring longitudinal stability in cruise flight. The aerodynamic forces present in an aircraft during takeoff are considerably different from those found in cruise flights. During the flight, the maximum deflection
 required for keeping the aircraft’s longitudinal control is less than during takeoff. In Figure 3, the forces present in an aircraft during cruise flight are shown.
Designers must verify that the maximum positive deflection during cruise flight
 is less than the maximum negative deflection at takeoff
 , Equation (10). For this verification, three longitudinal control derivatives are calculated by Equation (11) (Pitch moment control derivate,
 , Equation (12) (aircraft lift control derivative,
 , Equation (13), (Horizontal stabilizer lift control derivative,
 , respectively.

(ηh) is the tail efficiency Dynamic Pressure ratio in the zone of the horizontal stabilizer [32]. Its reference value ranges between 0.85 and 0.95. (Vh) is the volume coefficient of the horizontal stabilizer, a value that must have been calculated in previous design stages. (bE) and (bh) are the elevator and horizontal stabilizer spans, respectively Thus, maximum (+) deflection in cruise flight is, Equation (14).
 is the aircraft’s pitching moment coefficient obtained by XFLR5 when AOA = 0°,
 is aircraft’s pitching moment curve slope as a function of the change in the AOA, which is determined by analysis in XFLR5 and q is the dynamic pressure in the elevator. From Equation (15),
 is the coefficient of lift in cruise flight, and 𝑊 is the aircraft’s MTW.
Finally, if the Equation (10) criterion is accomplished, then the phase culminates. If it is not accomplished, designers must return to phase num. 1. Ultimately, from
 a
a
 value is calculated.
Phase num. 4 stall at takeoff avoidance
It must be verified that the elevator deflection at takeoff does not induce a stall over the horizontal stabilizer during takeoff. According to the recommendation in Table 2, if the downward or upward elevator’s deflection does not exceed 25°, then stall should not occur. Thus, designers recommend a maximum upwards and downwards deflection of 25° in order to avoid a stall.
3.2 Aileron design methodology
In this section, the parameters related to the aileron design are calculated; some of them are the steady- state roll rate
 , the moment of roll
 , the aerodynamic coefficient of the aileron during roll
 and its control derivative
  .
.
Phase num. 1 identification of lateral control requirements and determination of preliminary geometrical relations
Some preliminary geometrical relations are to be determined, specifically the inner
 and outer aileron tips coordinate along the aircraft’s lateral axis, see Table 5. By recommendations of the military standards, the outer tip of the aileron is located between an 85% and 90% of the half-wing span
 and that the span ratio
 is in the range of 0.6-0.8 [27]. A preliminary aileron-to-wing chord
 was also selected, as shown in Table 2. From this relation, the aileron’s efficiency
 was determined to be used in later stages of the design.
Based on the geometry relations, the designer calculates the Steady State Roll Rate (PSS). This condition occurs when the Roll moment is balanced with the Restoring moment caused by the airplane’s lateral stability. If the ailerons do not return to their neutral position, the airplane will continue to roll until the wings reach an angle where no further lift can be generated. (PSS) can be calculated by Equation (16).

 is the vertical stabilizer planform surface,
 is the coefficient of drag during roll determined from XFLR5,
  is the coordinate of mean drag of the three lifting surfaces (wing, horizontal and vertical stabilizers) located at 40% of the aircraft‘s half-wing span measured from the wing root.
 is the moment of roll due to the maximum aileron deflection, given by Equation (17).


Where (b) is the aircraft’s wingspan and
 is the aerodynamic coefficient of the aileron during roll, Equation (18). From that Equation,
 is the maximum aileron deflection in radians whose selection is recommended in Table 2 and
 is the lateral control derivative of the aileron aerodynamic coefficient during roll, obtained from Equation (19). When integrating within the inner
 and outer
 coordinates of the aileron and considering a tapered wing (λ), Equation (20) is obtained.
 is the ratio of change of the aircraft’s lift coefficient about the angle of attack and it is considered constant along the wingspan. Factor “2” is inserted in the equation because there are two ailerons.
Phase num. 2 bank angle calculation ( 𝛟 𝟏 )
The bank angle
 is that angle formed between the horizon and the aircraft’s wings as observed in Figure 4. For the prototype’s classification, the military standards indicate that the aircraft must reach a determined bank angle in a specific time. This angle and time are denoted as
 and
and
 and for the aircraft’s classification they have the values of 30° and 1.3s respectively, according to the standard Mil-Std 8785-C [25]. With the
 is calculated the bank angle
 following the selected conditions from Equation (21).
If
 then calculate
 by Equation (22).
 is the time that the aircraft needs to reach the required bank angle
 . For that, the rate of roll
 is determined in Equation (23). If
 , then calculate
 , which is the time that the aircraft needs in order to reach the required bank angle
 . This time is the sum of the time that the aircraft takes to reach the steady-state roll rate
 and the time difference
 for reaching the required bank angle; this is calculated as indicated in Equations (24), (25), and (26).

A maximum difference between
 and
and
 must not exceed 10%. If this condition is fulfilled, this phase is finished. On the contrary, return to phase num. 1, selecting the coordinates of the aileron tips. If the aircraft is under the requirement for its roll performance, then the initial span relations were correctly selected, and it is now a process of optimization whereby the number approaches that of the requirement.
Phase num. 3 stall in operation avoidance
According to the recommendation in Table 2, if the downward or upward aileron’s deflection does not exceed 25°, then stall should not occur. Generally, the airplane is designed for a stall to occur from the root of the wing in direction to the tip, allowing lateral control for the longest possible time. Nevertheless, aerodynamic studies on stall conditions are outside this research scope.
3.3. Rudder design methodology
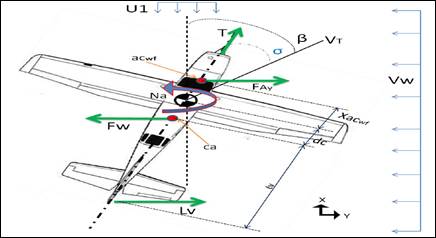
The rudder should be capable of keeping aircraft’s directional control in every; still, a specific control mission is determined, for example, aerobatic maneuvers or adverse weather operations. For Micro class aeromodels, it has been determined that the critical control mission of the rudder is to keep directional control in flight with a crosswind [33].
Phase num. 1 identification of directional control requirements and selection of critical flight control mission
According to the Federal Aviation Regulations (FAR) in their section N°23, utility aircraft must keep directional control while in a crosswind blowing perpendicular to their flight trajectory [24]. In a similar sense, the military standard establishes that the maximum wind component which is applicable for design must be 20 knots for these types of model´s classification [25]. However, considering the small size of the model aircraft, it is convenient to design for a maximum wind component between 8 and 10 knots. Furthermore, it is worth mentioning that this crosswind operation is more critical during takeoff and landing phases, when the flight speed approaches the stall speed of the aircraft
 . The relative wind
 corresponds to the combined components of the wind coming from in front of the aircraft and the crosswind, as observed in Equation (27).
Wind loads are applied in a point denominated aerodynamic center
 this point is located in the airplane’s profile over the side surface exposed to the wind
 . For calculating that area’s centroid, the model profile is subdivided into areas of recognizable geometry, and the “x” coordinate of the centroid of the surface is calculated as in Equation (28).
In this equation,
 corresponds to the area of each figure comprising the total surface,
 is the coordinate of each figure’s centroid about the aircraft’s longitudinal axis. The aerodynamic center is separated from the model CG by a distance called
 . According to the directional stability analysis in XFLR5 program, it is favorable to flight operations that the aerodynamic center
 is located behind the aircraft’s CG.
Phase num. 2 rudder deflection (δ R ) and crab angle (σ) calculation
To control the airplane in crosswinds, the pilot must correct the drift by the action of the rudder, this maneuver is called crabbing and allows the aircraft to stay on course without sliding in the wind. The Crab angle (σ) is the angle formed between the direction of the relative wind and the longitudinal axis of the aircraft, Figure 5.
To calculate rudder deflection and crab angle, designers need to: select a rudder-vertical stabilizer chord
 according to Table 2. Utilizing this ratio, the rudder effectiveness
 is obtained from Figure 1, performing a mechanical analysis of the forces present during crosswind operations as seen in Figure 5. This mechanical analysis results in a system of nonlinear equations which is constituted by aerodynamic, environmental and geometric variables. The system of equations must be solved to obtain the rudder deflection
 and the crab angle (σ), Equations (29) and (30).
where
 is the maximum rudder deflection recommended by Table 2,
 is referred to the wind force calculated as a function of the side area
 and of the crosswind component
 , Equation (31). In the same equation,
 is the coefficient of side drag that has a value between 0.5 and 0.8 [27]. β is the sideslip, obtained from Equation (32).
From Equation (33),
 is the stability derivative that measures the aircraft’s change of directional position about the sideslip angle. This derivative’s calculation considers the contribution of the fuselage, wing, and vertical tail, in which the vertical tail has the most significant contribution [34]. In Equation (34),
 represents the stability derivative that measures the change in the yaw moment about the sideslip angle [27],
 corresponds to the slope of the vertical stabilizer coefficient of lift about the AOA. This aerodynamic variable comes from a numeric analysis in XFLR5 program.
 is the dynamic pressures ratio in the zone of the vertical stabilizer [32]; this has a recommended value between 85% and 95%.
 measures the vertical stabilizer arm,
 is the vertical stabilizer planform surface,
 is a correction factor for the fuselage contribution to the control derivative
 and is between (0.65 <
 < 0.85) [27].
 is a correction factor the fuselage contribution to the control derivative
 and is between
 [35]. Because the model’s fuselage aerodynamic contribution is considerably small
 and
and
 are considered to be less than the recommended values. To calculate directional control derivatives,
 and
and
 , are developed in Equations (35) and (36).
 and
and
 are the coefficient of volume of the vertical stabilizer and its span determined in previous aircraft design stages, respectively. Once the elements for the equations system are obtained, the system is solved to obtain the crab angle
 and the rudder’s deflection
 .
.


3.4. Selection of servomotors
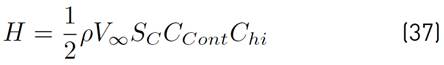
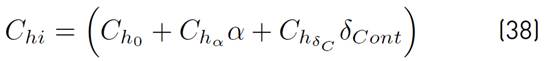
To determine the required torque to actuate the control surfaces, designers must perform a study to calculate each surface’s Hinge Moment (H). Then, the required Servo force can be determined by multiplying (H) by the Servo’s deflection rate and by the control surface’s deflection rate. 𝐻 is obtained by multiplying the required Servo force by the arm that connects the Servo with the control surface, Equation (37).
 refers to the reference control surface planform area to evaluate, and
 is the chord of the control surface to evaluate. From Equation (38),
 is the coefficient of the hinge moment, (a) is the maximum angle of attack of the aircraft in its flight envelope,
 is the coefficient of the hinge moment when the AOA = 0°,
 is the slope of the curve of the coefficient of the hinge moment about the AOA and
 represents the change in the hinge moment with respect to the control surface deflection.

4. Results
The use of the proposed methodology allows standardizing the design of the control surfaces in Micro Class prototypes of UNIMET SAE Aero Design. Reduction in time use regarding this design stage is considerable, allowing a more efficient use of resources available to finish the project within the deadlines.
4.1 Aileron’s design sensitivity analysis
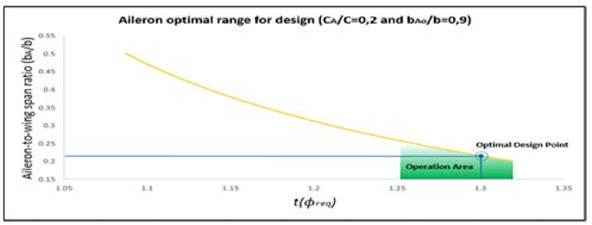
In the case of the latest aircraft design, the aileron’s needed to assure a 30° bank angle in 1.3s. For this requirement, a sensitivity analysis was performed by setting the aileron-to-wing chord ratio
 at 20% and the aileron’s outboard position at 90% of the wing semi-span. Then, the aileron-to-wing span ratio was iterated until the requirements were met. Figure 9 shows the sensitivity analysis’ optimal result within the operative boundaries suggested by designers.
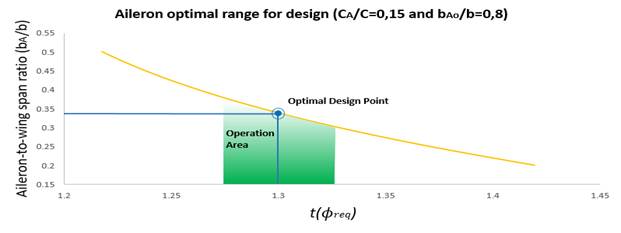
Figure 10 shows the sensitivity analysis’ optimal result for an aileron-to-wing chord ratio
 at 15%, and the aileron’s outboard position at 80% of the wing semi-span.
The analyses aim to provide a visual tool to determine the design boundaries when varying the aileron’s outboard position, the aileron-to-wing chord ratio and the aileron-to-wing span.
4.2. Weight analysis of the control systems
Micro Class in SAE Aero Design demands, among other challenges, that the aeromodels have the least empty weight
 possible. Thereby, control systems’ weight directly affects the design objectives. The application of the methodology allows reducing the size of the control surfaces dimensions and reduce the
 without sacrificing the control mission requirements. As a comparison, the relation between the total weight of control systems
 and
and
 of prototypes from 2018, 2019, and 2020 competitions is shown in Table 8.
 .is the sum of the weights of structure and coating of Elevator, Rudder and Ailerons, as well as the servo motors that move each of these surfaces. The servo motors selection depends on the required torque to move the control surfaces [36].

In 2018, the team designed control surfaces following recommended sizing from literature examples [36]. This approach led to oversizing the control surfaces. The following year, designers established control mission requirements for each surface and approached a preliminary version of the design methodology [37]. This helped reduce control surface size but did not satisfy adequate handling characteristics for the flight mission. In 2020, the proposed methodology helped reduce the
 (g) in 1.1% compared to the 2019 prototype. Therefore, designers are now able to distribute the spared weight in the selection of a more potent power plant and to manufacture a more robust structure to absorb landing stresses.
5. Conclusions
The proposed methodology has enabled the development of a sequence of stages in the process of design and optimization of control surfaces in prototypes of the Micro Class of Aero Design. Its application has allowed the reduction of the relation between control systems to aircraft’s empty weight in circumstances with higher empty weight requirements. In addition, the methodology facilitates the performance of sensitivity analysis with design parameters until optimal results are obtained. It is recommended to adapt the methodology to model aircraft whose characteristics and mission are different from those required for the Micro category of the SAE Aero design competition. In the same sense, it is proposed to evaluate the methodology for the design of the rudder under critical conditions different from the landing and takeoff to crosswind, such as coordinated turn, adverse yaw and spin of the aircraft.

